

Abstract
Objective
To investigate the relationship between cognitive control and metabolic syndrome (MetS) risk factors in preadolescent children while controlling for aerobic fitness and weight status.
Methods
Hierarchical regression analyses were conducted using aerobic fitness, demographic, and MetS risk factor variables in a sample of 2nd and 3rd grade children (n = 139) who performed a modified version of a flanker task to assess cognitive control. Flanker performance was also compared between children that met no MetS risk factor criteria (n = 70), and children who met one criterion or more (n = 69).
Results
Regression analyses indicated that after controlling for demographic variables and fitness, HDL cholesterol exhibited an independent negative association with flanker reaction time (RT). Group comparisons further revealed that children with no risk factors demonstrated overall shorter RT compared to the at-risk group. Additionally, at-risk children exhibited larger accuracy interference scores (i.e., poorer performance) for the more difficult conditions of the flanker task that require the upregulation of cognitive control to meet elevated task demands.
Conclusions
These findings are consonant with the previous literature reporting a beneficial influence of aerobic fitness on cognitive control, and reveal new evidence that children without risk factors for MetS exhibit better inhibitory control and increased cognitive flexibility compared to at-risk children. In addition to aerobic fitness, these risk factors may serve as important biomarkers for understanding the potential cognitive implications of MetS risk in younger generations.
Keywords: Inhibitory Control, Cognitive Flexibility, HDL, Aerobic Fitness, Flanker
Concomitant with the increased prevalence of childhood obesity in the United States has been the increasing risk of metabolic syndrome (MetS) in youth (Duncan, Li, & Zhou, 2004; Saland, 2007). MetS is diagnosed by the presence of three out of five cardiovascular risk factors that may include: central obesity, elevated blood pressure (BP), raised triglycerides (TG), reduced high-density lipoprotein cholesterol (HDL), and hyperglycemia (Okosun, Boltri, Lyn, & Davis-Smith, 2010). It is estimated that 6–10% of children and adolescents in the U.S. have MetS, and over 60% have at least 1 risk factor (de Ferranti, Gauvreau, Ludwig, Newburger, & Rifai, 2006). Emerging evidence suggests that the presence of this adverse metabolic profile not only increases the risk of developing type 2 diabetes and cardiovascular diseases (CVD), but may also have deleterious consequences for brain health and cognitive function.
Despite the lack of a “gold standard” definition for pediatric MetS (Agatston et al., 2012), the presence of MetS risk factors as early as 5 years of age is predictive of adult type 2 diabetes (Morrison, Friedman, Wang, & Glueck, 2008). Also during these early years, aspects of children’s cognition that are crucial for future school readiness and greater academic performance begin substantial development (Diamond, Barnett, Thomas, & Munro, 2007). As such, the pathological processes associated with adult metabolic dysregulation may have their origins in preadolescent childhood, making early identification of the physical and mental health implications of MetS risk factors a public health priority.
Existing evidence indicates that MetS risk factors may be associated with deficits in aspects of cognition known as cognitive control, which describes a subset of goal-directed, self-regulatory operations encompassing the core processes of inhibition, working memory, and cognitive flexibility (Diamond, 2013). Among older adults, MetS has been associated with an increased risk for cognitive decrements (Taylor & MacQueen, 2007; Yaffe et al., 2004); however, the influence of MetS risk factors on cognitive processes underlying children’s scholastic achievement, including cognitive control (Bierman, Nix, Greenberg, Blair, & Domitrovich, 2008), remains unknown. To date, the majority of this health-related research has focused on children’s aerobic fitness and weight status, and have revealed that both higher fit (Davis & Cooper, 2011; Pontifex et al., 2011) and normal weight (Kamijo et al., 2012; Li, Dai, Jackson, & Zhang, 2008) children exhibit superior performance on cognitive control tasks compared to their peers who are classified as lower fit or overweight/obese, respectively. However, only a handful of studies have examined relationships between MetS and its underlying risk factor components with specific aspects of cognitive control.
Tascilar et al. (2011) recently used neuroimaging (i.e., event-related brain potentials [ERPs]) to compare the P3 component using a simple auditory discrimination task in obese and normal weight children (8–12 years old). ERPs refer to measurable patterns of neuroelectric activation that occur in response to, or in preparation for, stimuli and responses, and the P3, embedded within the ERP, is evoked when individuals attend to or discriminate between stimuli (Polich and Kok, 1995). Tascilar et al. (2011) reported that in addition to elevated fasting blood glucose levels (FBG), higher TG, and decreased levels of HDL, obese children exhibited smaller P3 amplitude and longer latency, indicating a decreased ability to allocate attentional resources toward stimulus engagement and delayed stimulus classification and processing speed, respectively (Polich, 2007; Tascilar et al., 2011). Intriguingly, when the obese children were divided into groups with or without insulin resistance, further reductions in P3 amplitude and longer latencies were observed in participants with insulin resistance. Additional evidence has since revealed that adolescents (mean age = 17.6 years; range = 14–20) with MetS demonstrate lower performance across a host of cognitive domains, including academic achievement, attention, and cognitive flexibility, compared to control participants with less than 3 risk factors (Yau, Castro, Tagani, Tsui, & Convit, 2012). Brain imaging methods also revealed smaller hippocampal volumes and poorer white matter microstructural integrity in adolescents with MetS, but perhaps more telling was that the large number of cognitive differences became more pronounced when control participants were limited to only individuals without a single MetS risk factor. As the authors note, decreased cognitive/academic performance and smaller hippocampal volume were observed relative to an increase in the number of MetS risk factors (Yau et al., 2012). Thus, it appears that cognitive differences exist between children with no risk factors and those meeting just 1 or 2 criteria for MetS.
These initial studies in children and adolescents with MetS have unveiled cognitive differences that are both consonant with the adult literature and align closely with previous neuroimaging studies reporting differences between higher and lower aerobically fit children (Chaddock et al., 2010a, 2010b; Hillman, Buck, Themanson, Pontifex, & Castelli, 2009; Hillman, Castelli, & Buck, 2005; Pontifex et al., 2011; Voss et al., 2011). Importantly, the pattern of results also suggests that children at greater risk for MetS, to varying degrees, exhibit poorer cognitive performance than those without risk factors; however, there has yet to be an investigation of children’s cognitive control that incorporates measures of both aerobic fitness and MetS risk in a single study. Such evidence would be meaningful bearing in mind that previous studies have shown considerable relatedness between these variables, such that aerobic fitness attenuates MetS risk across multiple body mass index (BMI) weight-class categories in young children (Dubose, Eisenmann, & Donnelly, 2007).
Accordingly, the current study investigated the relationship between MetS risk factors and cognitive control among 2nd and 3rd grade children, while controlling for aerobic fitness and weight status. We hypothesized that children without risk factors for MetS would demonstrate superior inhibitory control as evidenced by shorter RT and higher accuracy scores during performance of a flanker task. In addition, this pattern of results was expected to be disproportionately greater for the difficult conditions of the task necessitating increased cognitive control, similar to the patterns witnessed in previous investigations of children’s aerobic fitness (Chaddock et al., 2010b; Pontifex et al., 2011; Voss et al., 2011). The identification and explication of the role of MetS risk factors influencing childhood cognitive and brain health is of critical importance for scholastic achievement and cognitive well-being during development, and across the lifespan (Diamond, 2013).
Method
Participants
Second and third grade children were recruited (by flyers mailed to guardians) from 17 schools in the Lawrence, Kansas area to participate in a larger cluster randomized trial investigating the effects of physically active academic lessons delivered by classroom teachers on academic outcomes (Donnelly et al., 2013). Recruitment was targeted towards all children and not only those who were overweight or had higher likelihood of meeting the criteria for MetS. The data used for the current study were collected during baseline testing for the larger investigation. Due to a large response, a random sample of students (stratified by grade and sex) from each school was selected from those who provided parental consent/child assent. Guardians completed a demographic questionnaire to provide information about the grade, age, sex, ethnicity, and race of their child, as well as household income. The University of Kansas Medical Center Human Subjects Committee approved the study. Table 1 provides a summary of participant demographics and cardiovascular mean values.
Table 1.
Participant Demographic and Cardiovascular Mean Values (SD).
| Measure | No Risk | ≥1 Risk Factor | All Participants |
|---|---|---|---|
| n | 70 (35 female) | 69 (43 female) | 139 (78 female) |
| Age (year) | 7.6 (0.5) | 7.5 (0.6) | 7.6 (0.6) |
| Grade | 2nd (42.9 %) 3rd (57.1 %) |
2nd (53.6 %) 3rd (46.4 %) |
2nd (48.2 %) 3rd (51.8 %) |
| Household Income | 6.9 (3.5) | 6.2 (3.1) | 6.6 (3.3) |
| BMI (kg/m2)** | 16.7 (2.1) | 19.5 (4.0) | 18.1 (3.4) |
| Waist Circumference (cm)** | 55.4 (4.8) | 61.6 (9.9) | 58.5 (8.3) |
| PACER (# of laps)** | 19.4 (8.5) | 15.2 (8.0) | 17.3 (8.5) |
| Systolic BP (mmHg)** | 99.6 (7.0) | 104.0 (9.4) | 101.8 (8.6) |
| Diastolic BP (mmHg)* | 57.2 (4.5) | 59.2 (5.5) | 58.2 (5.1) |
| Fasting glucose (mg/dl) | 88.5 (6.7) | 89.3 (13.6) | 88.9 (10.7) |
| Triglycerides (mg/dl)** | 54.3 (16.4) | 73.3 (26.4) | 63.7 (23.9) |
| Total cholesterol (mg/dl)** | 158.3 (19.0) | 147.8 (22.3) | 153.1 (21.3) |
| LDL (mg/dl) | 88.4 (18.9) | 86.0 (19.2) | 87.2 (19.0) |
| HDL (mg/dl)** | 59.0 (6.3) | 47.1 (7.4) | 53.1 (9.1) |
| BMI Percentiles | (# of Children) | (# of Children) | Total (%) |
| Underweight (< 5th) | 1 | 0 | 1 (0.7 %) |
| Normal weight (5 – 84th) | 55 | 31 | 86 (61.9 %) |
| Overweight (85 – 94th) | 11 | 14 | 25 (18.0 %) |
| Obese (≥95th) | 3 | 24 | 27 (19.4 %) |
Note:
p < .01,
p < .05 between risk factor groups; BMI - body mass index; BP - blood pressure; LDL/HDL - low/high density lipoprotein cholesterol.
Testing Procedure
Testing for this study was completed over the course of 3 days for each child, with aerobic fitness and cognitive testing taking place on separate occasions. Data collection for the entire sample was completed over the course of ~ 1 month to incorporate all participating schools. All assessments were completed at the children’s respective schools by research staff that were trained and supervised by a qualified co-investigator. For cognitive testing, participants were individually removed from their classroom and brought to a quiet area, such as an unused counselor’s office or classroom, which remained free of distractions. Each child was comfortably seated at a large desk where they completed the cognitive control task (described below) using a laptop and a handheld response pad (model: TR-1×4-CR; Current Designs Inc., Philadelphia, PA).
Aerobic Fitness Testing
The 20 meter Progressive Aerobic Cardiovascular Endurance Run (PACER) subtest of the FitnessGram® was used to assess children’s aerobic fitness. The PACER has an extensive literature describing the reliability and validity of the test in adults and children (Léger & Lambert, 1982; Léger, Mercier, Gadoury, & Lambert, 1988). Correlations between the PACER and laboratory-based measures of aerobic fitness are moderate to strong, ranging from r = 0.65 to 0.83 (Mahar, Guerieri, Hanna, Kemble, 2011; Varness, Carrel, Eickoff, & Allen, 2009). The PACER was administered in small groups, typically 8–12 students, with at least 1 research staff member per 3 children, and another staff member overseeing the test. During the PACER, children were instructed to run back and forth between 2 lines, 20-meters apart, as they were paced by a tone on a CD player signaling when he or she should reach the opposite line. The pace began slowly and became progressively faster until the child failed to traverse the 20-meter distance in the time allotted on two occasions, at which point the test was over (Carrel et al., 2012; Welk & Meredith, 2008). The greater number of laps a child was able to complete indicated a higher level of aerobic fitness.
MetS Criteria & Group Assignment
Following an overnight fast (12 hours), blood samples were collected from the participant’s antecubital vein by a licensed phlebotomist. Participants were provided with a breakfast consisting of a bagel, fruit, and juice following the blood draw. Blood samples were immediately transported to the laboratory and processed by centrifuging the samples at −4°C and 2000G for 15 min., and then the plasma and serum were placed in pre-labeled 1.8ml cryovials vials. The samples were stored at −70°C until shipped to the University of Colorado Health Sciences Center (Denver, CO) for analysis. Biomedical measures assessed included FBG, insulin, total cholesterol, low-density lipoprotein cholesterol (LDL), HDL, and TG. FBG, total cholesterol, LDL, HDL, and TG concentrations were measured enzymatically using an Olympus AU400e automated clinical chemistry analyzer (Beckman Coulter, Inc., Brea, CA). Insulin levels were measured using a competitive radioimmunoassay manufactured by Linco Research (Millipore, Inc, Billerica, MA).
MetS risk factor criteria were based on cutoffs recommended by de Ferranti et al. (2004), which include: HDL (< 50 mg/dL), waist circumference (WC; > 75th percentile for sex and age; Fryar, Gu, & Ogden, 2012), systolic and/or diastolic BP (> 90th percentile for sex, age, and height; Falkner & Daniels, 2004), TG (≥100 mg/dL), and FBG (≥110 mg/dL). This pediatric definition was selected because the cutoff value for each risk factor was designed to be closely analogous to the Adult Treatment Panel III (ATPIII; de Ferranti et al., 2004). As de Ferranti and colleagues note, other proposed pediatric definitions of MetS (of which there is no standard) use restrictive cholesterol and adiposity cut-points that likely underestimate the prevalence of MetS risk in children. For example, an HDL level of 40 mg/dL represents approximately the 10–25th percentiles in boys and girls versus the 40th percentile cut-point in adults, as recommended by the ATPIII (de Ferranti et al., 2004). Lastly, children were divided into those with no risk factors (n = 70) and those exhibiting one or more of the risk criteria (n = 69).
Cognitive Control Task
Inhibitory control was assessed using a modified Eriksen flanker task (Eriksen & Eriksen, 1974). This task has been previously used to measure children’s ability to inhibit unnecessary or interfering information in the stimulus environment (Mezzacappa, 2004; Pontifex et al., 2011; Voss et al., 2011). The current task required participants to respond to the direction of a centrally presented child-friendly stimulus, or goldfish “
 ” amidst lateral flanking goldfish on each side. Flanking goldfish always faced the same direction; thus, congruent trials resulted whenever the direction of the central and flanking goldfish matched, and incongruent trials occurred when they did not match (please refer to Voss et al., 2011 for stimuli examples). Stimuli were 2 cm tall yellow goldfish, and trials were presented focally for 200 ms on a light blue background with a fixed inter-stimulus interval (ISI) of 1700 ms. During the compatible condition, which was completed first, participants were instructed to respond as quickly and accurately as possible according to the direction that the central (i.e., target) goldfish faced. Using their thumbs, participants made a left button press when the central goldfish faced left and a right button press when it faced right. Task difficulty was increased during the incompatible condition by reversing the stimulus-response mappings, such that participants responded opposite the direction of the central, target goldfish. In both conditions, a 40 trial practice block was completed prior to a 100 trial block, both of which were evenly divided among congruent and incongruent trials with equiprobable directionality of the target stimuli. Participants were excluded from analyses if their mean flanker performance was below chance (i.e., 50%) across compatible and incompatible conditions (n = 40)1, or if the child was reported as having a neurological disorder, ADHD, or a learning disability (n = 16). Participants who were absent for school during testing or missing necessary demographic information were also excluded (n = 11). Thus, 139 total children were incorporated into the final analyses.
Statistical Analysis
The prevalence of MetS was calculated overall, and according to sex and weight status (i.e., BMI ≥ 85th percentile). Fisher’s exact test was incorporated to identify significant differences in the prevalence of MetS and for each of the individual risk factors across these classifications. Pearson product-moment correlations were used to identify relationships between aerobic fitness and demographic variables including: the number of laps run on the PACER test, BMI, age, grade, sex (coded as 0 = female, 1 = male), and household income (coded as 1: < $10,000 per year, through 11: > $100,000 per year, with $10,000 increments) using SPSS v.21 (IBM Corp., Armonk, NY). MetS risk factor variables were also included: systolic/diastolic BP, WC, HDL, FBG, and TG. Although LDL is not listed among risk factor variables for MetS, it was included among the bivariate analyses for possible comparisons with previous investigations (Perry, Stigger, Ainsworth, & Zhang, 2009). Additionally, correlations involved the four dependent flanker variables (congruent RT/accuracy, incongruent RT/accuracy), which were included from each response compatibility manipulation (compatible/incompatible). Finally, flanker accuracy interference scores were calculated within each compatibility condition (congruent minus incongruent trial accuracy), as well as across compatibilities (compatible minus incompatible accuracy) for each trial type. Thus, larger positive numbers indicate greater interference (i.e., poorer performance) and provide an indication of how children perform as flanker difficulty increases.
Hierarchical regression analyses (n = 139) were incorporated to further examine each dependent flanker variable by entering demographic variables into Step 1, aerobic fitness in Step 2, and significant MetS risk factors in Step 3. Grade was included as a demographic factor in these analyses rather than age because it was more strongly associated with all other variables. Assumptions of linearity, equality of variance, independence, and normality were plotted, inspected, and verified using studentized residuals. Multicolinearity was not observed among any of the independent variables. Accuracy and RT were separately compared between children with (n = 69) and without (n = 70) risk factors for MetS using a Compatibility (compatible, incompatible) × Congruency (congruent, incongruent) multivariate analysis of variance (MANOVA) with Risk Factor (i.e., 0 vs. ≥ 1) as a between-subjects factor2. Flanker accuracy interference scores were compared using independent samples t-tests. Post-hoc comparisons were conducted using Bonferroni correction and Cohen’s d is reported to indicate effect size. Significance levels were set at p = .05 for all analyses.
Results
Prevalence of MetS Risk
Table 2 displays the prevalence rates of MetS and the individual risk factors according to sex and weight status. The overall prevalence of MetS was 6.5%, with the most common risk factors being low HDL (40.3%), central obesity (16.5%), and high BP (11.5%). Just over half of the children (50.3%) had no risk factors for MetS, while 32.4% had 1 risk factor, 10.8% had 2 risk factors, 4.3% had 3 risk factors, and 2.2% had 4 risk factors (no child had all 5 risk factors). No differences in MetS risk factors were observed as a function of sex (p’s ≥ .057). As for weight status, children who were overweight or obese (≥ 85th percentile BMI-for-age) exhibited a higher prevalence of MetS (17.3% vs. 0.0%), elevated TG (13.5% vs. 0.0%), low HDL (59.6% vs. 28.7%), and larger WC (44.2% vs. 0.0%), p’s ≤ .001. However, no differences were observed for high BP or FBG (p’s ≥ .108).
Table 2.
The Distribution of MetS Risk Factors According to Sex and Weight Status.
| Male / Female n (%) |
BMI < 85th / BMI ≥ 85th Percentile n (%) |
||
|---|---|---|---|
| Metabolic syndrome b | 3 (4.9%) / 6 (7.7%) | 0 (0.0%) / 9 (17.3%) | |
| High blood pressure | 8 (13.1%) / 8 (10.3%) | 7 (8.0%) / 9 (17.3%) | |
| High fasting glucose | 0 (0.0%) / 2 (2.6%) | 1 (1.1%) / 1 (1.9%) | |
| High triglycerides b | 3 (4.9%) / 4 (5.1%) | 0 (0.0%) / 7 (13.5%) | |
| Low HDL a,b | 19 (31.1%) / 37 (47.4%) | 25 (28.7%) / 31 (59.6%) | |
| Central obesity b | 7 (11.5%) / 16 (20.5%) | 0 (0.0%) / 23 (44.2%) | |
|
| |||
| Total (n = 139) | 61 (44.0%) / 78 (56.0%) | 87 (63.0%) / 52 (37.0%) | |
Note:
p = .057, males vs. females,
p ≤ .001 between weight status groups; HDL - high density lipoprotein cholesterol.
Flanker Regression
Initial Pearson product-moment correlations revealed that aerobic fitness was significantly related to WC (r = −.30, p < .001), HDL (r = .31, p < .001), and TG (r = −.28, p = .001). That is, children with higher aerobic fitness had smaller WC, greater levels of HDL, and lower levels of TG. Aerobic fitness was also associated with demographic variables including BMI (r = −.38, p < .001), grade (r = .19, p = .03), and sex (r = .21, p = .01); a trend for household income (r = .15, p = .08) was observed as well. Thus, more aerobically fit children had lower BMI and were older, male, and living in higher income families. This pattern highlights the need to control for these demographic factors. Regarding the dependent cognitive outcomes, HDL (r’s ≥ −.27, p’s ≤ .002), TG (r’s ≥ .21, p’s ≤ .012), and fitness (r’s ≥ −.26, p’s ≤ .002) all demonstrated significant associations with flanker RT across both trial types in each compatibility condition.
The regression analyses are summarized in Table 3. Correlations suggested no significant relations between LDL or flanker accuracy and any of the other variables; thus, based on the study purpose and the a priori hypotheses, only RT regression analyses are reported below. Demographic variables including grade, sex, household income, and BMI were entered into Step 1 of the analyses. Aerobic fitness was entered at Step 2 based on its significant correlation with flanker RT, and both HDL and TG were entered in Step 3 to determine if the incremental amount of variance accounted for by either risk factor remained significantly associated with flanker RT.
Table 3.
Summary of Hierarchical Regression Analyses for Flanker RT.
| Model and Variables | Flanker Compatible | Flanker Incompatible | ||||||
|---|---|---|---|---|---|---|---|---|
| Congruent | Incongruent | Congruent | Incongruent | |||||
| ΔR2 | β | ΔR2 | β | ΔR2 | β | ΔR2 | β | |
| Step 1 | .035 | .024 | .059 | .059 | ||||
| Grade | −.10 | −.07 | −.12 | −.11 | ||||
| Sex | −.15 | −.13 | −.19* | −.21* | ||||
| Household Income | −.05 | −.04 | −.02 | −.02 | ||||
| BMI | .02 | .04 | .11 | .06 | ||||
| Step 2 | .087** | .066** | .049** | .038* | ||||
| PACER (# of laps) | −.34** | −.30** | −.25** | −.23* | ||||
| Step 3 | .068** | .058* | .035 | .044* | ||||
| HDL | −.21* | −.22* | −.16 | −.18a | ||||
| Triglyceride | .15 | .11 | .09 | .10 | ||||
Note:
p < .01,
p < .05,
p = .055; BMI - body mass index, HDL - high density lipoprotein.
Step 1, which included the demographic variables, did not reach significance for any of the RT measures, ΔR2’s ≤ 0.059, F’s(4, 134) ≤ 2.09, p’s ≥ .085. In Step 2, fitness accounted for a significant and unique proportion of the variance, ΔR2’s ≥ 0.038, F’s(1, 133) ≥ 5.67, p’s ≤ .02, across each RT measure, β’s ≥ −.23, p’s ≤ .022. Step 3 was also significant for compatible flanker RT after controlling for fitness, ΔR2’s ≥ 0.058, F’s(2, 131) ≥ 4.50, p’s ≤ .013, yet it appeared that this effect was primarily driven by the inclusion of HDL, β’s ≥ −.21, p’s ≤ .023, as opposed to TG, β’s ≤ .15, p’s ≥ .106. As for incompatible RT, similar effects were observed with Step 3 explaining a unique proportion of variance for incongruent trials, ΔR2 = 0.044, F(2, 131) = 3.36, p = .038, and an effect for HDL approached significance, β = −.18, p = .055. Alternatively, Step 3 did not reach significance for congruent trials, ΔR2 = 0.035, F(2, 131) = 2.68, p = .072. As such, both higher fit children and individuals with higher HDL had shorter RT for incongruent trial performance in particular. The partial regression plots are displayed in Figure 1.
Figure 1.

Partial regression plots (n = 139) depicting the relation between fitness and A) compatible, and B) incompatible flanker RT. Plots C) and D) display this same association between HDL levels and flanker RT. Partial correlation (pr) values are provided. **p < .01, *p < .05, ap = .055.
Group Comparison
In addition to the demographic variables controlled for in Step 1 of the regression analyses, aerobic fitness was also entered as a covariate into each MANOVA when comparing flanker performance between children with and without risk factors for MetS.
RT
A main effect for Risk Factor, F(1, 132) = 5.87, p = .017, η2 = .04, was observed, indicating that children with no risk factors (M = 514.5, SE = 13.6ms) displayed shorter RT compared to those with one or more risk factors (M = 562.5, SE = 13.7ms; see Figure 2A), d = 0.5. No other effects involving Compatibility or Congruency were observed, F’s(1, 132) ≤ 0.90, p’s ≥ .345, η2’s ≤ .01.
Figure 2.
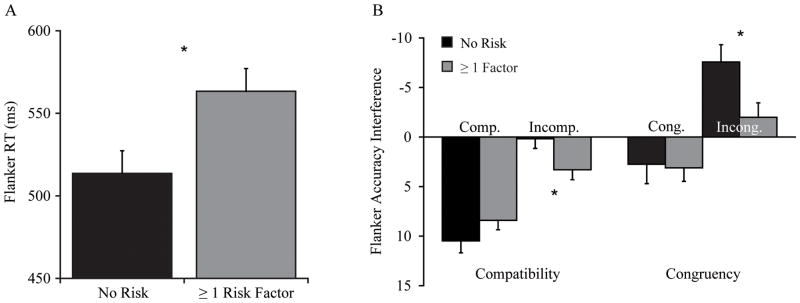
A) Children with no risk factors for MetS (n = 70) exhibited overall shorter flanker RT compared to individuals with one or more risk factors (n = 69). B) Flanker accuracy interference scores in each of the compatibility conditions (congruent minus incongruent scores) are displayed on the left, and indicate that children at risk exhibited greater interference during the incompatible manipulation. On the right, children at risk also demonstrated greater interference for incongruent trials across response compatibilities (compatible minus incompatible scores) compared to children with no risk factors. Performance bars extending below the horizontal axis indicate greater interference as flanker difficulty increased, and error bars represent standard error. *p < .05.
Accuracy
For flanker accuracy, an interaction of Risk Factor × Compatibility × Congruency, F(1, 132) = 10.73, p = .001, η2 = .08, was observed. Given that accuracy did not differ by group on any of the flanker trial types, t’s(137) ≤ 1.20, p’s ≥ .232, d’s ≤ 0.2, separate 2 (Compatibility) × 2 (Congruency) MANOVAs were conducted within each group. A main effect of Congruency, F’s ≥ 38.62, p’s < .001, η2’s ≥ .36, was uncovered in both groups, which was superseded by a Compatibility × Congruency interaction, F’s ≥ 16.99, p’s < .001, η2’s ≥ .20. First, analyzing compatible accuracy revealed that both groups exhibited poorer performance for incongruent trials (No Risk: M = 65.1%, SE = 1.8; ≥ 1 Risk Factor: M = 67.9%, SE = 1.6) compared to congruent trials (No Risk: M = 75.5%, SE = 1.7; ≥ 1 Risk Factor: M = 76.4%, SE = 1.6), t’s ≥8.74, p’s < .001, d’s ≥ 0.7. However, this same pattern (incongruent < congruent accuracy) was only observed for the incompatible manipulation in the group with ≥ 1 risk factor (Incongruent: M = 69.9%, SE = 2.0; Congruent: M = 73.3%, SE = 1.8), t(68) = 3.27, p = .002, d = 0.2, compared to children with no risk factors (Incongruent: M = 72.6%, SE = 1.9; Congruent: M = 72.8%, SE = 2.0), who maintained equal performance on both trial types, t(69) = 0.17, p = .862, d < 0.1. As for analyzing each trial type (i.e., congruent, incongruent) across compatibility condition, children with ≥ 1 risk factor demonstrated decreased congruent trial accuracy as difficulty increased during the incompatible manipulation, t(68) = 2.24, p = .025, d = 0.2. Their incongruent trial accuracy increased slightly, yet this difference was not significant, t(68) = 1.36, p = .178, d = 0.1. On the other hand, children without risk factors exhibited no significant decrease in congruent trial accuracy, t(69) = 1.40, p = .165, d = 0.2, and the same trend of increased incongruent trial accuracy was significant in this group of children, t(69) = 4.28, p < .001, d = 0.5.
Accuracy Interference
To more accurately portray these group differences, independent samples t-tests were conducted on interference scores that were calculated within each compatibility condition (congruent - incongruent accuracy), as well as across compatibilities for each trial type (compatible - incompatible accuracy). As depicted in Figure 2B, both groups exhibited large congruency interference scores during the compatible condition, t(137) = 1.40, p = .178, d = 0.2. In the incompatible condition, children with ≥ 1 risk factor exhibited significantly greater congruency interference compared to children with no risk, t(137) = 2.22, p = .025, d = 0.4. Lastly, groups had comparable interference scores for congruent trials across compatibilities, t(137) = 0.15, p = .882, d < 0.1; however, at risk children demonstrated greater interference for incongruent trials, t(137) = 2.42, p = .017, d = 0.4, compared to children with no risk factors.
Discussion
These data reveal that children meeting no risk criteria for MetS exhibit superior performance on a widely implemented task of inhibitory control, and importantly, this relationship remained even after controlling for aerobic fitness level. As hypothesized, children without risk factors for MetS demonstrated greater inhibitory control and cognitive flexibility, as denoted by overall shorter flanker RT and less interference during the most difficult portions of the task. This pattern of results closely matches previous investigations of children’s aerobic fitness (Chaddock et al., 2010b; Pontifex et al., 2011; Voss et al., 2011), which also had a significant and independent influence on flanker RT in the current study. These findings extend prior literature by revealing that individual aspects of children’s cardiovascular health have distinct influences on aspects of cognitive control, which may have considerable implications for children’s health promotion, learning, and scholastic achievement.
Although the evidence is limited, the findings are consistent with previous studies that have highlighted the importance of assessing MetS risk factors when studying cognitive function and brain health in children. Among the biomedical measures, HDL and TG were initially correlated with flanker RT; however, regression analyses demonstrated that only HDL was independently associated with RT. These findings are in contrast to those observed by Perry et al. (2009) who uncovered no links between children’s (6–16 years) cholesterol levels and cognitive or academic performance using data from the NHANES III. However, to our knowledge, the current study and Perry et al. (2009) are the only two studies that have assessed the relationship between cholesterol and cognitive function in preadolescent children. In addition, the studies differ in their assessment of cognitive function since the present study focused on inhibitory control and cognitive flexibility, whereas Perry et al. (2009) examined academic achievement and aspects of memory. Another possible explanation for the discordance observed may be due to the fasting compliance prior to blood sample collection in Perry et al. (2009), which was only required of the children over the age of 12 years. Thus, one of the strengths of the study presented herein is the reliance on fasting blood measures of MetS. However, despite the significant association between HDL and RT in the current study (and the overall group differences), it is unclear how meaningful the RT findings are given that Perry et al. (2009) failed to find any association between HDL and cognitive/academic performance. Future research will need to pursue this question to determine the meaningfulness of this pattern of results. All told, the influence of children’s cholesterol levels on cognitive performance appears to be one area of research with considerable promise that warrants future inquiry.
Another important finding of this study was the observed differences in flanker performance as a function of MetS risk factor presence. Children with no risk factors exhibited overall shorter RT, and less accuracy interference when flanker task demands were elevated. These patterns of greater cognitive flexibility when faced with greater cognitive demands are comparable to those previously witnessed in studies of children’s aerobic fitness. Neuroimaging findings from these studies have revealed that behavioral performance differences observed between higher and lower fit children may relate to differential patterns of brain activation (Pontifex et al., 2011; Voss et al., 2011), as well as the underlying integrity of specific brain regions, including the basal ganglia (Chaddock et al., 2010b). However, it remains unknown whether aerobic fitness and HDL share similar mechanisms that may influence cognitive control in childhood. Nevertheless, the current findings point to the possible future utility of both aerobic fitness and HDL levels in predicting cognitive control strategies in prepubertal children.
One particular aspect of research deserving much attention is determining the mechanisms that might be responsible for eliciting these cognitive differences in children with MetS. Cholesterol plays a critical role in the central nervous system by possibly activating signaling pathways that trigger synaptogenesis, and may be necessary for supporting the structural demands of this process (Barres & Smith, 2001; Göritz, Mauch, Nägler, & Pfrieger, 2002). Although the evidence is limited among children, studies in older adults have linked low HDL to smaller hippocampal volume (Wolf et al., 2004), low gray matter volume (Ward et al., 2010), and cognitive impairment (van Exel et al., 2002). Alternatively, the relationship between HDL and cognitive function observed in this study may be a result of unmeasured variability in inflammatory markers such as C-reactive protein (CRP) and interleukin-6, which have been widely observed in children with MetS (de Ferranti et al., 2006; Ford, Ajani, & Mokdad, 2005; Weiss et al., 2004) and could have deleterious effects on cognition. Among adults, Gunstad et al. (2006) reported that CRP had an independent and negative relationship with cognitive control, whereas Yaffe et al. (2004) used a prospective design to show that older individuals with MetS exhibited greater cognitive decline over a 4-year period, but only for participants with high levels of these inflammatory markers. Therefore, future investigations of MetS and cognition in children should incorporate measures to assess these inflammatory markers and attempt to determine their influence.
There are undoubtedly other explanations that may be considered when discussing the present results. There have been several attempts to isolate the potential genetic underpinnings of MetS, which are believed to exist due to evidence demonstrating that insulin resistance and other risk factors tend to cluster in families (Groop, 2000). Although there has been some discussion of a common underlying genetic factor rooted around central adiposity, much of the data would suggest that it is an interaction between various genes that accounts for what is collectively referred to as MetS (Joy, Lahiry, Pollex, & Hegele, 2008). As such, there may be reason to suspect that variations in these genes could also influence aspects of cognition or level of aerobic fitness. In any case, many researchers have acknowledged the key role that environmental factors play in developing MetS. As Roche et al. (2005) note, the human genome has changed very little within the last 10 years, yet the prevalence of MetS and specific risk factors have increased exponentially. Accordingly, it is highly plausible that modifying any one of these variables, especially during a time when humans are undergoing development, may result in widespread changes that are observable throughout the body and brain.
The current study has several limitations. Given the cross-sectional design, these findings do not warrant causal inference of MetS risk or aerobic fitness on children’s cognitive control. Therefore, prospective studies are needed to monitor and assess longitudinal changes in MetS risk factors and cognitive performance. The adopted definition of MetS (de Ferranti et al., 2004) also partially restricts comparisons with other studies. However, this has been a common limitation throughout the pediatric literature as there is no consensus definition of MetS in childhood (Zimmet et al., 2007). Many definitions have, however, revealed that the risk of MetS varies with regard to a child’s race/ethnicity (e.g., de Ferranti et al., 2004), which indicates that it would be advantageous for future studies to include large, racially diverse samples. Thus, the group of predominately Caucasian children used in this investigation3 may limit the generalizability of the current findings to others. The aforementioned limitations notwithstanding, the major strengths of this study included evaluation of MetS risk using biomedical measures, aerobic fitness using a reliable field estimate, and utilization of a popular cognitive task known to tap specific aspects of cognitive control.
Knowing that the presence of MetS risk factors during childhood predicts the onset of adult MetS (Morrison, Friedman, Wang, & Glueck, 2007), the current findings stress the importance of preventing this risk in young children to promote better brain heath and cognitive function starting early in life. The present results also add to the growing literature by suggesting that lower levels of HDL in childhood may detrimentally influence cognitive control. Considering both HDL and aerobic fitness (variables shown here to be independently associated with inhibitory control) are susceptible to modulation by regular physical activity (Kamijo et al., 2011; Strong et al., 2005), the present findings are consistent with previous work highlighting the need to maintain an active lifestyle to achieve optimal cognitive function beginning in childhood (Institutes of Medicine of the National Academies, 2013). For this area of research to continue progressing, one of the most important accomplishments will be establishing a common pediatric definition of MetS, similar to the ATPIII for adults. In addition to a common definition, future research will benefit from the inclusion of measures of inflammatory markers while continuing to monitor levels of aerobic fitness and weight status. By delineating which of these health related variables are most influential for children’s cognitive health, school administrators and other professionals will gain considerable insight for developing future comprehensive health recommendations intended to foster improved academic/cognitive performance and overall well-being in children.
Acknowledgments
The authors would like to thank Katherine Henley and Jeffery J. Honas for lending their knowledge and support towards the preparation and planning of the study.
Support for our research and the preparation of this manuscript were provided by a grant from the National Institutes of Health (NIH DK085317) to Joseph Donnelly.
Footnotes
Excluding children below chance performance is common practice across a number of cognitive tasks (see Richardson, Anderson, Reid, & Fox, 2011; Stins, Polderman, Boomsma, & de Geus, 2007 for similar instances using flanker tasks). Such criteria ensures that the participant is, at the very least, paying attention and engaged in the task, understands the rules of the task, and that “chance” (i.e., guessing) is unrelated to the study findings. Statistical analysis indicated that the 40 excluded participants did not differ on any demographic or MetS variables compared to those included in the final analyses.
The majority of children were right hand (n = 129) compared to left hand (n = 10) dominant. When handedness was included as a between-subjects factor in the MANOVAs, no significant interactions involving handedness were observed (p’s ≥ .14).
Caucasian children accounted for 79.1 % of participants, while the remaining distribution was divided among: African American (3.6 %), Asian (0.7 %), American Indian/Alaska Native (1.4 %), two or more races (13.7 %), and those who withheld their information (n = 2).
Author Disclosure Statement
No conflicting financial, consultant, institutional, or other interests exist.
References
- Agatston AS, Barkin S, Berenson GS, Daniels SR, Diaz-Balart T, Gillman MW, Weitzman ML. Why should we write a book on pediatric metabolic syndrome? Commentaries from worldwide experts. In: Lipshultz SE, Messiah SE, Miller TL, editors. Pediatric Metabolic Syndrome. London: Springer-Verlag; 2012. [Google Scholar]
- Barres BA, Smith SJ. Cholesterol--Making or Breaking the Synapse. Science. 2001;294:1296–1297. doi: 10.1126/science.1066724. [DOI] [PubMed] [Google Scholar]
- Bierman KL, Nix RL, Greenberg MT, Blair C, Domitrovich CE. Executive functions and school readiness intervention: Impact, moderation, and mediation in the Head Start REDI program. Development and Psychopathology. 2008;20:821–843. doi: 10.1017/S0954579408000394. [DOI] [PMC free article] [PubMed] [Google Scholar]
- Carrel AL, Bowser J, White D, Moberg DP, Weaver B, Hisgen J, Allen DB. Standardized Childhood Fitness Percentiles Derived from School-Based Testing. The Journal of Pediatrics. 2012;161(1):120–124. doi: 10.1016/j.jpeds.2012.01.036. [DOI] [PMC free article] [PubMed] [Google Scholar]
- Chaddock L, Erickson KI, Prakash RS, Kim JS, Voss MW, VanPatter M, Kramer AF. A neuroimaging investigation of the association between aerobic fitness, hippocampal volume and memory performance in preadolescent children. Brain Research. 2010a;1358:172–183. doi: 10.1016/j.brainres.2010.08.049. [DOI] [PMC free article] [PubMed] [Google Scholar]
- Chaddock L, Erickson KI, Prakash RS, VanPatter M, Voss MW, Pontifex MB, Kramer AF. Basal ganglia volume is associated with aerobic fitness in preadolescent children. Developmental Neuroscience. 2010b;32:249–256. doi: 10.1159/000316648. [DOI] [PMC free article] [PubMed] [Google Scholar]
- Davis CL, Cooper S. Fitness, fatness, cognition, behavior, and academic achievement among overweight children: Do cross-sectional associations correspond to exercise trial outcomes? Preventive Medicine. 2011;52:S65–S69. doi: 10.1016/j.ypmed.2011.01.020. [DOI] [PMC free article] [PubMed] [Google Scholar]
- de Ferranti SD, Gauvreau K, Ludwig DS, Neufeld EJ, Newburger JW, Rifai N. Prevalence of the metabolic syndrome in American adolescents: Findings from the third national health and nutrition examination survey. Circulation. 2004;110:2494–2497. doi: 10.1161/01.CIR.0000145117.40114.C7. [DOI] [PubMed] [Google Scholar]
- de Ferranti SD, Gauvreau K, Ludwig DS, Newburger JW, Rifai N. Inflammation and changes in metabolic syndrome abnormalities in U.S. adolescents: Findings from the 1988–1994 and 1999–2000 National Health and Nutrition Examination Surveys. Clinical Chemistry. 2006;52:1325–1330. doi: 10.1373/clinchem.2006.067181. [DOI] [PubMed] [Google Scholar]
- Diamond A. Executive functions. Annual review of psychology. 2013;64:135–168. doi: 10.1146/annurev-psych-113011-143750. [DOI] [PMC free article] [PubMed] [Google Scholar]
- Diamond A, Barnett WS, Thomas J, Munro S. Preschool program improves cognitive control. Science. 2007;318:1387–1388. doi: 10.1126/science.1151148. [DOI] [PMC free article] [PubMed] [Google Scholar]
- Donnelly JE, Greene JL, Gibson CA, Sullivan DK, Hansen DM, Hillman CH, Washburn RA. Physical activity and academic achievement across the curriculum (A + PAAC): rationale and design of a 3-year, cluster-randomized trial. BMC Public Health. 2013;13:307–321. doi: 10.1186/1471-2458-13-307. [DOI] [PMC free article] [PubMed] [Google Scholar]
- Duncan GE, Li SM, Zhou XH. Prevalence and trends of a metabolic syndrome phenotype among U.S. adolescents, 1999–2000. Diabetes Care. 2004;27:2438–2443. doi: 10.2337/diacare.27.10.2438. [DOI] [PubMed] [Google Scholar]
- Eriksen CW, Eriksen BA. Effects of noise letters upon the identification of a target letter in a non-search task. Perception and Psychophysics. 1974;25:249–263. doi: 10.3758/BF03203267. [DOI] [Google Scholar]
- Falkner B, Daniels SR. Summary of the fourth report on the diagnosis, evaluation, and treatment of high blood pressure in children and adolescents. Hypertension. 2004;44:387–388. doi: 10.1161/01.HYP.0000143545.54637.af. [DOI] [PubMed] [Google Scholar]
- Ford ES, Ajani UA, Mokdad AH. The metabolic syndrome and concentrations of C-reactive protein among U.S. youth. Diabetes Care. 2005;28:878–881. doi: 10.2337/diacare.28.4.878. [DOI] [PubMed] [Google Scholar]
- Fryar CD, Gu Q, Ogden CL. Anthropometric reference data for children and adults: United States, 2007–2010. National Center for Health Statistics. 2012;11:1–40. [PubMed] [Google Scholar]
- Göritz C, Mauch DH, Nägler K, Pfrieger FW. Role of glia-derived cholesterol in synaptogenesis: new revelations in the synapse–glia affair. Journal of Physiology-Paris. 2002;96:257–263. doi: 10.1016/S0928-4257(02)00014-1. [DOI] [PubMed] [Google Scholar]
- Gunstad J, Bausserman L, Paul RH, Tate DF, Hoth K, Poppas A, Cohen RA. C-reactive protein, but not homocysteine, is related to cognitive dysfunction in older adults with cardiovascular disease. Journal of Clinical Neuroscience. 2006;13:540–546. doi: 10.1016/j.jocn.2005.08.010. [DOI] [PMC free article] [PubMed] [Google Scholar]
- Hillman CH, Buck SM, Themanson JR, Pontifex MB, Castelli D. Aerobic fitness and cognitive development: Event-related brain potential and task performance indices of executive control in preadolescent children. Developmental Psychology. 2009;45:114–129. doi: 10.1037/a0014437. [DOI] [PubMed] [Google Scholar]
- Hillman CH, Castelli DM, Buck SM. Aerobic fitness and neurocognitive function in healthy preadolescent children. Medicine & Science in Sport & Exercise. 2005;37:1967–1974. doi: 10.1249/01.mss.0000176680.79702.ce. [DOI] [PubMed] [Google Scholar]
- Kohl HW III, Cook HD, editors. Institute of Medicine of the National Academies. Educating the student body: Taking physical activity and physical education to school. Washington DC: The National Academies Press; 2013. [PubMed] [Google Scholar]
- Kamijo K, Khan NA, Pontifex MB, Scudder MR, Drollette ES, Raine LB, Hillman CH. The relation of adiposity to cognitive control and scholastic achievement in preadolescent children. Obesity. 2012;20:2406–2411. doi: 10.1038/oby.2012.112. [DOI] [PMC free article] [PubMed] [Google Scholar]
- Kamijo K, Pontifex MB, O’Leary KC, Scudder MR, Wu CT, Castelli DM, Hillman CH. The effects of an afterschool physical activity program on working memory in preadolescent children. Developmental Science. 2011;14:1046–1058. doi: 10.1111/j.1467-7687.2011.01054.x. [DOI] [PMC free article] [PubMed] [Google Scholar]
- Léger LA, Lambert J. A maximal multistage 20-m shuttle run test to predict O 2 max. European Journal of Applied Physiology and Occupational Physiology. 1982;49:1–12. doi: 10.1007/BF00428958. [DOI] [PubMed] [Google Scholar]
- Léger LA, Mercier D, Gadoury C, Lambert J. The multistage 20 metre shuttle run test for aerobic fitness. Journal of Sports Sciences. 1988;6:93–101. doi: 10.1080/02640418808729800. [DOI] [PubMed] [Google Scholar]
- Li Y, Dai Q, Jackson JC, Zhang J. Overweight is associated with decreased cognitive functioning among school-age children and adolescents. Obesity. 2008;16:1809–1815. doi: 10.1038/oby.2008.296. [DOI] [PubMed] [Google Scholar]
- Mahar MT, Guerieri AM, Hanna MS, Kemble CD. Estimation of aerobic fitness from 20-m multistage shuttle run test performance. American Journal of Preventive Medicine. 2011;41:S117–S123. doi: 10.1016/j.amepre.2011.07.008. [DOI] [PubMed] [Google Scholar]
- Mezzacappa E. Alerting, orienting, and executive attention: Developmental properties and sociodemographic correlates in an epidemiological sample of young, urban children. Child Development. 2004;75:1373–1386. doi: 10.1111/j.1467-8624.2004.00746.x. [DOI] [PubMed] [Google Scholar]
- Morrison JA, Friedman LA, Wang P, Glueck CJ. Metabolic syndrome in childhood predicts adult metabolic syndrome and type 2 diabetes mellitus 25 to 30 years later. The Journal of Pediatrics. 2008;152:201–206. doi: 10.1016/j.jpeds.2007.09.010. [DOI] [PubMed] [Google Scholar]
- Okosun IS, Boltri JM, Lyn R, Davis-Smith M. Continuous metabolic syndrome risk score, body mass index percentile, and leisure time physical activity in American children. The Journal of Clinical Hypertension. 2010;12:636–644. doi: 10.1111/j.1751-7176.2010.00338.x. [DOI] [PMC free article] [PubMed] [Google Scholar]
- Perry LA, Stigger CB, Ainsworth BE, Zhang J. No association between cognitive achievements, academic performance and serum cholesterol concentrations among school-aged children. Nutritional Neuroscience. 2009;12:160–166. doi: 10.1179/147683009X423328. [DOI] [PubMed] [Google Scholar]
- Polich J. Updating P300: An integrative theory of P3a and P3b. Clinical Neurophysiology. 2007;118:2128–2148. doi: 10.1016/j.clinph.2007.04.019. [DOI] [PMC free article] [PubMed] [Google Scholar]
- Polich J, Kok A. Cognitive and biological determinants of P300: An integrative review. Biological Psychology. 1995;41:103–146. doi: 10.1016/0301-0511(95)05130-9. [DOI] [PubMed] [Google Scholar]
- Pontifex MB, Raine LB, Johnson CR, Chaddock L, Voss MW, Cohen NJ, Hillman CH. Cardiorespiratory fitness and the flexible modulation of cognitive control in preadolescent children. Journal of Cognitive Neuroscience. 2011;23:1332–1345. doi: 10.1162/jocn.2010.21528. [DOI] [PubMed] [Google Scholar]
- Richardson C, Anderson M, Reid CL, Fox AM. Neural indicators of error processing and intraindividual variability in reaction time in 7 and 9 year-olds. Developmental Psychobiology. 2011;53:256–265. doi: 10.1002/dev.20518. [DOI] [PubMed] [Google Scholar]
- Saland JM. Update on the metabolic syndrome in children. Current Opinion in Pediatrics. 2007;19:183–191. doi: 10.1097/MOP.0b013e3280208519. [DOI] [PubMed] [Google Scholar]
- Stins JF, Polderman T, Boomsma DI, de Geus EJC. Conditional accuracy in response interference tasks: Evidence from the Eriksen flanker task and the spatial conflict task. Advances in Cognitive Psychology. 2007;3:389–396. doi: 10.2478/v10053-008-0005-4. [DOI] [PMC free article] [PubMed] [Google Scholar]
- Strong WB, Malina RM, Blimkie CJR, Daniels SR, Dishman RK, Gutin B, Trudeau F. Evidence based physical activity for school-age youth. The Journal of Pediatrics. 2005;146:732–737. doi: 10.1016/j.jpeds.2005.01.055. [DOI] [PubMed] [Google Scholar]
- Tascilar ME, Turkkahraman D, Oz O, Yucel M, Eker I, Abaci A, Ulas UH. P300 auditory event-related potentials in children with obesity: Is childhood obesity related to impairment in cognitive functions? Pediatric Diabetes. 2011;12:589–595. doi: 10.1111/j.1399-5448.2010.00748.x. [DOI] [PubMed] [Google Scholar]
- Taylor VH, MacQueen GM. Cognitive dysfunction associated with metabolic syndrome. Obesity Reviews. 2007;8:409–418. doi: 10.1111/j.1467-789X.2007.00401.x. [DOI] [PubMed] [Google Scholar]
- Van Exel E, de Craen AJM, Gussekloo J, Houx P, Bootsma-van der Wiel A, Macfarlane PW, Westendorp RGJ. Association between high-density lipoprotein and cognitive impairment in the oldest old. Annals of Neurology. 2002;51:716–721. doi: 10.1002/ana.10220. [DOI] [PubMed] [Google Scholar]
- Varness T, Carrel AL, Eickhoff JC, Allen DB. Reliable prediction of insulin resistance by a school-based fitness test in middle-school children. International Journal of Pediatric Endocrinology. 2009;487804 doi: 10.1155/2009/487804. [DOI] [PMC free article] [PubMed] [Google Scholar]
- Voss MS, Chaddock L, Kim JS, VanPatter M, Pontifex MB, Raine LB, Kramer AF. Aerobic fitness is associated with greater efficiency of the network underlying cognitive control in preadolescent children. Neuroscience. 2011;199:166–176. doi: 10.1016/j.neuroscience.2011.10.009. [DOI] [PMC free article] [PubMed] [Google Scholar]
- Ward MA, Bendlin BB, McLaren DG, Hess TM, Gallagher CL, Kastman EK, Sager MA. Low HDL cholesterol is associated with lower gray matter volume in cognitively healthy adults. Frontiers in aging neuroscience. 2010;2 doi: 10.3389/fnagi.2010.00029. [DOI] [PMC free article] [PubMed] [Google Scholar]
- Weiss R, Dziura J, Burgert TS, Tamborlane WV, Taksali SE, Yeckel CW, Caprio S. Obesity and the metabolic syndrome in children and adolescents. The New England Journal of Medicine. 2004;350:2362–2374. doi: 10.1056/NEJMoa031049. [DOI] [PubMed] [Google Scholar]
- Welk GJ, Meredith MD. Fitnessgram/Activitygram Reference Guide. Dallas TX: The Cooper Institute; 2008. [Google Scholar]
- Wolf H, Hensel A, Arendt T, Kivipelto M, Winblad B, Gertz HJ. Serum lipids and hippocampal volume: The link to Alzheimer’s disease? Annals of Neurology. 2004;56:745–749. doi: 10.1002/ana.20289. [DOI] [PubMed] [Google Scholar]
- Yaffe K, Kanaya A, Lindquist K, Simonsick EM, Harris T, Shorr RI, Newman AB. The metabolic syndrome, inflammation, and risk of cognitive decline. JAMA. 2004;292:2237–2242. doi: 10.1001/jama.292.18.2237. [DOI] [PubMed] [Google Scholar]
- Yau PL, Castro MG, Tagani A, Tsui WH, Convit A. Obesity and metabolic syndrome and functional and structural brain impairments in adolescence. Pediatrics. 2012;130:e856–e864. doi: 10.1542/peds.2012-0324. [DOI] [PMC free article] [PubMed] [Google Scholar]