

Abstract
The prevalence of human immunodeficiency virus 1 (HIV) associated neurocognitive disorders resulting from infection of the central nervous system (CNS) by HIV continues to increase despite the success of combination antiretroviral therapy. Although monocytes are known to transport HIV across the blood–brain barrier (BBB) into the CNS, there are few specific markers that identify monocyte subpopulations susceptible to HIV infection and/or capable of infiltrating the CNS. We cultured human peripheral blood monocytes and characterized the expression of the phenotypic markers CD14, CD16, CD11b, Mac387, CD163, CD44v6 and CD166 during monocyte/macrophage (Mo/Mac) maturation/differentiation. We determined that a CD14+CD16+CD11b+Mac387+ Mo/Mac subpopulation preferentially transmigrates across our in vitro BBB model in response to CCL2. Genes associated with Mo/Mac subpopulations that transmigrate across the BBB and/or are infected by HIV were identified by cDNA microarray analyses. Our findings contribute to the understanding of monocyte maturation, infection and transmigration into the brain during the pathogenesis of NeuroAIDS.
Keywords: NeuroAIDS, Monocytes/macrophages, Transmigration, Maturation/differentiation, Blood, brain barrier, CCL2, CD14, CD16
1. Introduction
The entry of human immunodeficiency virus 1 (HIV) into the central nervous system (CNS) leads to neurological impairment, designated HIV associated neurocognitive disorders (HAND), in approximately 60% of HIV infected individuals [1]. In vitro studies and postmortem analyses of HIV infected CNS tissue suggest HAND is dependent, in part, upon transmigration of monocytes, both uninfected and HIV infected, across the blood–brain barrier (BBB) into the CNS parenchyma [2,3]. Subsequent HIV infection and/or activation of neuroinflammatory cells such as perivascular macrophages and microglia occurs, in addition to low level infection of astrocytes [4,5]. The elaboration of viral proteins, such as tat and gp120, in addition to increased cytokine/chemokine expression and adhesion molecule activation, have been implicated in the recruitment of additional monocytes into the CNS [6–8]. This chronic neuroinflammation leads to the production of neurotoxic factors that ultimately results in neuronal dysfunction and cell death [9,10].
Circulating monocytes had been considered restrictive to HIV infection [11–15]. However, infectious virus can be isolated from monocytes of HIV infected individuals, indicating that monocytes are not completely refractory to HIV infection [16,17]. Studies suggest a link between monocytes expressing specific phenotypic markers and CNS disease progression associated with simian immunodeficiency virus (SIV) and HIV infection [18–24], highlighting the importance of monocytes in the development of CNS inflammation and cognitive dysfunction in HIV infected individuals.
Monocytes in the peripheral blood are heterogeneous and subpopulations representing stages of maturation/differentiation and activation have been proposed [25,26], characterized by differential expression of cell surface antigens [27,28]. The relationship between the maturation state of monocytes and their ability to become infected by HIV, as well as to transmigrate across the BBB, has not been well characterized. We developed a culture system for human peripheral blood monocytes that enabled us to examine the maturation of this cell type in vitro by analyzing the expression of the phenotypic markers, CD14, CD16, CD11b, Mac387, CD163, CD44v6 and CD166. We correlated the expression of these markers with the ability of monocytes to transmigrate across our in vitro model of the human BBB in response to the chemokine CCL2 (MCP-1). The predominant monocyte phenotype that transmigrated was a CD14+CD16+CD11b+Mac387+ subpopulation. We performed cDNA microarray analyses to characterize further the transmigrated monocyte subpopulation and identified 471 differentially regulated genes. In addition, we identified genes associated with the onset of Mo/Mac differentiation, including neuronal gamma enolase and neuropilin, as well as genes whose products expressed by maturing monocytes may facilitate their infection with HIV.
2. Materials and methods
2.1. Cell isolation and culture
Blood was obtained from healthy volunteers or purchased as whole blood units or leukopaks from the New York Blood Center, in accordance with Albert Einstein College of Medicine (AECOM) guidelines. PBMC were isolated using Ficoll-Paque (Amersham Pharmacia Biotech, Uppsala, Sweden) density gradient centrifugation. Monocytes were isolated from PBMC by positive selection using the CD14 MidiMACS separation system (Miltenyi Biotec, Auburn, CA) or the CD14 EasySep selection kit (Stem Cell Technologies, Vancouver, BC, Canada) according to the manufacturer’s protocol. The purity of the isolated monocytes was assessed by flow cytometry using PE and APC coupled anti-CD14 (clone M5E2) (monocyte marker), anti-CD19-PE-Cy7 (clone SJ25C1) (B cell marker), anti-CD56-PE (clone B159) (NK cell marker) and anti-CD3-FITC (clone HIT3a) (T cell marker) antibodies (BD Biosciences, Franklin Lakes, NJ). For these analyses, 3–5 × 10⁵ cells were used for each immunofluorescent stain and we acquired 10,000 events and analyzed within the combined lymphocyte and monocyte gate, based on the forward scatter (FSC) and side scatter (SSC) parameters. The percentage of CD14+ cells in purified monocyte isolations from different donors is included in Table 1 Section 3. CD14+ purified populations were found to contain <3% CD3+ T cells, <1% CD56+ NK cells and <1% CD19+ B cells. CD14+ isolated cells were cultured at 2 × 10⁶ cells/ml in RPMI 1640 supplemented with 5% heat inactivated fetal bovine serum (FBS), 1% HEPES, 1% penicillin/streptomycin (Gibco-Invitrogen, Carlsbad, CA), 10% human serum (Lonza, Walkersville, MD), and 10 ng/mL of MCSF (Peprotech, Rocky Hill, NJ) in Fisherbrand (Pittsburgh, PA) polypropylene tubes or Teflon flasks (Nalgene, Rochester, NY) to prevent the monocytes from adhering and fully differentiating into macrophages. On Day 3 of culture, monocytes were removed and analyzed for maturation markers by FACS. Day 3 monocyte cultures contained <2% CD3+ T cells, <1% CD56+ NK cells and <1% CD19+ B cells. Viable cell recoveries were determined by trypan blue staining, cell count and FACS FSC and SSC analyses. For monocyte derived macrophage cultures, CD14+ isolated cells were cultured in media as described above, but allowed to adhere for 3 days in 100 mm tissue culture plates (BD Falcon, Franklin Lakes, NJ) to obtain Day 3 adherent macrophages, with culturing for an additional 3 days to obtain Day 6 adherent macrophages.
Table 1.
Time course of antigen expression of cultured monocytes.
|
Student’s t-test – two tailed
p < 0.05.
p < 0.002.
p < 0.0001.
2.2. Virus
CEM●SS cells were infected with HIVADA, an R5 molecular clone derived from blood (NIH AIDS and Reference Reagent Program). Cell-free supernatants were collected daily for 2–30 days from infected cultures and stored at −80 °C for use as viral stocks. Stock concentration of p24/ml was quantified by HIV p24 ELISA (Perkin Elmer Life Science, Inc, Boston, MA).
2.3. HIV infection of cells
CD14+ cells, either freshly isolated or after 3 days of non-adherent culture, were infected at 2 × 10⁶ cells/ml in 5 ml with 20 ng/mL of HIVADA and maintained in polypropylene tubes or Teflon flasks for 24 h. After that time, cells were pelleted, resuspended in media as described above at 2 × 10⁶ cells/ml and cultured for an additional 6 days. Uninfected control cells, either freshly isolated or after 3 days of non-adherent culture, were also maintained in polypropylene tubes or Teflon flasks in fresh media for an additional 6 days without virus. To measure HIV replication, supernatant levels of HIV-1 p24 were determined by ELISA.
2.4. Elisa’s
HIV p24 (Perkin Elmer) and soluble CD14 (sCD14) (R&D Systems, Minneapolis, MN) ELISA’s were performed according to the manufacturer’s protocols. The minimum detectable level of HIV p24 and sCD14 is 26 pg/ml and 125 pg/ml, respectively.
2.5. In Vitro BBB model
Astrocytes were isolated from human fetal cortical tissue obtained as part of an ongoing research protocol approved by AECOM. Human brain derived microvascular endothelial cells (BMVEC) were obtained from Applied Cell Biology Research Institute (Kirkland, WA). Astrocytes and BMVEC were isolated and cultured as described previously [29]. Our model consists of BMVEC and astrocytes cocultured on opposite sides of gelatin-coated tissue culture inserts with 3 μm pores (BD Falcon) that permit astrocyte processes to penetrate the insert and establish contact with BMVEC as previously described [30–33]. Cocultures in 24 well plates (BD Falcon) were used for transmigration experiments 6 days after they were established.
2.6. Flow cytometry
Monocytes were phenotyped upon isolation and after 3 days of non-adherent culture using FITC and PE coupled monoclonal antibodies specific for human CD14 (clone M5E2), CD16 (clone 3G8), CD11b/Mac-1 (clone ICRF44), CD166 (clone 3A6), CD163 (clone GHI/61), CD44v6, Mac387 or corresponding mouse isotype matched negative controls (all from BD Biosciences, except Mac387, Abcam, Cambridge MA and CD44v6, Invitrogen). All antibodies were titrated to determine optimal concentrations. Cells (3–5 × 10⁵) were double stained with CD14 antibody and an antibody to each of the antigens stated above for 30 min at 4 °C, then washed with 1% bovine serum albumin (BSA) in phosphate buffered saline (PBS) and fixed with 2% paraformaldehyde. For Mac387 and CD14 intracellular staining, cells were permeabilized by incubation in 0.5% saponin in 1% BSA/PBS. Monocytes were also analyzed for cell surface CCR2, the CCL2 (MCP-1) receptor, using anti-CCR2-PE antibody (clone 48607) (R&D Systems). For analyses of immunopositive cells, 10,000 events were acquired on a BD FAC-Scan and analyzed using CellQuest (Becton Dickinson) or FlowJo (Ashland, OR) software. For transmigration studies, multi-color flow cytometry using anti-CD14-APC (clone M5E2), anti-CD16-PE-Cy7 (clone 3G8) (BD Biosciences), anti-CD163-PE, anti-Mac387-FITC and anti-CD11b-PE antibodies was performed as described below. For analyses of immunopositive cells, 10,000 events were acquired on a BD Canto II flow cytometer and analyzed using FlowJo software.
2.7. Assay of transmigration across our in vitro BBB model
CD14+ isolated cells cultured for 3 days non-adherently in Teflon flasks were designated as the start population and analyzed by multi-color flow cytometry for CD14, CD16, CD163, CD11b and Mac387. Cells from the start population were added at 5 × 10⁵ to each tissue culture insert to assay for transmigration across our in vitro BBB model. The chemokine CCL2 (100 ng/ml) (R&D Systems) was added to the bottom chamber of each coculture. After 24 h, cells that had transmigrated into the bottom chamber were analyzed by multi-color flow cytometry for CD14, CD16, CD163, CD11b and Mac387. Transmigrated cells from 3 to 4 cocultures were pooled for each immunofluorescent stain analyzed by FACS, which included single color staining for each marker and isotype matched negative control antibody, and four color staining for CD14, CD16, Mac387 and CD163 or CD11b. Five independent transmigration experiments were performed using CD14+ monocytes (Group 1 monocytes as detailed in Section 3) from five different donors.
2.8. cDNA microarray analysis
Total RNA was extracted from (1) freshly isolated CD14+ cells, (2) CD14+ isolated cells cultured for 3 days non-adherently or adherently, and (3) CD14+ isolated cells cultured for 3 days non-adherently (start population) and added to our in vitro BBB model, in addition to the cells that transmigrated in response to CCL2 after 24 h, using Qiagen RNeasy Mini Kit (Valencia, CA). Five micro grams of total RNA were used to amplify antisense RNA (aRNA) copies of each mRNA in the sample using the Ambion MessageAmp aRNA Amplification Kit (Austin, TX). Human cDNA arrays (27,323 cDNA clones) were obtained from the AECOM cDNA Microarray Facility. Microarray procedures were performed according to protocols provided by the facility. By reverse transcription, aRNA samples from Day 3 non-adherent monocytes were labeled with Cy5-dUTP and samples from freshly isolated CD14+ monocytes or Day 3 adherent monocytes were labeled with Cy3-dUTP (Perkin Elmer). For microarray analyses of the subpopulation of monocytes that transmigrated across the BBB in response to CCL2, RNA samples from transmigrated monocytes were labeled with Cy5-dUTP and samples from the start population of Day 3 non-adherent monocytes added to cocultures were labeled with Cy3-dUTP. Cy5-labeled samples were co-hybridized with Cy3-labeled samples. Hybridized slides were scanned using a GenePix 4000b scanner (Axon Instruments, Sunnyvale, CA), and raw data files were generated containing measurements of signal and background fluorescence emissions. Data were lowess normalized and filtered, such that cDNAs with 2-fold signal to noise ratio were analyzed. The ratio of Cy5 (experimental values) and Cy3 (control values) was calculated for each cDNA on the microarray to derive a relative expression value. Genes with differential expression in the experimental groups were compared by their Cy5/Cy3 ratio values. Two independent microarray analyses were performed using CD14+ monocytes (Group 1 monocytes as detailed in Section 3) from two different donors for each of the three groups analyzed: (1) Day 3 non-adherent monocytes and transmigrated monocytes, (2) freshly isolated CD14+ monocytes and Day 3 non-adherent monocytes, and (3) Day 3 non-adherent monocytes and Day 3 adherent monocytes.
2.9. Network generation and associated functional analysis
To determine markers of monocyte maturation/differentiation and characterize the phenotype of the monocyte subpopulation(s) transmigrating across the BBB, we analyzed the genes differentially regulated in the cDNA microarrays using Ingenuity Pathways (IPA) (Ingenuity® Systems, www.ingenuity.com). To generate networks, each gene identifier and corresponding expression values were uploaded into the application. Each identifier was mapped to its corresponding gene object in the Ingenuity Pathways Knowledge Base. These genes, called focus genes, were overlaid onto a global molecular network developed from information contained in the Ingenuity Pathways Knowledge Base. Networks of these focus genes were then algorithmically generated based on connectivity. The functional analysis of a network identifies the biological functions and/or diseases that are most significant to the genes in the network.
2.10. Western blot analysis
CD14+ isolated cells were cultured as described above. Freshly isolated, as well as non-adherent and adherent Day 3 and Day 6 cells were washed with cold PBS and lysed with RIPA buffer (Cell Signaling, Beverly, Ma) containing 50 μl/ml protease inhibitor cocktail for mammalian cell extracts (Sigma, St. Louis, MO). Protein concentrations of lysates were quantified using the Bio-Rad protein assay (Hercules, CA). Cell lysates were heated to 95–100 °C for 5 min and analyzed by SDS-PAGE with 40 μg of protein loaded onto each lane of 4–15% gradient polyacrylamide gels (Bio-Rad). Positive control lysates for each marker of interest were also included. Proteins were transferred electrophoretically to Protran nitrocellulose (Schleicher and Schuell, Dassel, Germany) and membranes were incubated with primary antibodies to neuropilin 1 (1:200), and neuronal gamma enolase (enolase 2, 1:400), (Santa Cruz Biotechnology, Santa Cruz, CA). After washing, membranes were incubated with either anti-rabbit-HRP or anti-mouse-HRP (Cell Signaling) (1:2000) and immunocomplexes were detected by Western Lightning Chemiluminesence Reagent (Perkin Elmer). Blots were stripped and probed with GAPDH antibody. Densitometric analyses were performed (UN-SCAN-IT gel digitizing software, Silk Scientific, Utah) and neuropilin 1 and enolase 2 protein levels were normalized to GAPDH. Western blot analyses were repeated with CD14+ cells from two different donors.
3. Results
3.1. Optimal culture conditions for human CD14+ monocytes isolated from PBMC
To determine the optimal culture conditions for CD14+ monocytes isolated from human PBMC, we tested various methods of culturing monocytes non-adherently. It was important to identify the appropriate non-adherent culture conditions so the monocytes did not fully mature into macrophages, which is facilitated by their adherence to the surface of tissue culture flasks or certain tubes. Many different adherent and non-adherent culture conditions have been used to study monocyte maturation/differentiation, including the use of culture medium containing FBS, human serum and/or MCSF [34,35]. Since human monocytes are a heterogeneous population of cells, the maturation/differentiation of monocyte subpopulations can vary dependent on the culture conditions. Thus, we identified a specific non-adherent culture condition which promoted cell viability and mirrors monocyte maturation in the peripheral blood circulation, as illustrated in the schematic representation shown in Fig. 1. Monocytes circulate and mature in the vasculature before they adhere to the endothelial cell lining of CNS blood vessels and become what we have termed a transitional cell. After transmigration across the BBB and adherence in the CNS tissue parenchyma, the transitional cell differentiates into a fully mature macrophage.
Fig. 1.
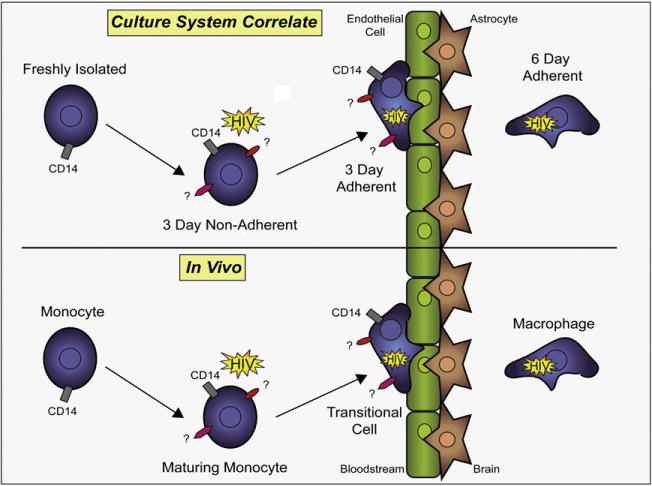
Schematic representation of monocyte maturation/differentiation into a macrophage in vivo and in vitro. Our culture system is represented in the top panel of the schematic. The in vivo system it was developed to mirror is represented in the bottom panel. Monocyte maturation/differentiation in the peripheral circulation in vivo is represented as a maturing monocyte, and in our culture system in vitro, this stage is represented by monocytes cultured non-adherently for 3 days. Upon adhesion to the BBB, monocyte maturation/differentiation in vivo is represented as an intermediate macrophage (MΦ) (transitional cell), and in our culture system in vitro, this stage is represented by monocytes cultured adherently for 3 days. In the CNS parenchyma, monocyte maturation/differentiation in vivo is represented as a macrophage (MΦ), and in our culture system in vitro, this stage is represented by monocytes cultured adherently for 6 days.
CD14+ monocytes were cultured non-adherently for 3 days, which is the time frame during which these cells mature and circulate in the vasculature before entering tissues and differentiating into macrophages [36,37]. Cell viability throughout the culture period was assessed by trypan blue exclusion and FACS forward scatter (FSC) and side scatter (SSC) analyses. The best method to culture monocytes was the addition of 2 × 10⁶ cells/ml to RPMI 1640 media supplemented with 1% HEPES, 1% penicillin/streptomycin, 5% FBS, 10% human serum and 10ng/ml MCSF (complete media) in polypropylene tubes or Teflon flasks to prevent cell adherence. Thus, CD14+ cells grown non-adherently for 3 days modeled maturing monocytes in the circulation. Alternatively, culturing CD14+ cells adherently in tissue culture plates for 3 or 6 days modeled the transitional and mature macrophage, respectively. Monocyte derived macrophages (MDM) have been obtained by our group and others by allowing freshly isolated monocytes to adhere to plastic tissue culture plates for 5–7 days with MCSF [38–40]. This protocol is the basis for the time course used for the adherent culture of monocytes in this study. After adherence to tissue culture plates for 3 days, monocytes have not fully differentiated into MDM and thus we termed these cells transitional macrophages. To obtain fully mature macrophages, monocytes were cultured adherently for 6 days.
Our non-adherent cell culture model system enabled the characterization of monocyte subpopulations that are present in the circulation at such low numbers that experimental analyses are difficult. The expansion of specific maturing monocyte subpopulations allowed for the characterization of phenotypic marker expression during monocyte maturation/differentiation as well as the identification of a monocyte subpopulation that transmigrates across the BBB in response to CCL2 (described below).
3.2. The phenotype of CD14+ monocytes changes as they mature in culture with MCSF
The expression of markers implicated in monocyte maturation/differentiation and transmigration was characterized by flow cytometry on freshly isolated monocytes (Day 0) and on monocytes cultured non-adherently for 3 days in media containing MCSF (Day 3) as described in the Materials and Methods. The specific markers analyzed were CD14, CD16, CD11b/Mac-1, Mac387, CD163, CD44v6 and CD166. All cells were double stained with CD14 antibody and an antibody to each of the antigens stated above. The results are summarized in Table 1. The markers analyzed have been associated with Mo/Mac subpopulations that transmigrate into tissues, including the CNS, and/or with HIV and SIV infection. CD14 is preferentially expressed by Mo/Mac and is the receptor for lipopolysaccharide (LPS)/LPS-binding protein (LBP) complexes. CD14 is expressed on the surface of 80–90% of peripheral blood monocytes and antibodies to this antigen are routinely used to isolate monocytes from PBMC [41]. CD16 is the IgG Fc receptor FcγRIII expressed on NK cells, Mo/Mac and granulocytes and expression of this antigen has been associated with monocyte infiltration of the CNS during HIV and SIV infection [42–46], as well as with HIV associated dementia (HAD) in infected individuals [47]. CD11b/Mac-1 is a member of the integrin family of adhesion molecules and is involved in the adhesion of leukocytes to blood vessel endothelium during transmigration into tissues [48]. Mac387 is an intracellular marker that identifies Mo/Mac during early stages of perivascular infiltration of blood vessels as well as at early time points after infiltration of tissue parenchyma [49–51]. CD163 is a member of the scavenger receptor cysteine-rich group B family of proteins expressed on Mo/Mac and is involved in monocyte adhesion to blood vessels [52,53]. CD163 is also expressed by perivascular macrophages and is a potential marker for AIDS progression [54]. CD44v6 is expressed by Mo/Mac and is a member of a family of transmembrane proteins that bind hyaluronan and are involved in cell adhesion and migration [55]. CD44v6 has been proposed to be a biomarker of HIV induced CNS disease [24]. CD166 is the transmembrane activated leukocyte cell adhesion molecule (ALCAM) expressed on activated T cells and monocytes [56,57]. ALCAM expression correlates with leukocyte trafficking into the CNS [58]. We analyzed the expression of these markers during the course of monocyte maturation/differentiation.
CD14+ monocytes isolated from PBMC from 13 donors were cultured non-adherently in complete media with MCSF for 3 days. The cultures were divided into two major groups on the basis of changes in cell surface CD14 expression (Table 1). In monocytes from nine donors, the percentage of cell surface CD14 positive cells decreased after 3 days in culture when compared to freshly isolated cells (designated Group 1), while the percentage of cell surface CD14 positive cells remained constant in monocytes isolated and cultured from the other four donors (designated Group 2). We therefore reported changes in the expression of phenotypic markers in cultured monocytes from Group 1 and Group 2. For this study, we did not distinguish between low and high cell surface CD14 and designated cells as CD14+ if the fluorescence intensity with CD14 antibody was greater than that of cells stained with an isotype matched, negative control antibody.
In Group 1, 91% ± 4 of freshly isolated monocytes on Day 0 were positive for cell surface CD14 (CD14+) and 9% ± 4 were negative for cell surface CD14 (CD14−) (Table 1, Group 1). Representative dot plots of FSC and SSC, as well as of CD14 and isotype matched negative control antibody immunofluorescence, for freshly isolated Day 0 monocytes are shown in Fig. 2. The percentage of CD14+ cells decreased significantly (***p < 0.0001) and the percentage of CD14− cells increased significantly (***p < 0.0001) after 3 days in culture. Of the CD14+ monocytes on Day 0, 19% ± 5 were also positive for cell surface CD16 (CD16+) while 31% ± 13 of the CD14− cells were CD16+. On Day 3, the percentage of CD14+ cells that were also CD16+ increased to 51% ± 21 (**p < 0.002) while the percentage of CD14− cells that were CD16+ decreased to 18% ± 12 (*p<0.05). All CD14+ cells on Day 0 expressed cell surface CD11b (CD11b+) and intracellular Mac387 (Mac387+) and the expression of these markers did not change significantly with culture. In addition, the percentage of CD14+ cells that expressed CD44v6 (CD44v6+) did not change while CD163 (CD163+) decreased significantly (*p<0.05) after 3 days of culture. Although the decrease in CD163 we found when data were pooled from seven independent donors was significant, we found changes in the expression of this marker to be highly donor specific, with cells from some donors exhibiting increased CD163 after 3 days of culture. The percentage of CD166 positive (CD166+) cells increased, but this change in expression was not significant. The percentage of CD14− cells that were Mac387+ or CD44v6+ remained constant while CD11b+ cells increased (**p< 0.002), and CD163+ (**p < 0.002) and CD166+ (*p < 0.05) cells decreased, after 3 days of culture. Changes in the expression of all the phenotypic markers in Group 2 monocytes after 3 days of culture were not significant, and represent trends in changes in expression, except for the increase in CD14+CD16+ cells (***p < 0.0001). As found for Group 1 monocytes, all CD14+ cells in Group 2 monocytes on Day 0 were CD11b+ and Mac387+ and the expression of these markers did not change with culture. An important finding from these experiments is that 3 days of non-adherent culture of both Groups 1 and 2 monocytes with MCSF increased significantly a subpopulation of CD14+ monocytes that was also CD16+, CD11b+ and Mac387+.
Fig. 2.
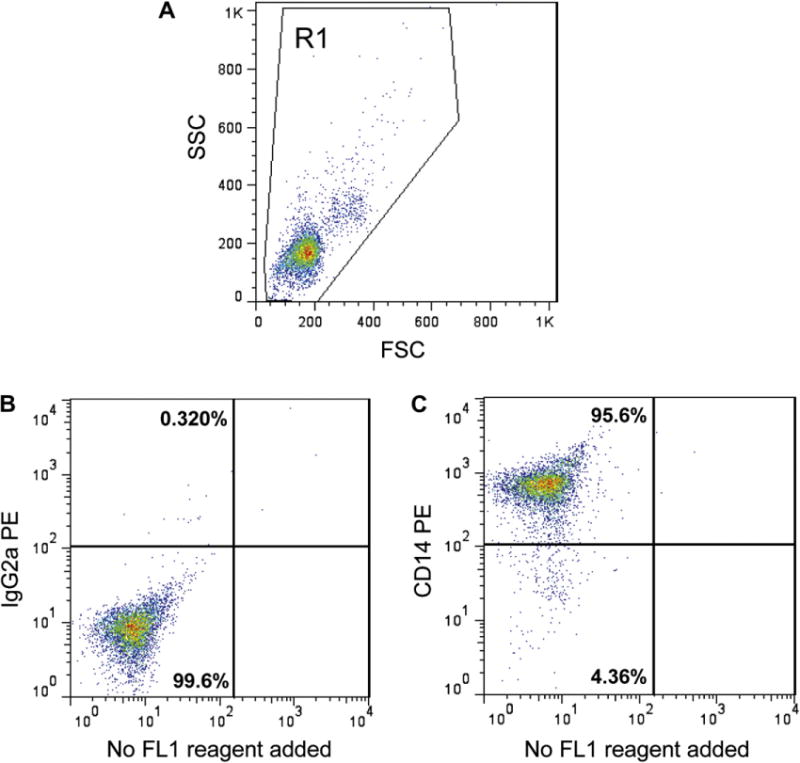
Cell surface CD14 expression by freshly isolated monocytes as analyzed by flow cytometry. CD14+ cells were isolated from PBMC by positive selection using anti-CD14 magnetic beads and then stained with anti-CD14-PE or IgG2a-PE, an isotype matched negative control antibody. (A) A representative dot plot of side scatter (SSC) and forward scatter (FSC) with the R1 gate used for analysis of cell immunofluorescence, (B) negative control IGg2a immunofluorescence, and (C) CD14 immunofluorescence. Values in each quadrant represent the percentage of cells.
Since cell surface CD14 expression in Group 1 monocytes decreased with culture, we determined whether CD14 was being shed or internalized in these cells. CD14 is a GPI-linked receptor and in many inflammatory conditions, soluble forms of this protein are released from cells [59]. We therefore assayed monocyte culture media for soluble CD14 (sCD14) by ELISA to determine the effects of cell culture on CD14 shedding. There was no difference in the levels of sCD14 in the media of monocytes from Group 1 (Fig. 3A, #1–2) or Group 2 (Fig. 3A, #3–4). These data demonstrate that loss of cell surface CD14 in Group 1 monocytes was not due to shedding. To determine whether culture conditions changed intracellular levels of CD14 in Group 1 cells, flow cytometry was performed on non-permeabilized and permeabilized monocytes. While 3 days of culture reduced the number of cells with cell surface CD14, the number of cells with intracellular CD14 did not change (Fig. 3B), with 97% of the cells maintaining intracellular expression of this antigen. These data indicate that when CD14+ monocytes lose cell surface expression of CD14 with culture, they maintain intracellular levels of this antigen. Thus, the loss of cell surface CD14 expression in Group 1 cells may be the result of receptor internalization.
Fig. 3.
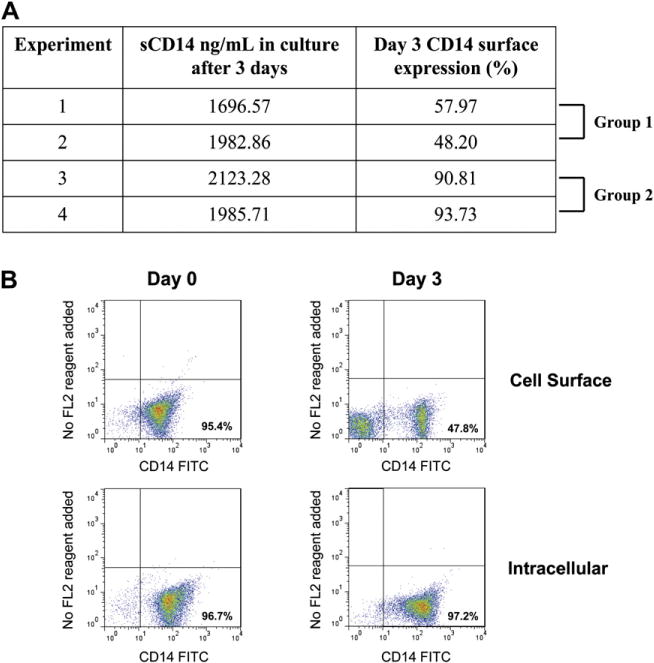
Loss of cell surface CD14 after culture with MCSF for 3 days is not due to shedding and these monocytes maintain intracellular levels of CD14. (A) Supernatants from monocytes cultured for 3 days with MCSF were assayed for soluble CD14 (sCD14) by ELISA. The percentage of cells expressing cell surface CD14, as analyzed by FACS, and the levels of sCD14 (ng/ml) in the supernatants are shown. (B) Cell surface CD14 is analyzed by FACS in freshly isolated monocytes (Day 0) and monocytes cultured for 3 days non-adherently with MCSF (Day 3) and intracellular CD14 is analyzed in cells permeabilized before staining with anti-CD14-FITC.
3.3. CD14+CD16+CD11b+Mac387+ subpopulation of cultured monocytes preferentially transmigrates across the BBB
We previously developed an in vitro model of the human BBB that consists of human brain microvascular endothelial cells (BMVEC) and human fetal astrocytes cocultured on opposite sides of tissue culture inserts [30–32,60]. Using this model, we examined the phenotype of monocytes that transmigrated across the BBB in response to CCL2 (MCP-1). CCL2 is a chemokine that has been shown to play a critical role during the migration of HIV and SIV infected and uninfected monocytes into the brain [31,61]. FACS analyses indicated that the CCL2 receptor, CCR2, was expressed on the surface of CD14+ monocytes that were freshly isolated (Day 0) as well as on those cultured non-adherently for 3 days (Day 3) (Fig. 4).
Fig. 4.

CD14+ monocytes, both freshly isolated and after 3 days of culture with MCSF, express cell surface CCR2. A representative histogram of PE immunofluorescence in freshly isolated CD14+ monocytes (Day 0) and in monocytes cultured for 3 days non-adherently with MCSF (Day 3) incubated with CCR2-PE or IgG2b-PE (isotype matched negative control) antibodies.
For transmigration experiments, CD14+ monocytes were cultured non-adherently for 3 days and designated as the start population. Cell surface CD14, CD16, CD163, CD11b and intracellular Mac387 expression in the start population was analyzed by multi-color flow cytometry. Start population monocytes (5 × 10⁵ cells/coculture) were then added to the top chambers of the BBB model with CCL2 (100 ng/ml) as a chemoattractant in the lower chambers. Monocytes that transmigrated across the cocultures after 24 h were collected from the bottom chamber and analyzed by multi-color flow cytometry for CD14, CD16, CD163, CD11b and Mac387.
Group 1 monocytes from five different donors were used for five independent transmigration experiments. The percentage of cell surface CD14+ cells in these cultures declined to 31–62% after 3 days (data not shown). Representative dot plots showing the results of four color FACS analyses of the start population and of transmigrated monocytes are shown in Fig. 5. In the start population there are three monocyte subpopulations, CD14−CD16−, CD14+CD16− and CD14+CD16+. After gating on the CD14+CD16+ cells, Mac387 (Fig. 5) and CD11+ (data not shown) were shown to be expressed by all of these cells. The predominant monocyte subpopulation that transmigrated across cocultures in response to CCL2 was CD14+CD16+ and all of these cells were also Mac387+ (Fig. 5) and CD11b+ (data not shown). It is important to note that the vast majority of monocytes that preferentially transmigrated expressed both CD14 and CD16 surface markers; significant transmigration of cells expressing CD16 alone was not detected. CD14+CD16+CD11b+Mac387+ monocytes in both the start population and in the transmigrated cells showed minimal CD163 expression (data not shown). We found that monocyte expression of CD163 is very donor dependent and we will expand the number of donors used in future studies to characterize further CD163 expression by cultured monocytes that transmigrate across our BBB model.
Fig. 5.
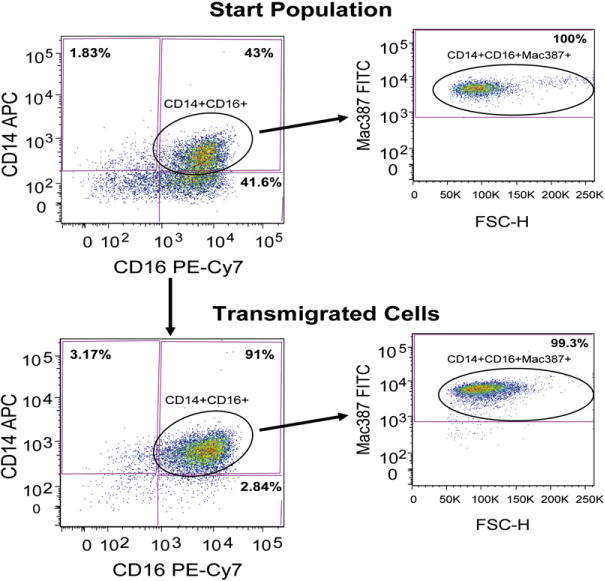
A CD14+/CD16+/CD11b+/Mac387+ monocyte subpopulation preferentially transmigrates across the BBB. CD14+ monocytes cultured non-adherently with MCSF for 3 days were designated the start population and analyzed by four color FACS with CD14-APC, CD16-PE-Cy7, Mac387-FITC and CD163-PE or CD11b-PE antibodies. A representative dot plot of CD14-APC and CD16-PE-Cy7 immunofluorescence is shown, with 100% of gated CD14+CD16+ cells exhibiting Mac387-FITC immunofluorescence. All CD14+CD16+ cells were also CD11b+ with minimal CD163 immunofluorescence (not shown). Start population cells were added to BBB cocultures with CCL2 for 24 h and transmigrated monocytes were also analyzed by four color FACS. A representative dot plot of CD14-APC and CD16-PE-Cy7 immunofluorescence shows that the vast majority of transmigrated monocytes were CD14+CD16+. All of the transmigrated CD14+CD16+ cells were also Mac387+ and CD11b+ (not shown), with minimal CD163 immunofluorescence (not shown). Values in each quadrant represent the percentage of cells (representative of five independent experiments).
3.4. Identification of markers by cDNA microarray analyses that characterize the monocyte subpopulation that preferentially transmigrates across the BBB
To characterize further the subpopulation(s) of monocytes that preferentially transmigrates across the BBB, we performed cDNA microarray analyses of two cell populations: (1) CD14+ monocytes cultured non-adherently for 3 days (start population) from which we extracted RNA from a portion of the cell culture with the remainder of the cells added to BBB cocultures and (2) the monocytes that transmigrated in response to CCL2 (array described in Section 2). Microarray analyses comparing the transmigrated monocytes to the start population of monocytes identified 474 differentially regulated genes of which 262 were downregulated (greater than 3-fold decrease) and 212 were upregulated (greater than 3-fold increase), as shown in Supplementary Table 1. These included several genes that encode for proteins involved in chemotaxis and metastasis, including connective tissue growth factor (CTGF), CCL18/PARC, S100 calcium-binding protein A12 (S100A12) and Egf-like module containing mucin-like hormone receptor-like sequence 1 (EMR1). CTGF gene expression was increased the highest (142-fold) in our microarray analyses of transmigrated monocytes. CTGF is a potent angiogenic, chemotactic, and extracellular matrix-inducing growth factor [62]. In both human atherosclerotic plaques and advanced stages of breast cancer, CTGF protein has been shown to be upregulated, which is postulated to facilitate monocyte migration into atherosclerotic lesions as well as to play a role in cancer cell metastasis [63,64]. The differences in the expression of this gene and others of interest will be confirmed by Western blotting.
The top five gene networks identified after analysis of the differentially regulated genes using IPA tools (Ingenuity) were: (1) gene expression, cancer, carbohydrate metabolism; (2) behavior, nervous system development and function and neurological disease; (3) antigen presentation, cell-mediated immune response, humoral immune response; (4) cell-to-cell signaling and interaction, hematological system development and function, immune cell trafficking; (5) endocrine system disorders, gastrointestinal disease, inflammatory disease. The antigen presentation, cell-mediated immune response, humoral immune response network is shown in Fig. 6. This network contains EMR1, which is described above.
Fig. 6.

A gene network generated from microarray analyses of monocytes that transmigrated across the BBB compared to the start population of CD14+ monocytes cultured with MCSF for 3 days. One of the top five gene networks identified after analysis of the differentially regulated genes using IPA tools (Ingenuity) was the antigen presentation, cell-mediated immune response, humoral immune response network. Genes are represented as nodes and the intensity of the node color indicates the degree of up (red) or down (green) regulation. Interactions are shown by lines. Lines with arrows represent direct interactions and lines without arrows indicate binding only. Solid lines show reported direct interactions and broken lines show indirect interactions. Functions are indicated by shapes: enzymes (diamonds), cytokines (squares), kinases (triangles), transcription regulators (horizontal ovals), transmembrane receptors (vertical ovals), transporters (trapezoids), complexes (concentric circles), and others (circles). (For interpretation of the references to color in this figure legend, the reader is referred to the web version of this article.)
Of particular interest is that one major canonical pathway identified by the IPA program was the dendritic cell maturation pathway (p-value<4 × 10⁻⁶). The significance of the association between our data set and specific canonical pathways was measured by a ratio of the number of genes from the data set that are members of the pathway divided by the total number of genes that map to the canonical pathway. In addition, Fischer’s exact test was used to calculate a p-value determining the probability that the association between the genes in the data set and the canonical pathway is explained by chance alone. The identification of the dendritic cell maturation canonical pathway is significant because many studies have indicated that monocytes and dendritic cells share a common progenitor cell(s) [65], and our data suggest that transmigrating monocytes and dendritic cells share the expression of a number of genes involved in cellular maturation and migration. Previous studies showed that upon transmigration across vascular endothelium, a number of CD16+ monocytes differentiate into dendritic-like cells and reverse transmigrate in an abluminal-to-luminal direction [66,67]. In another study, the transmigration of CD14+ monocytes across brain microvascular endothelium was shown to induce the differentiation of a subset of these cells into dendritic cells [68]. Thus, the identification of a dendritic cell maturation canonical pathway contributes to our understanding of the shared characteristics between transmigrating monocytes and dendritic cells.
3.5. HIV infection of monocytes is significantly increased by nonadherent culture for 3 days
There are conflicting data as to the extent that monocytes are HIV infected in the periphery in vivo, and freshly isolated peripheral blood monocytes have been reported to be refractory or only minimally susceptible to infection [15,69–71]. We hypothesized that as monocytes mature in our culture system, acquiring characteristics that facilitate their transmigration across the BBB, they would also become vulnerable to HIV infection. To address this, CD14+ monocytes were either infected immediately after isolation, or cultured for 3 days non-adherently and then infected. For infection of freshly isolated cells (Day 0), 2 × 10⁶ monocytes/ml were cultured in complete media and 20 ng/ml of HIVADA in polypropylene tubes or Teflon flasks for 24 h. Cells were then pelleted and resuspended in complete media for an additional 6 days in culture. Monocytes were also cultured non-adherently without virus for 3 days (Day 3) in complete media and then infected with 20 ng/ml of HIVADA for 24 h, pelleted and resuspended in complete media and cultured for an additional 6 days. Media was collected daily and assayed for p24.
As shown in Fig. 7, Day 3 monocytes infected with HIV robustly produced virus at Day 7 post infection, with p24 values of approximately 50,000 pg/ml. Day 0 infected monocytes produced very low amounts of virus, with p24 values of approximately 820 pg/ml. Similar data were obtained in three independent experiments using cells from three different donors. Thus, maturing monocytes in culture acquire characteristics that enable them to become significantly infected with HIV. To identify markers expressed by Day 3 monocytes that would correlate with, or facilitate, the ability of this mature subpopulation of cells to be productively infected by HIV, we performed microarray analyses. We compared RNA extracted from Day 0 monocytes with that from Day 3 monocytes. The data from these analyses demonstrated the upregulation of several genes on Day 3 whose protein products have been shown to interact with HIV proteins and therefore may facilitate monocyte infection (Supplementary Table 2). These include fibronectin (120-fold), syndecan (58-fold), integrin beta 5 (25-fold), matrix metalloproteinase 7 (MMP7) (17-fold), and tissue inhibitor of metalloproteinases 2 (TIMP2) (16-fold).
Fig. 7.
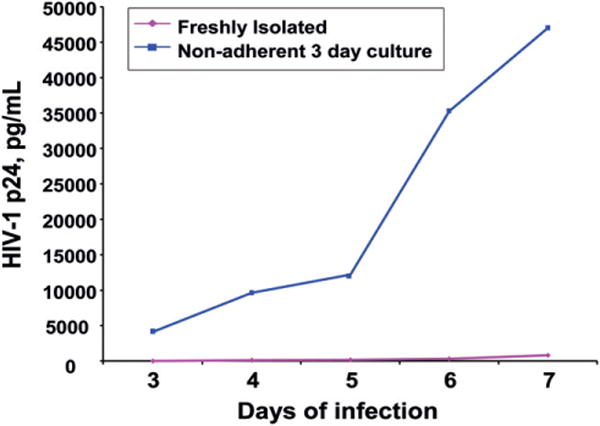
HIV infection of freshly isolated monocytes as compared to infection of monocytes cultured for 3 days with MCSF. CD14+ monocytes were either infected immediately after isolation (Day 0), or cultured for 3 days non-adherently and then infected (Day 3). Media was collected daily from each culture for 7 days and assayed for p24 by ELISA (representative of three independent experiments).
3.6. Newly identified markers that distinguish between monocytes and macrophages
The study of monocyte maturation/differentiation into macrophages has often been limited by the lack of markers that distinguish among maturing monocytes and macrophages. To characterize further this maturation/differentiation process and to identify protein markers that would distinguish differentiating monocytes from macrophages, we performed microarray analyses using Group 1 monocytes. We compared freshly isolated (Day 0) monocytes with those cultured for 3 days non-adherently (Day 3 non-adherent). Additionally, Day 3 non-adherent monocytes, representative of maturing monocytes in the peripheral blood circulation, were compared with those cultured under adherent conditions for 3 days (Day 3 adherent), which represent what we have termed a transitional cell, as shown in Fig. 1.
Microarray analyses of RNA from Day 0 vs. Day 3 non-adherent monocytes identified 2050 differentially regulated genes of which 402 were upregulated (greater than 5-fold increase) and 1647 were downregulated (greater than 2-fold decrease), as shown in Supplementary Table 3. These included several genes that encode for surface adhesion proteins such as mannose receptor 2, fibronectin 1, CD9, and syndecan 2, all of whose expression was upregulated greater than 50-fold. This upregulation of machinery necessary to traverse the vasculature is consistent with the differentiation of monocytes into an adherent macrophage, which requires the ability of monocytes to cross the endothelial lining of blood vessels to enter tissue and further mature into a fully functional macrophage. Additionally, osteopontin expression was highly upregulated (44-fold). This extracellular glycoprotein is believed to participate in inflammation [72] and circulating levels of osteopontin have been correlated with severity of SIV and HIV mediated CNS dysfunction [73]. The gene networks identified after analyses of the differentially regulated genes using the IPA program include cell–cell signaling/interactions, cellular movement, immune cell trafficking, cell morphology and neurologic disease (Fig. 8).
Fig. 8.

A gene network generated from microarray analyses of freshly isolated monocytes (Day 0) as compared to Day 3 non-adherent monocytes. One of the top gene networks identified after analysis of the differentially regulated genes using IPA tools (Ingenuity) was the cell–cell signaling/interactions, cellular movement, immune cell trafficking, cell morphology and neurologic disease network.
Genes identified by microarray analyses of Day 0 vs. Day 3 non-adherent monocytes that are associated with the CNS or neurologic disease were of particular interest, as we hypothesized that these genes may in some way facilitate targeting of maturing monocytes to the CNS. One such gene that was highly increased (>100-fold) in monocytes after 3 days in non-adherent culture was enolase 2 or neuronal gamma enolase. This gene is expressed in mature neurons and has been shown to confer metastatic potential to tumors of neuronal origin [74,75]. Therefore this gene may be involved in the induction of a migratory phenotype. Its expression in cells of the monocytic lineage has not been previously reported. To confirm that enolase 2 protein is expressed in maturing monocytes, protein lysates were prepared from Day 0, Day 3 and Day 6 non-adherent monocyte cultures and analyzed by Western blot for enolase 2 and GAPDH (Fig. 9A). We chose to examine Day 6 cultures to obtain a more complete demonstration of the kinetics of enolase 2 protein expression as monocytes mature. Cells were also cultured under adherent conditions to determine whether enolase 2 was expressed by mature macrophages. Densitometric analysis of enolase 2 protein levels normalized to GAPDH (Fig. 9C) demonstrated that freshly isolated monocytes (Day 0) do not express enolase 2. As the cells mature with non-adherent culture, they begin to express this protein, and by Day 6, enolase 2 is abundant. In contrast, adherent cells at Day 3 and 6 had no, or minimal, enolase 2. Thus, this protein appears to be a marker that distinguishes maturing monocytes from macrophages. The role of enolase 2 in targeting maturing monocytes to the CNS, or facilitating their interaction with CNS cells, is currently being examined.
Fig. 9.

Western blot analysis of enolase 2 and neuropilin in freshly isolated monocytes (Day 0) and Day 3 and Day 6 non-adherent and adherent monocytes. Protein lysates of freshly isolated monocytes and monocytes cultured non-adherently and adherently for 3 and 6 days with MCSF were prepared and analyzed by Western blot for (A) enolase 2 and (B) neuropilin. The blots were stripped and analyzed for GAPDH and densitometric analysis of enolase 2 (C) and neuropilin (D) normalized to GAPDH was performed.
Another gene that was upregulated in Day 3 non-adherent cells was neuropilin. Neuropilin is a protein receptor on neurons, whose ligands are semaphorins and vascular endothelial growth factor (VEGF) [76]. To examine neuropilin protein, lysates were prepared from Day 0, Day 3 and Day 6 non-adherent and adherent cultures and analyzed by Western blot (Fig. 9B). As shown in Fig. 9D, densitometric analysis of neuropilin protein levels normalized to GAPDH demonstrates that Day 0 monocytes lacked neuropilin expression, while those cultured for 3 or 6 days non-adherently expressed increased, although low levels, of neuropilin. In contrast, adherent cells expressed abundant amounts of neuropilin. Monocytes were recently reported to express no, or minimal, neuropilin, and MCSF mediated differentiation of monocytes into macrophages was shown to significantly upregulate expression of this receptor [77]. Our data confirm these findings and in addition, demonstrate that maturing monocytes express low, although detectable, levels of neuropilin protein. Thus, neuropilin appears to be a marker that distinguishes macrophages from monocytes. As VEGF, a neuropilin ligand, is highly expressed by maturing monocytes, it is possible that this provides an autocrine or paracrine mechanism by which maturing monocytes facilitate their differentiation into macrophages once within tissues.
Microarray analyses of monocytes cultured non-adherently for 3 days as compared to those cultured for 3 days under adherent conditions demonstrated that 1500 genes (~5% of genes analyzed) were differentially regulated; 176 genes upregulated (greater than 5-fold increase) and 1324 genes were downregulated (greater than 2-fold decrease) (see Supplementary Table 4). The role of several of these genes in monocyte maturation is currently being investigated.
4. Discussion
The transmigration of monocytes across the BBB plays a major role in HIV neuropathogenesis. Monocyte influx and accumulation within perivascular regions of CNS blood vessels contributes to disruption of the BBB, resulting in dysregulation of leukocyte trafficking into the CNS. Uninfected and HIV infected monocytes within the CNS differentiate into macrophages and initiate infection and/or activation of resident cells. Viral and chemotactic proteins mediate the recruitment of additional monocytes into the brain. Chronic neuroinflammation, HIV infection of resident CNS cells, and neurotoxic factor production ultimately lead to neuronal dysfunction and cell death. Thus, the prevalence of HAND is increasing as individuals receiving combination antiretroviral therapy (cART) live longer.
Characterizing the transmigration of specific monocyte subpopulations across the BBB is important to identify which subsets of cells may be involved in the initiation and propagation of inflammation and/or infection of CNS cells during the neuropathogenesis of HIV infection. In this study, we cultured freshly isolated human CD14+ monocytes non-adherently with MCSF, which mirrors the maturation of the heterogeneous population of monocytes in the peripheral blood circulation. Cultured CD14+ monocytes were divided into two groups; one whose percentage of cells expressing surface CD14 decrease with culture, and a second whose percentage of surface CD14 positive cells remains unchanged. In both groups, a monocyte subpopulation(s) expressing CD16, CD11b/Mac-1 and Mac387 expands under these culture conditions, providing sufficient numbers for analyses of their maturation/differentiation, transmigration across the BBB and ability to be infected by HIV.
The phenotypic markers CD14 and CD16 distinguish subpopulations of peripheral blood monocytes. CD14+CD16− cells represent 80–90% of total circulating monocytes, while CD14lowCD16+ and CD14+CD16+ cells represent 5–10% of total monocytes [28,78]. Previous studies showed that the proportion of circulating CD16+ monocytes expands in a number of inflammatory conditions [79,80] and with HIV and SIV infection [45,46]. CD16+ monocytes in vivo and in vitro are more permissive for HIV infection when compared to CD16− monocytes [81] and HIV is detected in CD14+CD16+ monocytes from infected individuals undergoing successful cART [82]. In a recent study, CD14lowCD16+ and CD14+CD16+ monocytes were shown to express distinct phenotypic and functional characteristics, including unique patterns of chemokine receptor expression and cytokine production in response to bacterial and viral pathogens [83]. The role of CD14lowCD16+ and/or CD14+CD16+ monocytes in HIV neuropathogenesis has not been well characterized. In this study, we describe the expansion of mature monocyte subpopulations after nonadherent culture of freshly isolated peripheral blood monocytes with MCSF and we show that these cells express CCR2 and are vulnerable to HIV infection. A CD16+ monocyte subpopulation(s) specifically expands in our culture system and a subset of these cells preferentially transmigrates across our in vitro model of the BBB in response to CCL2. Our ongoing studies will determine the specific CD16+ monocyte subset these transmigrating cells represent and the role they may play during the neuropathogenesis of HIV.
Our initial characterization of the CD16+ monocytes that transmigrated across our BBB model focused on microarray analyses of genes that were differentially expressed in this monocyte subset as compared to the Day 3 monocytes added to the top of BBB cocultures. Among the top upregulated genes were several involved in chemotaxis and metastasis. CTGF, the highest upregulated gene, is involved in cellular adhesion and migration [62]. Although CTGF mRNA was not detected in Mo/Mac in a previous study, purified peripheral blood mononuclear cells were found to chemotax to CTGF protein [63]. The upregulation in CTGF message in transmigrated CD14+CD16+CD11b+Mac387+ monocytes suggests that these cells produce CTGF and this protein may play a role in the diapedesis of this monocyte subpopulation across the BBB.
Another upregulated gene was CCL18/PARC. Mo/Mac produce low levels of the chemokine CCL18 [84]. Although freshly isolated monocytes do not respond to CCL18, maturing cultured Mo/Mac transiently chemotax to CCL18 [85]. The production of CCL18 at the BBB may facilitate the transmigration of CD14+CD16+CD11b+ Mac387+ monocytes because CD16+ cells are proposed to be a mature monocyte subpopulation and thus may be responsive to CCL18 [28].
Specific monocyte subsets are implicated in several inflammatory pathologies, and thus are of interest for developing therapeutic strategies that target specific monocyte subpopulations. Microarray analyses of maturing monocytes showed an increase in genes associated with cell adhesion, as well as genes not previously demonstrated in monocytic cells. Of interest are those associated with the nervous system. We hypothesize that expression of some of these genes by maturing monocytes within the blood provides a signature that targets them to the CNS. We demonstrated that maturing monocytes expressed high levels of enolase 2, but once adherent and fully differentiated into macrophages, enolase 2 expression was greatly reduced or absent. Enolase 2 is an isoenzyme reported to be expressed only in nervous tissue and neuronal tumors [86,87]. We propose that genes that regulate the participation of enolase 2 in metastasis may also contribute to monocyte migration and thus this protein may serve as a marker for a recently transmigrated monocyte within the CNS.
Osteopontin, which was also upregulated in maturing monocytes, has chemotactic properties and promotes cell survival [72]. Plasma osteopontin is increased in individuals with HAD and in monkeys before the development of SIV CNS disease [73]. Increased osteopontin was also found in the brains of infected humans and monkeys with encephalitis [24]. Osteopontin inhibited monocytes from reverse transmigrating across endothelial cells, modeling cells leaving the brain [88]. It has been proposed that osteopontin in the brain can lead to the accumulation of macrophages because it is anti-apoptotic and inhibits egress of monocytes. We hypothesize that as mature monocytes transmigrate across the BBB, they produce high levels of osteopontin that mediate the recruitment and maintenance of monocytes within the CNS.
We found neuropilin was expressed by cells that are more macrophage-like than monocyte-like. Neuropilin is also expressed by endothelial cells and binds VEGF [76]. Osteopontin upregulates VEGF expression by endothelial cells [89]. These data suggest that osteopontin, which we demonstrated to be produced by maturing monocytes, may induce VEGF at the BBB, promoting neuropilin mediated effects on the transmigration of monocytes across the BBB and/or macrophage differentiation within CNS perivascular regions.
Restriction of HIV infection in monocytes has been reported [12,14,15,69,70]. We propose that there is a specific subpopulation of maturing monocytes in the circulation that will soon cross the vasculature, and that these cells are infectable by HIV. Several studies indicate that monocytes prone to HIV infection include a CD16+ subset(s) [81,82]. The subpopulation(s) of monocytes susceptible to HIV infection is so small it is difficult to study in freshly isolated monocytes. Our culture system enabled the examination of these monocytes by expanding this population(s) to sufficient numbers for analysis. We demonstrated that freshly isolated monocytes are minimally susceptible to HIV infection, while those cultured non-adherently for 3 days are robustly infected. Microarray analyses of freshly isolated monocytes compared with those cultured non-adherently for 3 days resulted in identification of genes whose products interact with HIV proteins, including syndecan, a trans attachment receptor for HIV that maintains viable virus for up to 5 days in culture [90,91]. This may facilitate infection of other cells, or of the cell to which it binds. The fibronectin gene is also expressed in maturing monocytes. Fibronectin binds HIV gp120 and may play a role in virus–cell interactions and/or opsonization of virus [92,93].
Monocytes differentiate into macrophages and express markers that identify them as functional mature cells. Microarray analyses of maturing monocytes (Day 3 non-adherent cells) and cells at an intermediate stage of differentiation (Day 3 adherent-transitional cell) identified new markers of maturing macrophages that are minimally or not expressed by monocytes. Previous studies reported microarray analyses comparing monocytes and differentiated monocytic cell lines, while others compared freshly isolated monocytes with monocyte derived macrophages cultured for 6 or 7 days by adherence [94–97]. Ours is the first study comparing maturing monocytes and macrophages that have not yet fully differentiated.
Our study characterizes mature monocyte subpopulations that transmigrate across the BBB and are susceptible to HIV infection. We also identify markers that distinguish between monocytes and macrophages. Although cART has prolonged the survival of HIV infected individuals, HAND is becoming a major public health issue. A more complete understanding of the biology of the maturing monocyte that can traverse the BBB and is vulnerable to HIV infection should facilitate the development of strategies to limit NeuroAIDS.
Supplementary Material
Acknowledgments
We thank the Fetal Tissue Repository at AECOM, especially Dr. Brad Poulos, and the Flow Cytometry Core Facility at AECOM, especially Dr. Lydia Tesfa. We also thank Lillie Lopez, Leslie Adrien and Dr. Aimée Luers for technical assistance. This work was supported by the National Institute of Mental Health Grant, MH075679 and MH0702297 (JWB and TMC), NIH Centers for AIDS Research (CFAR) Grant AI-051519, especially the Immunology/Pathology Core (to all authors), the AECOM NCI Cancer Center support Grant 2P30CA013330 (to all authors), the National Institute of Health Molecular Neuropathology Training Grant NIH NS07098 (CMB) and UNCF/Merck Graduate Science Dissertation Fellowship (CMB).
Appendix A. Supplementary data
Supplementary data associated with this article can be found, in the online version, at doi:10.1016/j.cellimm.2010.12.004.
References
- 1.Antinori A, Arendt G, Becker JT, Brew BJ, Byrd DA, Cherner M, Clifford DB, Cinque P, Epstein LG, Goodkin K, Gisslen M, Grant I, Heaton RK, Joseph J, Marder K, Marra CM, McArthur JC, Nunn M, Price RW, Pulliam L, Robertson KR, Sacktor N, Valcour V, Wojna VE. Updated research nosology for HIV-associated neurocognitive disorders. Neurology. 2007;69:1789–1799. doi: 10.1212/01.WNL.0000287431.88658.8b. [DOI] [PMC free article] [PubMed] [Google Scholar]
- 2.Koenig S, Gendelman HE, Orenstein JM, Dal Canto MC, Pezeshkpour GH, Yungbluth M, Janotta F, Aksamit A, Martin MA, Fauci AS. Detection of AIDS virus in macrophages in brain tissue from AIDS patients with encephalopathy. Science. 1986;233:1089–1093. doi: 10.1126/science.3016903. [DOI] [PubMed] [Google Scholar]
- 3.Wiley CA, Schrier RD, Nelson JA, Lampert PW, Oldstone MB. Cellular localization of human immunodeficiency virus infection within the brains of acquired immune deficiency syndrome patients. Proc Natl Acad Sci USA. 1986;83:7089–7093. doi: 10.1073/pnas.83.18.7089. [DOI] [PMC free article] [PubMed] [Google Scholar]
- 4.Eugenin EA, Berman JW. Gap junctions mediate human immunodeficiency virus-bystander killing in astrocytes. J Neurosci. 2007;27:12844–12850. doi: 10.1523/JNEUROSCI.4154-07.2007. [DOI] [PMC free article] [PubMed] [Google Scholar]
- 5.Speth C, Dierich MP, Sopper S. HIV-infection of the central nervous system: the tightrope walk of innate immunity. Mol Immunol. 2005;42:213–228. doi: 10.1016/j.molimm.2004.06.018. [DOI] [PubMed] [Google Scholar]
- 6.Kanmogne GD, Schall K, Leibhart J, Knipe B, Gendelman HE, Persidsky Y. HIV-1 gp120 compromises blood–brain barrier integrity and enhances monocyte migration across blood–brain barrier: Implication for viral neuropathogenesis. J Cereb Blood Flow Metab. 2007;27:123–134. doi: 10.1038/sj.jcbfm.9600330. [DOI] [PMC free article] [PubMed] [Google Scholar]
- 7.Nath A, Conant K, Chen P, Scott C, Major EO. Transient exposure to HIV-1 Tat protein results in cytokine production in macrophages and astrocytes. A hit and run phenomenon. J Biol Chem. 1999;274:17098–17102. doi: 10.1074/jbc.274.24.17098. [DOI] [PubMed] [Google Scholar]
- 8.Wu DT, Woodman SE, Weiss JM, McManus CM, D’Aversa TG, Hesselgesser J, Major EO, Nath A, Berman JW. Mechanisms of leukocyte trafficking into the CNS. J Neurovirol. 2000;6(Suppl. 1):S82–S85. [PubMed] [Google Scholar]
- 9.Bellizzi MJ, Lu SM, Masliah E, Gelbard HA. Synaptic activity becomes excitotoxic in neurons exposed to elevated levels of platelet-activating factor. J Clin Invest. 2005;115:3185–3192. doi: 10.1172/JCI25444. [DOI] [PMC free article] [PubMed] [Google Scholar]
- 10.Brandimarti R, Khan MZ, Fatatis A, Meucci O. Regulation of cell cycle proteins by chemokine receptors: a novel pathway in human immunodeficiency virus neuropathogenesis? J Neurovirol. 2004;10(Suppl. 1):108–112. doi: 10.1080/753312761. [DOI] [PMC free article] [PubMed] [Google Scholar]
- 11.Heinzinger N, Baca-Regen L, Stevenson M, Gendelman HE. Efficient synthesis of viral nucleic acids following monocyte infection by HIV-1. Virology. 1995;206:731–735. doi: 10.1016/s0042-6822(95)80097-2. [DOI] [PMC free article] [PubMed] [Google Scholar]
- 12.Neil S, Martin F, Ikeda Y, Collins M. Postentry restriction to human immunodeficiency virus-based vector transduction in human monocytes. J Virol. 2001;75:5448–5456. doi: 10.1128/JVI.75.12.5448-5456.2001. [DOI] [PMC free article] [PubMed] [Google Scholar]
- 13.O’Brien WA, Namazi A, Kalhor H, Mao SH, Zack JA, Chen IS. Kinetics of human immunodeficiency virus type 1 reverse transcription in blood mononuclear phagocytes are slowed by limitations of nucleotide precursors. J Virol. 1994;68:1258–1263. doi: 10.1128/jvi.68.2.1258-1263.1994. [DOI] [PMC free article] [PubMed] [Google Scholar]
- 14.Sonza S, Maerz A, Deacon N, Meanger J, Mills J, Crowe S. Human immunodeficiency virus type 1 replication is blocked prior to reverse transcription and integration in freshly isolated peripheral blood monocytes. J Virol. 1996;70:3863–3869. doi: 10.1128/jvi.70.6.3863-3869.1996. [DOI] [PMC free article] [PubMed] [Google Scholar]
- 15.Triques K, Stevenson M. Characterization of restrictions to human immunodeficiency virus type 1 infection of monocytes. J Virol. 2004;78:5523–5527. doi: 10.1128/JVI.78.10.5523-5527.2004. [DOI] [PMC free article] [PubMed] [Google Scholar]
- 16.Kedzierska K, Ellery P, Mak J, Lewin SR, Crowe SM, Jaworowski A. HIV-1 down-modulates gamma signaling chain of Fc gamma R in human macrophages: a possible mechanism for inhibition of phagocytosis. J Immunol. 2002;168:2895–2903. doi: 10.4049/jimmunol.168.6.2895. [DOI] [PubMed] [Google Scholar]
- 17.Zhu T, Muthui D, Holte S, Nickle D, Feng F, Brodie S, Hwangbo Y, Mullins JI, Corey L. Evidence for human immunodeficiency virus type 1 replication in vivo in CD14(+) monocytes and its potential role as a source of virus in patients on highly active antiretroviral therapy. J Virol. 2002;76:707–716. doi: 10.1128/JVI.76.2.707-716.2002. [DOI] [PMC free article] [PubMed] [Google Scholar]
- 18.Ancuta P, Moses A, Gabuzda D. Transendothelial migration of CD16+ monocytes in response to fractalkine under constitutive and inflammatory conditions. Immunobiology. 2004;209:11–20. doi: 10.1016/j.imbio.2004.04.001. [DOI] [PubMed] [Google Scholar]
- 19.Ancuta P, Rao R, Moses A, Mehle A, Shaw SK, Luscinskas FW, Gabuzda D. Fractalkine preferentially mediates arrest and migration of CD16+ monocytes. J Exp Med. 2003;197:1701–1707. doi: 10.1084/jem.20022156. [DOI] [PMC free article] [PubMed] [Google Scholar]
- 20.Bissel SJ, Wang G, Trichel AM, Murphey-Corb M, Wiley CA. Longitudinal analysis of activation markers on monocyte subsets during the development of simian immunodeficiency virus encephalitis. J Neuroimmunol. 2006;177:85–98. doi: 10.1016/j.jneuroim.2006.04.017. [DOI] [PMC free article] [PubMed] [Google Scholar]
- 21.Bissel SJ, Wang G, Trichel AM, Murphey-Corb M, Wiley CA. Longitudinal analysis of monocyte/macrophage infection in simian immunodeficiency virus-infected, CD8+ T-cell-depleted macaques that develop lentiviral encephalitis. Am J Pathol. 2006;168:1553–1569. doi: 10.2353/ajpath.2006.050240. [DOI] [PMC free article] [PubMed] [Google Scholar]
- 22.Fischer-Smith T, Croul S, Sverstiuk AE, Capini C, L’Heureux D, Regulier EG, Richardson MW, Amini S, Morgello S, Khalili K, Rappaport J. CNS invasion by CD14+/CD16+ peripheral blood-derived monocytes in HIV dementia: perivascular accumulation and reservoir of HIV infection. J Neurovirol. 2001;7:528–541. doi: 10.1080/135502801753248114. [DOI] [PubMed] [Google Scholar]
- 23.Kim WK, Alvarez X, Fisher J, Bronfin B, Westmoreland S, McLaurin J, Williams K. CD163 identifies perivascular macrophages in normal and viral encephalitic brains and potential precursors to perivascular macrophages in blood. Am J Pathol. 2006;168:822–834. doi: 10.2353/ajpath.2006.050215. [DOI] [PMC free article] [PubMed] [Google Scholar]
- 24.Marcondes MC, Lanigan CM, Burdo TH, Watry DD, Fox HS. Increased expression of monocyte CD44v6 correlates with the development of encephalitis in rhesus macaques infected with simian immunodeficiency virus. J Infect Dis. 2008;197:1567–1576. doi: 10.1086/588002. [DOI] [PMC free article] [PubMed] [Google Scholar]
- 25.Dransfield I, Corcoran D, Partridge LJ, Hogg N, Burton DR. Comparison of human monocytes isolated by elutriation and adherence suggests that heterogeneity may reflect a continuum of maturation/activation states. Immunology. 1988;63:491–498. [PMC free article] [PubMed] [Google Scholar]
- 26.Turpin J, Hersh EM, Lopez-Berestein G. Characterization of small and large human peripheral blood monocytes: effects of in vitro maturation on hydrogen peroxide release and on the response to macrophage activators. J Immunol. 1986;136:4194–4198. [PubMed] [Google Scholar]
- 27.Ziegler-Heitbrock HW. Definition of human blood monocytes. J Leukoc Biol. 2000;67:603–606. doi: 10.1002/jlb.67.5.603. [DOI] [PubMed] [Google Scholar]
- 28.Ziegler-Heitbrock HW, Fingerle G, Strobel M, Schraut W, Stelter F, Schutt C, Passlick B, Pforte A. The novel subset of CD14+/CD16+ blood monocytes exhibits features of tissue macrophages. Eur J Immunol. 1993;23:2053–2058. doi: 10.1002/eji.1830230902. [DOI] [PubMed] [Google Scholar]
- 29.Eugenin EA, D’Aversa TG, Lopez L, Calderon TM, Berman JW. MCP-1 (CCL2) protects human neurons and astrocytes from NMDA or HIV-tat-induced apoptosis. J Neurochem. 2003;85:1299–1311. doi: 10.1046/j.1471-4159.2003.01775.x. [DOI] [PubMed] [Google Scholar]
- 30.Eugenin EA, Berman JW. Chemokine-dependent mechanisms of leukocyte trafficking across a model of the blood–brain barrier. Methods. 2003;29:351–361. doi: 10.1016/s1046-2023(02)00359-6. [DOI] [PubMed] [Google Scholar]
- 31.Eugenin EA, Osiecki K, Lopez L, Goldstein H, Calderon TM, Berman JW. CCL2/monocyte chemoattractant protein-1 mediates enhanced transmigration of human immunodeficiency virus (HIV)-infected leukocytes across the blood–brain barrier: a potential mechanism of HIV-CNS invasion and NeuroAIDS. J Neurosci. 2006;26:1098–1106. doi: 10.1523/JNEUROSCI.3863-05.2006. [DOI] [PMC free article] [PubMed] [Google Scholar]
- 32.Hurwitz AA, Berman JW, Rashbaum WK, Lyman WD. Human fetal astrocytes induce the expression of blood–brain barrier specific proteins by autologous endothelial cells. Brain Res. 1993;625:238–243. doi: 10.1016/0006-8993(93)91064-y. [DOI] [PubMed] [Google Scholar]
- 33.Weiss JM, Berman JW. Astrocyte expression of monocyte chemoattractant protein-1 is differentially regulated by transforming growth factor beta. J Neuroimmunol. 1998;91:190–197. doi: 10.1016/s0165-5728(98)00183-0. [DOI] [PubMed] [Google Scholar]
- 34.Jacquel A, Benikhlef N, Paggetti J, Lalaoui N, Guery L, Dufour EK, Ciudad M, Racoeur C, Micheau O, Delva L, Droin N, Solary E. Colony-stimulating factor-1-induced oscillations in phosphatidylinositol-3 kinase/AKT are required for caspase activation in monocytes undergoing differentiation into macrophages. Blood. 2009;114:3633–3641. doi: 10.1182/blood-2009-03-208843. [DOI] [PubMed] [Google Scholar]
- 35.Kadiu I, Wang T, Schlautman JD, Dubrovsky L, Ciborowski P, Bukrinsky M, Gendelman HE. HIV-1 transforms the monocyte plasma membrane proteome. Cell Immunol. 2009;258:44–58. doi: 10.1016/j.cellimm.2009.03.012. [DOI] [PMC free article] [PubMed] [Google Scholar]
- 36.van Furth R, Cohn ZA. The origin and kinetics of mononuclear phagocytes. J Exp Med. 1968;128:415–435. doi: 10.1084/jem.128.3.415. [DOI] [PMC free article] [PubMed] [Google Scholar]
- 37.Whitelaw DM, Batho HF. The distribution of monocytes in the rat. Cell Tissue Kinet. 1972;5:215–225. doi: 10.1111/j.1365-2184.1972.tb00360.x. [DOI] [PubMed] [Google Scholar]
- 38.Crowe S, Maslin C, Ellery P, Kedzierska K. Culture of HIV in monocytes and macrophages. Curr Protoc Immunol. 2004 doi: 10.1002/0471142735.im1204s62. Chapter 12, Unit 12.14. [DOI] [PubMed] [Google Scholar]
- 39.Gaskill PJ, Calderon TM, Luers AJ, Eugenin EA, Javitch JA, Berman JW. Human immunodeficiency virus (HIV) infection of human macrophages is increased by dopamine: a bridge between HIV-associated neurologic disorders and drug abuse. Am J Pathol. 2009;175:1148–1159. doi: 10.2353/ajpath.2009.081067. [DOI] [PMC free article] [PubMed] [Google Scholar]
- 40.Seshadri S, Duncan MD, Hart JM, Gavrilin MA, Wewers MD. Pyrin levels in human monocytes and monocyte-derived macrophages regulate IL-1beta processing and release. J Immunol. 2007;179:1274–1281. doi: 10.4049/jimmunol.179.2.1274. [DOI] [PubMed] [Google Scholar]
- 41.Wright SD, Ramos RA, Tobias PS, Ulevitch RJ, Mathison JC. CD14, a receptor for complexes of lipopolysaccharide (LPS) and LPS binding protein. Science. 1990;249:1431–1433. doi: 10.1126/science.1698311. [DOI] [PubMed] [Google Scholar]
- 42.Allen JB, Wong HL, Guyre PM, Simon GL, Wahl SM. Association of circulating receptor Fc gamma RIII-positive monocytes in AIDS patients with elevated levels of transforming growth factor-beta. J Clin Invest. 1991;87:1773–1779. doi: 10.1172/JCI115196. [DOI] [PMC free article] [PubMed] [Google Scholar]
- 43.Kim WK, Corey S, Alvarez X, Williams K. Monocyte/macrophage traffic in HIV and SIV encephalitis. J Leukoc Biol. 2003;74:650–656. doi: 10.1189/jlb.0503207. [DOI] [PubMed] [Google Scholar]
- 44.Locher C, Vanham G, Kestens L, Kruger M, Ceuppens JL, Vingerhoets J, Gigase P. Expression patterns of Fc gamma receptors, HLA-DR and selected adhesion molecules on monocytes from normal and HIV-infected individuals. Clin Exp Immunol. 1994;98:115–122. doi: 10.1111/j.1365-2249.1994.tb06616.x. [DOI] [PMC free article] [PubMed] [Google Scholar]
- 45.Otani I, Akari H, Nam KH, Mori K, Suzuki E, Shibata H, Doi K, Terao K, Yosikawa Y. Phenotypic changes in peripheral blood monocytes of cynomolgus monkeys acutely infected with simian immunodeficiency virus. AIDS Res Hum Retroviruses. 1998;14:1181–1186. doi: 10.1089/aid.1998.14.1181. [DOI] [PubMed] [Google Scholar]
- 46.Thieblemont N, Weiss L, Sadeghi HM, Estcourt C, Haeffner-Cavaillon N. CD14lowCD16high: a cytokine-producing monocyte subset which expands during human immunodeficiency virus infection. Eur J Immunol. 1995;25:3418–3424. doi: 10.1002/eji.1830251232. [DOI] [PubMed] [Google Scholar]
- 47.Pulliam L, Gascon R, Stubblebine M, McGuire D, McGrath MS. Unique monocyte subset in patients with AIDS dementia. Lancet. 1997;349:692–695. doi: 10.1016/S0140-6736(96)10178-1. [DOI] [PubMed] [Google Scholar]
- 48.Stewart M, Thiel M, Hogg N. Leukocyte integrins. Curr Opin Cell Biol. 1995;7:690–696. doi: 10.1016/0955-0674(95)80111-1. [DOI] [PubMed] [Google Scholar]
- 49.Otani I, Mori K, Sata T, Terao K, Doi K, Akari H, Yoshikawa Y. Accumulation of MAC387+ macrophages in paracortical areas of lymph nodes in rhesus monkeys acutely infected with simian immunodeficiency virus. Microbes Infect. 1999;1:977–985. doi: 10.1016/s1286-4579(99)80515-2. [DOI] [PubMed] [Google Scholar]
- 50.Poston RN, Hussain IF. The immunohistochemical heterogeneity of atheroma macrophages: comparison with lymphoid tissues suggests that recently blood-derived macrophages can be distinguished from longer-resident cells. J Histochem Cytochem. 1993;41:1503–1512. doi: 10.1177/41.10.7504008. [DOI] [PubMed] [Google Scholar]
- 51.Rugtveit J, Brandtzaeg P, Halstensen TS, Fausa O, Scott H. Increased macrophage subset in inflammatory bowel disease: apparent recruitment from peripheral blood monocytes. Gut. 1994;35:669–674. doi: 10.1136/gut.35.5.669. [DOI] [PMC free article] [PubMed] [Google Scholar]
- 52.Hauptmann S, Bernauer J, Zwadlo-Klarwasser G, Klosterhalfen B, Kirkpatrick CJ. Differential adherence of the human monocyte subsets 27E10 and RM3/1 to cytokine- or glucocorticoid-treated endothelial cells. Pathobiology. 1994;62:262–268. doi: 10.1159/000163919. [DOI] [PubMed] [Google Scholar]
- 53.Wenzel I, Roth J, Sorg C. Identification of a novel surface molecule, RM3/1, that contributes to the adhesion of glucocorticoid-induced human monocytes to endothelial cells. Eur J Immunol. 1996;26:2758–2763. doi: 10.1002/eji.1830261131. [DOI] [PubMed] [Google Scholar]
- 54.Fischer-Smith T, Tedaldi EM, Rappaport J. CD163/CD16 coexpression by circulating monocytes/macrophages in HIV: potential biomarkers for HIV infection and AIDS progression. AIDSRes Hum Retroviruses. 2008;24:417–421. doi: 10.1089/aid.2007.0193. [DOI] [PMC free article] [PubMed] [Google Scholar]
- 55.Braumuller H, Gansauge S, Ramadani M, Gansauge F. CD44v6 cell surface expression is a common feature of macrophages and macrophage-like cells – implication for a natural macrophage extravasation mechanism mimicked by tumor cells. FEBS Lett. 2000;476:240–247. doi: 10.1016/s0014-5793(00)01737-3. [DOI] [PubMed] [Google Scholar]
- 56.Bowen MA, Patel DD, Li X, Modrell B, Malacko AR, Wang WC, Marquardt H, Neubauer M, Pesando JM, Francke U, et al. Cloning, mapping, and characterization of activated leukocyte-cell adhesion molecule (ALCAM), a CD6 ligand. J Exp Med. 1995;181:2213–2220. doi: 10.1084/jem.181.6.2213. [DOI] [PMC free article] [PubMed] [Google Scholar]
- 57.Swart GW. Activated leukocyte cell adhesion molecule (CD166/ALCAM): developmental and mechanistic aspects of cell clustering and cell migration. Eur J Cell Biol. 2002;81:313–321. doi: 10.1078/0171-9335-00256. [DOI] [PubMed] [Google Scholar]
- 58.Cayrol R, Wosik K, Berard JL, Dodelet-Devillers A, Ifergan I, Kebir H, Haqqani AS, Kreymborg K, Krug S, Moumdjian R, Bouthillier A, Becher B, Arbour N, David S, Stanimirovic D, Prat A. Activated leukocyte cell adhesion molecule promotes leukocyte trafficking into the central nervous system. Nat Immunol. 2008;9:137–145. doi: 10.1038/ni1551. [DOI] [PubMed] [Google Scholar]
- 59.Bazil V, Strominger JL. Shedding as a mechanism of down-modulation of CD14 on stimulated human monocytes. J Immunol. 1991;147:1567–1574. [PubMed] [Google Scholar]
- 60.Weiss JM, Downie SA, Lyman WD, Berman JW. Astrocyte-derived monocyte-chemoattractant protein-1 directs the transmigration of leukocytes across a model of the human blood–brain barrier. J Immunol. 1998;161:6896–6903. [PubMed] [Google Scholar]
- 61.Zink MC, Coleman GD, Mankowski JL, Adams RJ, Tarwater PM, Fox K, Clements JE. Increased macrophage chemoattractant protein-1 in cerebrospinal fluid precedes and predicts simian immunodeficiency virus encephalitis. J Infect Dis. 2001;184:1015–1021. doi: 10.1086/323478. [DOI] [PubMed] [Google Scholar]
- 62.Lau LF, Lam SC. The CCN family of angiogenic regulators: the integrin connection. Exp Cell Res. 1999;248:44–57. doi: 10.1006/excr.1999.4456. [DOI] [PubMed] [Google Scholar]
- 63.Cicha I, Yilmaz A, Klein M, Raithel D, Brigstock DR, Daniel WG, Goppelt-Struebe M, Garlichs CD. Connective tissue growth factor is overexpressed in complicated atherosclerotic plaques and induces mononuclear cell chemotaxis in vitro. Arterioscler Thromb Vasc Biol. 2005;25:1008–1013. doi: 10.1161/01.ATV.0000162173.27682.7b. [DOI] [PubMed] [Google Scholar]
- 64.Xie D, Nakachi K, Wang H, Elashoff R, Koeffler HP. Elevated levels of connective tissue growth factor, WISP-1, and CYR61 in primary breast cancers associated with more advanced features. Cancer Res. 2001;61:8917–8923. [PubMed] [Google Scholar]
- 65.Leon B, Lopez-Bravo M, Ardavin C. Monocyte-derived dendritic cells. Semin Immunol. 2005;17:313–318. doi: 10.1016/j.smim.2005.05.013. [DOI] [PubMed] [Google Scholar]
- 66.Randolph GJ, Beaulieu S, Lebecque S, Steinman RM, Muller WA. Differentiation of monocytes into dendritic cells in a model of transendothelial trafficking. Science. 1998;282:480–483. doi: 10.1126/science.282.5388.480. [DOI] [PubMed] [Google Scholar]
- 67.Randolph GJ, Sanchez-Schmitz G, Liebman RM, Schakel K. The CD16(+) (FcgammaRIII(+)) subset of human monocytes preferentially becomes migratory dendritic cells in a model tissue setting. J Exp Med. 2002;196:517–527. doi: 10.1084/jem.20011608. [DOI] [PMC free article] [PubMed] [Google Scholar]
- 68.Ifergan I, Kebir H, Bernard M, Wosik K, Dodelet-Devillers A, Cayrol R, Arbour N, Prat A. The blood–brain barrier induces differentiation of migrating monocytes into Th17-polarizing dendritic cells. Brain. 2008;131:785–799. doi: 10.1093/brain/awm295. [DOI] [PubMed] [Google Scholar]
- 69.Arfi V, Riviere L, Jarrosson-Wuilleme L, Goujon C, Rigal D, Darlix JL, Cimarelli A. Characterization of the early steps of infection of primary blood monocytes by human immunodeficiency virus type 1. J Virol. 2008;82:6557–6565. doi: 10.1128/JVI.02321-07. [DOI] [PMC free article] [PubMed] [Google Scholar]
- 70.Dong C, Kwas C, Wu L. Transcriptional restriction of human immunodeficiency virus type 1 gene expression in undifferentiated primary monocytes. J Virol. 2009;83:3518–3527. doi: 10.1128/JVI.02665-08. [DOI] [PMC free article] [PubMed] [Google Scholar]
- 71.Sonza S, Mutimer HP, Oelrichs R, Jardine D, Harvey K, Dunne A, Purcell DF, Birch C, Crowe SM. Monocytes harbour replication-competent, non-latent HIV-1 in patients on highly active antiretroviral therapy. Aids. 2001;15:17–22. doi: 10.1097/00002030-200101050-00005. [DOI] [PubMed] [Google Scholar]
- 72.Wang KX, Denhardt DT. Osteopontin: role in immune regulation and stress responses. Cytokine Growth Factor Rev. 2008;19:333–345. doi: 10.1016/j.cytogfr.2008.08.001. [DOI] [PubMed] [Google Scholar]
- 73.Burdo TH, Ellis RJ, Fox HS. Osteopontin is increased in HIV-associated dementia. J Infect Dis. 2008;198:715–722. doi: 10.1086/590504. [DOI] [PMC free article] [PubMed] [Google Scholar]
- 74.Crary GS, Singleton TP, Neglia JP, Swanson PE, Strickler JG. Detection of metastatic neuroblastoma in bone marrow biopsy specimens with an antibody to neuron-specific enolase. Mod Pathol. 1992;5:308–311. [PubMed] [Google Scholar]
- 75.Nowicki M, Miskowiak B. Comparison of the cell immunophenotype of metastatic and primary foci in stage IV-S neuroblastoma. Folia Histochem Cytobiol. 2002;40:297–303. [PubMed] [Google Scholar]
- 76.Soker S, Takashima S, Miao HQ, Neufeld G, Klagsbrun M. Neuropilin-1 is expressed by endothelial and tumor cells as an isoform-specific receptor for vascular endothelial growth factor. Cell. 1998;92:735–745. doi: 10.1016/s0092-8674(00)81402-6. [DOI] [PubMed] [Google Scholar]
- 77.Ji JD, Park-Min KH, Ivashkiv LB. Expression and function of semaphorin 3A and its receptors in human monocyte-derived macrophages. Hum Immunol. 2009;70:211–217. doi: 10.1016/j.humimm.2009.01.026. [DOI] [PMC free article] [PubMed] [Google Scholar]
- 78.Rothe G, Gabriel H, Kovacs E, Klucken J, Stohr J, Kindermann W, Schmitz G. Peripheral blood mononuclear phagocyte subpopulations as cellular markers in hypercholesterolemia. Arterioscler Thromb Vasc Biol. 1996;16:1437–1447. doi: 10.1161/01.atv.16.12.1437. [DOI] [PubMed] [Google Scholar]
- 79.Draude G, von Hundelshausen P, Frankenberger M, Ziegler-Heitbrock HW, Weber C. Distinct scavenger receptor expression and function in the human CD14(+)/CD16(+) monocyte subset. Am J Physiol. 1999;276:H1144–H1149. doi: 10.1152/ajpheart.1999.276.4.H1144. [DOI] [PubMed] [Google Scholar]
- 80.Kawanaka N, Yamamura M, Aita T, Morita Y, Okamoto A, Kawashima M, Iwahashi M, Ueno A, Ohmoto Y, Makino H. CD14+, CD16+ blood monocytes and joint inflammation in rheumatoid arthritis. Arthritis Rheum. 2002;46:2578–2586. doi: 10.1002/art.10545. [DOI] [PubMed] [Google Scholar]
- 81.Ellery PJ, Tippett E, Chiu YL, Paukovics G, Cameron PU, Solomon A, Lewin SR, Gorry PR, Jaworowski A, Greene WC, Sonza S, Crowe SM. The CD16+ monocyte subset is more permissive to infection and preferentially harbors HIV-1 in vivo. J Immunol. 2007;178:6581–6589. doi: 10.4049/jimmunol.178.10.6581. [DOI] [PubMed] [Google Scholar]
- 82.Lopez CA, Vazquez M, Hill MD, Colon Mdel C, Porrata-Doria T, Johnston IC, Lorenzo E. Characterization of HIV-1 RNA forms in the plasma of patients undergoing successful HAART. Arch Virol. 2010;155:895–903. doi: 10.1007/s00705-010-0659-3. [DOI] [PMC free article] [PubMed] [Google Scholar]
- 83.Cros J, Cagnard N, Woollard K, Patey N, Zhang SY, Senechal B, Puel A, Biswas SK, Moshous D, Picard C, Jais JP, D’Cruz D, Casanova JL, Trouillet C, Geissmann F. Human CD14dim monocytes patrol and sense nucleic acids and viruses via TLR7 and TLR8 receptors. Immunity. 2010;33:375–386. doi: 10.1016/j.immuni.2010.08.012. [DOI] [PMC free article] [PubMed] [Google Scholar]
- 84.Schutyser E, Richmond A, Van Damme J. Involvement of CC chemokine ligand 18 (CCL18) in normal and pathological processes. J Leukoc Biol. 2005;78:14–26. doi: 10.1189/jlb.1204712. [DOI] [PMC free article] [PubMed] [Google Scholar]
- 85.Schraufstatter I, Takamori H, Sikora L, Sriramarao P, DiScipio RG. Eosinophils and monocytes produce pulmonary and activation-regulated chemokine, which activates cultured monocytes/macrophages. Am J Physiol Lung Cell Mol Physiol. 2004;286:L494–501. doi: 10.1152/ajplung.00323.2002. [DOI] [PubMed] [Google Scholar]
- 86.de Herder WW. Biochemistry of neuroendocrine tumours. Best Pract Res Clin Endocrinol Metab. 2007;21:33–41. doi: 10.1016/j.beem.2006.12.002. [DOI] [PubMed] [Google Scholar]
- 87.Hirano H, Yunoue S, Kaji M, Tsuchiya M, Arita K. Consecutive histological changes in an astroblastoma that disseminated to the spinal cord after repeated intracranial recurrences: a case report. Brain Tumor Pathol. 2008;25:25–31. doi: 10.1007/s10014-007-0224-2. [DOI] [PubMed] [Google Scholar]
- 88.Burdo TH, Wood MR, Fox HS. Osteopontin prevents monocyte recirculation and apoptosis. J Leukoc Biol. 2007;81:1504–1511. doi: 10.1189/jlb.1106711. [DOI] [PMC free article] [PubMed] [Google Scholar]
- 89.Dai J, Peng L, Fan K, Wang H, Wei R, Ji G, Cai J, Lu B, Li B, Zhang D, Kang Y, Tan M, Qian W, Guo Y. Osteopontin induces angiogenesis through activation of PI3K/AKT and ERK1/2 in endothelial cells. Oncogene. 2009;28:3412–3422. doi: 10.1038/onc.2009.189. [DOI] [PubMed] [Google Scholar]
- 90.Bobardt MD, Saphire AC, Hung HC, Yu X, Van der Schueren B, Zhang Z, David G, Gallay PA. Syndecan captures, protects, and transmits HIV to T lymphocytes. Immunity. 2003;18:27–39. doi: 10.1016/s1074-7613(02)00504-6. [DOI] [PubMed] [Google Scholar]
- 91.Saphire AC, Bobardt MD, Zhang Z, David G, Gallay PA. Syndecans serve as attachment receptors for human immunodeficiency virus type 1 on macrophages. J Virol. 2001;75:9187–9200. doi: 10.1128/JVI.75.19.9187-9200.2001. [DOI] [PMC free article] [PubMed] [Google Scholar]
- 92.Bozzini S, Falcone V, Conaldi PG, Visai L, Biancone L, Dolei A, Toniolo A, Speziale P. Heparin-binding domain of human fibronectin binds HIV-1 gp120/160 and reduces virus infectivity. J Med Virol. 1998;54:44–53. doi: 10.1002/(sici)1096-9071(199801)54:1<44::aid-jmv7>3.0.co;2-p. [DOI] [PubMed] [Google Scholar]
- 93.Greco G, Pal S, Pasqualini R, Schnapp LM. Matrix fibronectin increases HIV stability and infectivity. J Immunol. 2002;168:5722–5729. doi: 10.4049/jimmunol.168.11.5722. [DOI] [PubMed] [Google Scholar]
- 94.Hashimoto S, Suzuki T, Dong HY, Yamazaki N, Matsushima K. Serial analysis of gene expression in human monocytes and macrophages. Blood. 1999;94:837–844. [PubMed] [Google Scholar]
- 95.Lehtonen A, Ahlfors H, Veckman V, Miettinen M, Lahesmaa R, Julkunen I. Gene expression profiling during differentiation of human monocytes to macrophages or dendritic cells. J Leukoc Biol. 2007;82:710–720. doi: 10.1189/jlb.0307194. [DOI] [PubMed] [Google Scholar]
- 96.Li J, Pritchard DK, Wang X, Park DR, Bumgarner RE, Schwartz SM, Liles WC. CDNA microarray analysis reveals fundamental differences in the expression profiles of primary human monocytes, monocyte-derived macrophages, and alveolar macrophages. J Leukoc Biol. 2007;81:328–335. doi: 10.1189/jlb.0206124. [DOI] [PubMed] [Google Scholar]
- 97.Martinez FO, Gordon S, Locati M, Mantovani A. Transcriptional profiling of the human monocyte-to-macrophage differentiation and polarization: new molecules and patterns of gene expression. J Immunol. 2006;177:7303–7311. doi: 10.4049/jimmunol.177.10.7303. [DOI] [PubMed] [Google Scholar]
Associated Data
This section collects any data citations, data availability statements, or supplementary materials included in this article.