

Abstract
Stem cell-based therapies have demonstrated improved outcomes in preclinical and clinical trials for treating cardiovascular ischemic diseases. However, the contribution of stem cells to vascular repair is poorly understood. To elucidate these mechanisms, many have attempted to monitor stem cells following their delivery in vivo, but these studies have been limited by the fact that many contrast agents, including nanoparticles, are commonly passed on to non-stem cells in vivo. Specifically, cells of the reticuloendothelial system, such as macrophages, frequently endocytose free contrast agents, resulting in the monitoring of macrophages instead of the stem cell therapy. Here we demonstrate a dual gold nanoparticle system which is capable of monitoring both delivered stem cells and infiltrating macrophages using photoacoustic imaging. In vitro analysis confirmed preferential labeling of the two cell types with their respective nanoparticles and the maintenance of cell function following nanoparticle labeling. In addition, delivery of the system within a rat hind limb ischemia model demonstrated the ability to monitor stem cells and distinguish and quantify macrophage infiltration. These findings were confirmed by histology and mass spectrometry analysis. This work has important implications for cell tracking and monitoring cell-based therapies.
Introduction
Stem cell therapy shows great potential to treat a large variety of diseases, including cardiovascular diseases, which are the number one cause of death globally. [1] In particular, bone-marrow derived mesenchymal stem cells (MSCs) are advantageous in that they possess angiogenic properties, are easily obtained in large numbers and expandable in culture, and are part of the ischemic response. [1] Numerous preclinical and clinical trials have investigated the therapeutic benefits of stem cell therapy for cardiovascular diseases. However, advances in the field of stem cell therapy have been limited by the inability to track administered cells [2], which would provide information concerning cell engraftment and persistence, mechanisms of vascular regeneration, and the role of MSCs in vascular repair.
Conventional methods for assessing the biological mechanisms underlying disease states and potential therapies rely on postmortem histology, which only offers endpoint measurements and requires a large number of animals to be sacrificed in order to produce statistically significant results. A more ideal cell tracking method would involve using noninvasive longitudinal imaging to monitor cells. Towards this end, many contrast agents are currently being investigated to label cells for cell tracking purposes, including reporter genes[3-6], radionuclides[6-8], fluorescent probes[9-11], and nanoparticles[4, 8, 12-14]. Nanoparticles, such as quantum dots, iron oxide nanoparticles, and plasmonic nanoparticles (gold and silver), offer many advantages over other contrast agents. For example, nanoparticles can be optimized to promote cellular uptake through shape, size, and surface coating modification[12, 15-19] and allow for long-term monitoring of cells[12-14, 20]. However, viable and non-viable cells cannot be distinguished using nanoparticle contrast agents. As a result, it is not possible to detect if a cell is dead and has been endocytosed by macrophages, leading to a transfer of contrast agent from the labeled cells to macrophages. Other investigators have found nanoparticle transfer to macrophages[4, 21, 22], resulting in the monitoring and tracking of macrophages instead of the stem cell therapy.
Thus, the goal of this study is to develop a nanoparticle system which is capable of tracking stem cells following delivery in vivo and also monitoring macrophage infiltration and transfer of contrast agents from stem cells to macrophages as a result of macrophage endocytosis. Macrophages are known to have key roles in wound healing and vascular regeneration[23-26] and to be influenced by and exert paracrine effects on stem cells, including MSCs[27-29]. The nanoparticle system will consist of gold plasmonic nanoparticles. Gold nanoparticles can be synthesized in various shapes and sizes and their absorption characteristics can be tuned to maximally absorb in the near-infrared region, where the absorption from endogenous tissue is the lowest. Gold nanoparticles are also non-toxic to cells in certain formulations[12, 30, 31] and exhibit surface plasmon resonance, which contributes to their superior optical absorption properties[32, 33], making them ideal contrast agents for photoacoustic imaging[20, 34]. Figure 1 shows the outline of the dual nanoparticle system consisting of gold nanorods to label MSCs and gold nanospheres to label macrophages. This system is delivered within a 3D PEGylated fibrin gel, which promotes the angiogenic potential of MSCs and leads to tubular network formation within the gels, as demonstrated by previous work in our lab.[35] The gold nanorods were selected because these particles maximally absorb in the near-infrared region. On the other hand, gold nanospheres maximally absorb in the visible light region (520 nm), but plasmon coupling following nanosphere endocytosis by cells leads to peak broadening. Thus, the gold nanospheres will only be detected using photoacoustic imaging when they are endocytosed by macrophages and imaged within the tissue optical window of 650-900 nm. To evaluate this nanoparticle system, various in vitro assays were performed, including labeling of cells with the nanoparticles and the assessment of cell function and viability following nanoparticle labeling. In addition, in vitro and in vivo photoacoustic imaging experiments were performed to assess the feasibility of monitoring the two cell types. Histological analysis and mass spectrometry were also performed to verify the in vivo photoacoustic imaging results. This study has important implications for cell tracking and the role of MSCs and macrophages in vascular regeneration.
Fig 1.

Outline of the dual nanoparticle system for labeling MSCs with gold nanorods and macrophages with spherical gold nanospheres. The nanoparticles exhibit different optical absorption characteristics following endocytosis by cells and can thus be distinguished when imaged within the tissue optical window (highlighted wavelength region).
Experimental Section
Cell culture
Rat mesenchymal stem cells were isolated from the bone marrow of Lewis rats (200-300 g). The femoral marrow cavity was flushed and adherent cells were collected and cultured in Dulbecco's Modified Eagle Media (DMEM) (Invitrogen, Carlsbad, CA) supplemented with 10% fetal bovine serum (FBS), 1% glutamax, and 1% penicillin-streptomyocin. Non-adherent cells were removed after 24 hours by replacing the media. The media was then changed every two days and the cells were passed once reaching 80% confluency. The cells were cultured under standard cell culture conditions (37°C, 5% CO2). Passage 3-7 cells were used in all studies.
Murine macrophages (J774A.1, ATCC) were cultured under standard cell culture conditions (37°C, 5% CO2) in DMEM with 10% FBS. The media was changed every two days and passaged once reaching 80% confluency. Passage 10-20 cells were used in all studies.
Nanoparticle synthesis
Spherical gold nanoparticle seeds (20 nm in diameter) were synthesized by heating 100 mL of distilled (DI) water to 100°C and adding 1 mL of 10 mg/mL gold(III) chloride hydrate (HAuCl4). Then, 5 mL of 10 mg/mL sodium citrate dissolved in DI water was added and the reaction was allowed to cool to room temperature. Gold nanoparticles 50 nm in diameter were synthesized by mixing 7.5 mL of 10 mg/mL HAuCl4, 15.61 mL of 0.2 M ammonium hydroxylamine, 750 mL of DI water, and 50 nm of seed solution while stirring. The surface of the gold nanoparticles was coated with methoxy-polyethylene glycol-thiol (mPEG-SH) at a concentration of 0.1 mM and allowed to react for 30 minutes on a shaker, followed by centrifugal filtration (Amicon ultra-15, Millipore) to remove residual PEG.
Gold nanorods (NRs) were synthesized via seed mediated growth as previously described.[36, 37] Briefly, the seed solution was synthesized by mixing 5 mL of cetyl trimethylammonium bromide (CTAB) (0.2 M) with 5 mL of HAuCl4 (0.5 mM) while stirring vigorously. Then 0.6 mL of ice cold sodium borohydride (NaBH4) was added to the solution. The growth solution was prepared by mixing 380 mL of 0.2 M CTAB, 8 mL of 0.01 M silver nitrate (AgNO3), and 40 mL of 0.01 M HAuCl4 while stirring at 30°C. Then 4.4 mL of 0.1 M ascorbic acid (C6H8O6) was added drop wise, resulting in a color change from yellow to colorless. To produce NRs, 0.958 mL of gold nanoseeds were added to the growth solution and allowed to stir for 3 minutes. The solution was allowed to age overnight, centrifuged twice at 14000 rcf for 45 minutes, and resuspended in ultrafiltrated (18 MΩcm, Thermo Scientific Barnstead Diamond water purification systems) deionized water.
The NR surface was modified by replacing CTAB with mPEGSH through ligand exchange. Briefly, an equal volume of mPEG-SH (0.2 mM) was added to the gold NR solution, sonicated for 1 minute, and allowed to react overnight. Excess PEG was removed by centrifugal filtration (Amicon ultra-15, Millipore) at 2000 rcf for 10 minutes. Finally, a layer of silica was deposited on the surface of the PEG modified NRs through a modified Stöber method, as previously described.[38-40] Under vigorous stirring, 2 mL of PEGylated NRs was added to 3 mL of isopropanol, followed by 1.2 mL of tetraethyl orthosilica (TEOS) (3%) in isopropanol and 1.2 mL of ammonium hydroxide (8.4%) in isopropanol. The reaction was allowed to mix for 2 hours, followed by centrifugal filtration at 500 rcf for 15 minutes, twice. The NRs were then coated with a layer of poly-L-lysine (5 kD; Sigma-Aldrich) at a concentration of 0.833 mM and allowed to react for 2 hours, followed by centrifugation at 3000 rcf for 10 minutes and then 5000 rcf for 7 minutes.
The size of the nanoparticles was characterized using transmission electron microscope (TEM) analysis and dynamic light scattering (DLS), and the surface charge was characterized using zeta potential measurements. For TEM, an FEI Tecnai transmission electron microscope fitted with a top mount AMT Advantage HR 1kX1k digital camera and operating at 80 kV was used. A drop of nanoparticle solution was placed on carbon coated copper 300 mesh grids (Electron Microscopy Sciences, Hatfield, Pa) which had been glow discharged. ImageJ analysis was used to quantify the size of the NRs and thickness of the silica coating (n = 100). A DelsaNano (Beckman Coulter, Inc., Brea, CA) was used for DLS analysis of spherical nanoparticles. Nanoparticle solutions were loaded into a cuvette and readings were taken at a temperature of 25°C. For size measurements, 5 repetitions were performed for each nanoparticle solution with 60 readings per repetition. A Zetasizer Nano ZS (Malvern) was used to measure the zeta potential of nanoparticle solutions. A total of 3 measurements, with 15 repetitions, were collected at a temperature of 25°C.
Nanoparticle labeling of cells
Gold nanosphere media was made following PEGylation of 50 nm nanospheres. The nanospheres were sterile filtered using a 0.22 μm filter, centrifuged in a centrifugal filter tube (Amicon ultra-15, Millipore) at 3000 rcf for 5 minutes, and resuspended in cell culture media at a concentration of approximately 1012 NPs/mL. Gold NR media was made following PLL coating of silica NRs. The NRs were sterile filtered using a 0.22 μm filter and centrifuged at 3000 rcf for 10 minutes. The supernatant was then centrifuged at 5000 rcf for 7 minutes. The NRs were resuspended in cell culture media at a concentration of approximately 1012 NRs/mL. Macrophages were incubated with nanosphere media (200 μL/cm2) and MSCs were incubated with NR media (200 μL/cm2) for 24 hours.
Bright field and dark field microscopy was used to qualitatively analyze nanoparticle uptake by macrophages and MSCs. Following nanoparticle incubation, the media was removed and the cells were washed with phosphate buffered saline (PBS) to remove excess particles. The cells were then incubated with DAPI (1 μg/ml) for 15 minutes, followed by PBS washes. A Leica DMI2000B microscope, equipped with a Leica DFC290 camera, was used to obtain bright field and dark field images. Controls consisted of cells not incubated with nanoparticles.
Inductively coupled plasma mass spectrometry (ICP-MS) was used to quantitatively analyze nanoparticle uptake by macrophages and MSCs in 2D, as well as by macrophages in 3D PEGylated fibrin gels. The PEGylated fibrin gels were synthesized as described below and contained 50,000 cells/mL and 1012 NPs/mL. Following nanoparticle loading in 2D, the cells were collected using trypsinization and counted. To collect the cells in 3D, the gels were digested by incubation with 500 μL of bovine pancreatic trypsin (5 mg/mL in 0.9% sodium chloride) per 1 mL of gel for 1 hour. The reaction was quenched with serum containing media and the solution was filtered with a 70 μm and 40 μm cell strainer and centrifuged at 600 rcf for 7 minutes to collect the cells. To prepare the samples for ICP-MS, all of the solutions were incubated in 300 μL of 70% nitric acid at 60°C overnight. The solutions were then diluted to 3.7% nitric acid using ultrapure water prior to running the samples on the ICP-MS machine. The samples containing MSCs incubated with 50 nm gold nanospheres were prepared for ICP-MS analysis by heating the samples at 150°C and bringing them to dryness. The samples were then resuspended in 200 μL of aqua regia and further diluted with 2% HCl. Nanoparticle loading was quantified using a standard curve. Standard solutions were made by diluting AAS gold standard (Sigma-Aldrich, St. Louis, MO) in the same background solution as the samples. The number of nanoparticles per cell was calculated based on the NP dimensions and cell number.
MSCs and macrophages were co-cultured in a 3D PEGylated fibrin gel to investigate the nanoparticle system in a 3D environment. PEGylated fibrin gels were synthesized as described below and contained 25,000 MSCs/mL; 50,000 macrophages/mL; and 1014 NPs/mL. The gels were made in 12 well transwell plates with 8.0 μm pore sizes and were incubated at 37°C in MSC growth media.
Cell viability
Cell viability was assessed following nanoparticle labeling using LIVE/DEAD viability staining and an MTS proliferation assay. LIVE/DEAD staining was performed by incubating the cells with a working solution of calcein AM (4 μm) and ethidium homodimer-1 (1 μm) for 45 minutes at 37°C. The cells were washed with PBS and imaged using fluorescence microscopy (Leica DMI2000B microscope equipped with a Leica DFC 290 camera).
Cell proliferation following nanoparticle labeling was assessed using MTS. Cells were incubated with DMEM media containing 20% MTS solution for 4 hours at 37°C. The supernatant was collected and the absorbance value measured at 490 nm (n=3). A blank sample containing no cells was subtracted from all measurements.
The maintenance of cell function in 3D PEGylated fibrin gels was assessed after laser irradiation by examining cell morphology and tubular network formation. Difunctional succinimidyl glutarate PEG (8 mg/mL in PBS without calcium; NOF America) was added to fibrinogen (80 mg/mL in PBS without calcium; Sigma) in a 1:1 volume ratio, and the reaction was allowed to take place at room temperature for 3-5 minutes. An equal volume of MSCs as the fibrinogen and PEG mixture was then added at a concentration of 200,000 cells/mL. Gels with either NR labeled MSCs or unlabeled MSCs were made. The reaction then underwent gelation by adding an equal volume solution of thrombin (25 U/mL in 40 mM CaCl2; CalBiochem). The final concentrations in the gel were 10 mg/mL of fibrinogen; 1 mg/mL of SG-PEG-SG; 50,000 cells/mL; and 12.5 U/mL of thrombin. The gels were made in 4 well chambered coverglass slides (Laboratory-Tek II; Nalge Nunc) and incubated at 37°C in MSC growth media.
The gels were irradiated at various time points (day 1, 4, and 7) using a 800 nm laser with a fluence of 10 mJ/cm2 for 100 pulses. Control conditions consisted of the same gel formulations without laser irradiation. At day 7, the cells were stained with calcein AM (10 μM) and 3D z-stacks were taken using a Leica SP2 AOBS confocal microscope (10x magnification; 512×512 resolution). The images covered approximately 1 mm with a step size of approximately 3 μm. The 3D images were reconstructed using ImageJ.
In vitro photoacoustic imaging
A tissue mimicking phantom with varying ratios of NR labeled MSCs and nanosphere labeled macrophages was prepared for combined ultrasound and photoacoustic (US/PA) imaging. The bottom layer of the phantom consisted of gelatin (8% by weight; Sigma-Aldrich) with 15 μm diameter silica particles (0.2% by weight; Sigma-Aldrich) for ultrasonic scattering. The cell inclusions (20 μL) were placed on top of the bottom layer and consisted of gelatin mixed with cells. Each cell inclusion had a total of 10,000 cells.
Photoacoustic signals were captured using the Vevo LAZR system (VisualSonics, Inc.) including a tunable laser as well as a 40 MHz array transducer combined with an optical fiber bundle to deliver the laser pulses. RF signals were acquired for laser wavelengths ranging from 680-970 nm and with a laser fluence of 5-15 mJ/cm2. The transducer was mechanically scanned along the tissue mimicking phantom to obtain 3D photoacoustic information. The signals exported from the imaging system were post-processed for beamforming, laser fluence compensation, image reconstruction, and signal quantification. For spectral analysis, the quantified photoacoustic signals were used to calculate the ratio of the NR labeled MSCs and the nanosphere labeled macrophages in each voxel by comparison to weighted sums of their optical absorption spectrum. Then, the estimated ratios in the voxels were averaged to calculate the overall cell ratio for whole inclusions.
Ischemic injury and in vivo ultrasound and photoacoustic imaging
Animal handling and care followed the recommendations of the National Institutes of Health (NIH) guidelines for the care and use of laboratory animals. All protocols were approved by the Animal Care Committee at the University of Texas at Austin. Lewis rats (11 weeks) weighing 250-300 g were used. A femoral artery ligation was performed in Lew rats (11 weeks, male) to induce hind limb ischemia. Through a small incision on the medial side of the thigh, the femoral artery of a single hind limb was separated from the nearby nerve and vein and ligated immediately distal to the inferior epigastric artery and proximal to the branch point of the popliteal and saphenous arteries using Prolene 5-0 sutures. The ligated segment was then excised and the skin incision closed with interrupted sutures. The animal was allowed to recover overnight and the following day (about 24 hours later), MSCs were injected intramuscularly into the gastrocnemius muscle of the ligated limb. PEGylated fibrin injections were prepared by combining difunctional succinimidyl glutarate PEG (4 mg/mL in PBS without calcium; NOF America) to fibrinogen (40 mg/mL in PBS without calcium; Sigma) in a 1:1 volume ratio. An equal volume of MSCs labeled with gold NRs was mixed with the PEGylated fibrinogen solution in a 1:1 volume ratio at a concentration of 13×106 cells/mL. Next, 50 nm PEGylated gold nanospheres was added to the cell/PEGylated fibrin solution at a concentration of 1014 NPs/mL. The solution was then loaded into a 23 G needle syringe, followed by an equal volume of thrombin (25 U/mL in 40 mM CaCl2). The solution was mixed thoroughly within the syringe and the gel solution (300 uL) was injected into the gastrocnemius of the rat. The final concentrations in the gel were 5 mg/mL of fibrinogen; 0.5 mg/mL of SG-PEG-SG; 3.33×10⁶ cells/mL; and 12.5 U/mL of thrombin. Prior to delivery, MSCs were fluorescently labeled with CellTracker CM-DiI (Invitrogen). The cells were incubated with CM-DiI (15 μM) at 37°C for 8 minutes and then 4°C for 15 minutes, washed with PBS, and resuspended in DMEM.
Ultrasound and photoacoustic signals were captured using the Vevo LAZR (VisualSonics, Inc.) system. A 40 MHz array transducer incorporated with a fiber bundle was submerged in a water bath, and the rat hind limb was coupled through a transparent film at the bottom of the water bath. RF signals were acquired for laser wavelengths ranging from 680-970 nm and with a laser fluence of 5-10 mJ/cm2. Post-processing was the same as that for the in vitro photoacoustic. The processed photoacoustic and spectroscopic images were overlaid with ultrasound images using a user-defined threshold of the photoacoustic signals.
Histology
At the terminal endpoint of the study, animals were sacrificed and the gastrocnemius muscles were isolated, embedded in optimal cutting temperature (OCT) compound, submerged in liquid nitrogen-cooled isopentane, and stored at -80°C until further processing. The samples were cut into 12 μm thick sections using a cryostat and placed onto positively charged microscope slides. The tissue sections were fixed in 10% formalin for 15 minutes. Imunohistochemical and histochemical staining were subsequently performed.
For immunostaining, the slides were incubated in 0.125% trypsin solution for 20 minutes at 37°C. They were then permeabilized in 0.5% Triton X-100 in TBST for 30 minutes and blocked in 10% normal goat serum for 1 hour. The slides were incubated overnight at 4°C in the primary antibody (1:50 dilution in 2.5% normal goat serum) (ED1; Millipore), followed by incubation with a fluorescence-conjugated secondary antibody (1:200 in 2.5% normal goat serum) (Alexa Fluor 488 Goat Anti-Mouse Immunoglobulin G; Life Technologies). As a negative control, normal immunoglobulin G was used instead of the primary antibody. The samples were counterstained with DAPI (5 ug/mL) for 15 minutes, mounted, and viewed using a fluorescence microscope (DMI2000B; Leica)
TUNEL staining was performed with the APO-BrdU TUNEL Assay Kit (Invitrogen). The slides were incubated in 0.125% trypsin for 20 minutes at 37°C, followed by permeabilization in 0.5% Triton X-100 for 30 minutes. The slides were then incubated with TdT and BrdUTP for 2 hours at 37°C. Alexa Fluor 488 dye-labeled anti-BrdU antibody was applied for 30 minutes. The slides were then counterstained with DAPI (5 ug/mL) for 15 minutes, mounted, and viewed using a fluorescence microscope (DMI2000B; Leica).
Fluorescence-activated cell sorting of macrophages
Seven days following intramuscular injection of nanorod labeled or unlabeled MSCs and nanospheres within PEGylated fibrin, animals were sacrificed and the gastrocnemius muscle was isolated. The muscle samples were finely minced and incubated in 1% collagenase in DMEM for 1 hour at 37°C under constant agitation. Samples were then filtered through cell strainers (40 μm and 70 μm), washed with PBS, and blocked for 30 minutes in fluorescence-activated cell sorting (FACS) buffer (1% BSA in PBS + 1% sodium azide). Samples were then incubated with primary antibody (1:50; ED1; Millipore) in FACS buffer for 45 minutes, washed, and incubated in secondary antibody (1:50; Alexa Fluor 488 Goat Anti-Mouse Immunoglobulin G; Life Technologies) for 45 minutes. Next, samples were fixed in 4% neutral buffered formalin for 15 minutes, washed, and resuspended in PBS. Samples were then sorted for macrophages using a FACSAria flow cytometer. Following sorting, samples were digested for ICP-MS analysis. The cells were collected by centrifuging at 270xg for 5 minutes and resuspended in a small volume of aqua regia solution. The samples were heated at 150°C and brought to dryness. They were then resuspended in 250 μL of aqua regia and further diluted with ultrapure water to give an HCl concentration of 5%. A standard curve was used to quantify the amount of gold in the cells by diluting AAS gold standard (Sigma-Aldrich, St. Louis, MO) in the same background solution as that of the cell solutions. The data was quantified by calculating the mass of gold per macrophage.
Results
Nanoparticle Characterization
The size, shape, and surface charge of gold NRs and nanospheres were characterized using ultraviolet-light spectroscopy (UV-vis), TEM analysis, DLS, and zeta potential measurements. The absorbance spectra of gold NRs had a peak around 750 nm, which red shifted 20 nm following silica coating and an additional 8 nm following poly-L-lysine (PLL) coating (Figure 2A). Zeta potential measurements confirmed the sequential coatings were deposited on the NRs (Figure 2A), as the surface charge was +40 mV for CTAB coated NRs, -0.61 mV for PEG coated NRs, -30.37 mV for silica coated NRs, and +26 mV for PLL coated NRs. Using TEM analysis, the size of the NRs was measured as 55.63 ± 9.14 × 15.59 ± 3.45 nm, with a silica coating thickness of 25.04 ± 3.06 nm (Figure 2A). The 50 nm spherical nanoparticles had an absorbance peak around 520 nm (Figure 2B), with a red shift of a few nm following PEG coating (data not shown). TEM analysis confirmed the spherical shape of the particles and DLS measured the hydrodynamic diameter of the particles as being 50.4 nm with a polydispersity index of 0.044 (Figure 2B). Zeta potential measurements demonstrated that the nanospheres had a negative surface charge (-46.07 mV), which became closer to neutral (-8.41 mV) following PEG coating (Figure 2B).
Fig 2.

Characterization of (A) gold nanorods and (B) spheres using ultraviolet-light spectroscopy, transmission electron microscopy, and zeta potential analysis.
Nanoparticle Labeling of Cells
MSCs were incubated with PLL silica NRs and the uptake by the cells was qualitatively analyzed using microscopy and quantitatively analyzed using ICP-MS. Dark field microscopy demonstrated nanoparticle labeling of MSCs as evident by the yellow/green color of the cells as compared to control cells (Figure 3A, C). In addition, dark nanoparticle aggregates within cells were visible under bright field (Figure 3B, D). ICP-MS analysis quantified the number of nanorods per MSC as 1.89 ± 0.877 × 10⁵ nanorods/cell (Figure 4A). This large extent of extent of cellular uptake of the nanorods can be attributed in part to both the silica coating, providing a more spherical shape to the particle which is more conducive for cellular uptake [16, 17, 41], and the PLL surface coating, which is commonly used as a transfection agent and has been used to promote cellular uptake of iron oxide nanoparticles[42-44].
Fig 3.

Assessment of nanoparticle labeling of cells using dark field and bright field microscopy. Control MSCs are shown in (A) and (B) and nanorod labeled MSCs are shown in (C) and (D). Images are overlaid with DAPI fluorescence images. Control macrophages are shown in (E) and (F) and nanosphere labeled macrophages are shown in (G) and (H). MSCs incubated with 50 nm PEGylated nanospheres are shown in (I) and (J).
Fig 4.

Quantification of (A) nanorod (NR) labeling of MSCs and (B) nanosphere (NP) labeling of macrophages (MPH) and mesenchymal stem cells using inductively coupled plasma mass spectrometry.
Macrophages were incubated with 50 nm PEGylated gold nanospheres and dark field and bright field microscopy demonstrated a large extent of uptake by the cells (Figure 3G, H) as compared to control cells (Figure 3E, F). In addition, MSCs were incubated with the same nanoparticles and there was no evident uptake by the cells (Figure 3I, J), which was verified by ICP-MS measurements (Figure 4B). The reason MSCs did not uptake these particles can be attributed to the PEG surface coating, which passivates the particles and gives them a neutral charge, leading to minimal detection and uptake by cells[41, 45]. Macrophages, on the other hand, are characterized by their high rate of nonspecific uptake, and thus endocytose these particles to a large extent.[46] Over time the mPEG-SH layer is slowly displaced by serum proteins, leading to preferential uptake by macrophages.[47, 48] Thus, 50 nm PEGylated gold nanospheres can be used as a contrast agent to preferentially label macrophages and identify the infiltration of macrophages in vivo. ICP-MS measurements quantified the number of gold nanospheres per macrophage as 6.76 ± 1.68 × 10³ nanospheres/cell in 2D culture (Figure 4B). The macrophages were also cultured in 3D PEGylated fibrin gels containing gold nanospheres in order to more closely resemble the in vivo scenario in which macrophages will infiltrate the ischemic area and come in contact with nanospheres delivered within a 3D hydrogel. The number of gold nanospheres per macrophage in 3D culture as measured with ICPMS was 4.38 ± 1.63 × 10³ nanospheres/cell. These measurements took into account the fact that gold nanospheres not endocytosed by cells could still be entrapped in the gels. As a result, gels containing only gold nanospheres were used as a blank and subtracted from the 3D cell measurements.
Co-culture of the two cell types within a 3D PEGylated fibrin gel showed that nanorod labeled MSCs formed tubular networks in the gels after 7 days. Macrophages maintained a rounded morphology within the gel and started to endocytose nanoparticles. Figure 5 shows the co-culture system, with nanoparticle labeled macrophages circled in yellow.
Fig 5.

(A) Schematic showing a 3D co-culture system of nanorod labeled MSCs, macrophages, and nanospheres within a PEGylated fibrin gel. (B) Bright field microscopy demonstrating nanoparticle uptake by macrophages within the gels (yellow circles).
Cell Viability and Function Following Nanoparticle Labeling
LIVE/DEAD staining and an MTS proliferation assay were used to assess cell viability following nanoparticle labeling. Nanoparticle cytotoxicity is dependent upon the size, shape, and surface coating of the nanoparticles. In particular, CTAB, a surfactant used during nanorod synthesis and which forms a bilayer on the surface of the nanorod, is especially cytotoxic to cells, and thus removing or displacing CTAB is necessary to reduce the cytotoxic effects.[31, 49, 50] Following labeling of MSCs with silica coated NRs, MSCs were viable up to 5 days and continued to proliferate, with no significant reduction in cell proliferation compared to the control cells (Figure 6A, B). Labeling of macrophages with 50 nm PEGylated gold nanospheres did not affect cell proliferation or viability (Figure 6C, D) compared to controls.
Fig 6.

LIVE/DEAD staining of (A) control and nanorod labeled MSCs and (C) control and 50 nm PEGylated nanosphere labeled macrophages at day 5. MTS assay of (B) control and nanorod labeled MSCs and (D) control and 50 nm PEGylated nanosphere labeled macrophages to assess cell proliferation.
The maintenance of MSC tubular network formation within 3D PEGylated fibrin gels was assessed following nanorod labeling and laser irradiation. This was performed to verify the process of photoacoustic imaging did not affect the cells’ ability to form tubular networks. MSCs without NR labeling or laser irradiation formed extensive tubular networks within the gels, and this network formation was maintained following NR labeling (Figure 7A, B). The gels were also irradiated with a 800 nm laser to ensure photoacoustic imaging did not affect cell function. Both non-labeled cells and NR labeled cells continued to form networks following laser irradiation (Figure 7C, D). These results demonstrate that the cells maintain their function of forming tubular networks following NR labeling and photoacoustic imaging.
Fig 7.
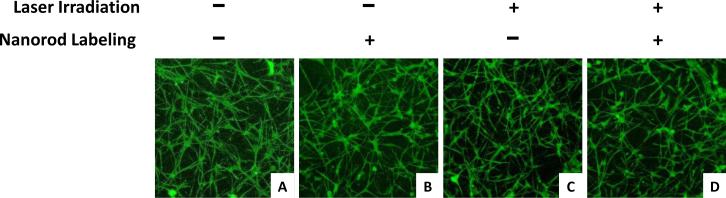
3D stacks of tubular network formation within PEGylated fibrin gels for (A. C) unlabeled and (B, D) NR labeled MSCs with (A, B) no laser irradiation or (C, D) laser irradiation.
In Vitro Photoacoustic Imaging of Nanoparticle Labeled Cells
In vitro photoacoustic imaging of nanosphere labeled macrophages and NR labeled MSCs was performed to evaluate the feasibility of distinguishing and quantifying the two cell types using photoacoustic imaging. The two cell types were mixed in various ratios and Figure 8 shows the spectroscopic results in which the 100% macrophage inclusion was identified as having 50 nm PEGylated nanospheres (red) and the 100% MSC inclusion was identified as having NRs (green). A transition from nanospheres to NRs is evident as the concentration of macrophages decreases and of MSCs increases. These results demonstrate that the two cell types can be distinguished based on labeling with different nanoparticles, even when they are in close proximity. In addition, the ratios of the two cell types were calculated based on the photoacoustic imaging results, with the predicted cell ratios being a very good estimate of the actual cell ratios in the inclusions. Thus, photoacoustic imaging can be used in combination with the dual nanoparticle system presented here to quantify the ratios of cells within a region. This data would be important for in vivo applications to quantify the infiltration of macrophages and the persistence of MSCs following delivery.
Fig 8.

(A) Spectroscopic in vitro photoacoustic imaging of nanosphere labeled macrophages (red) and nanorod labeled MSCs (green) mixed in various ratios. (B) Quantification of the ratio of the two cell types based on the photoacoustic imaging results.
In Vivo Photoacoustic Imaging of Nanoparticle Labeled Cells
The dual nanoparticle system (consisting of NR labeled MSCs and nanospheres) was intramuscularly injected within PEGylated fibrin gel into the gastrocnemius of a rat following an ischemic injury. Combined ultrasound and photoacoustic imaging (US/PA) obtained at 800 nm shows a high photoacoustic signal located within the gastrocnemius muscle (Figure 9A), which persisted until day 7. Spectroscopic analysis attributes the photoacoustic signal to NRs (shown in green) immediately after the injection on day 0. Over time, the contribution from 50 nm PEGylated nanospheres increases (shown in red) (Figure 9B). In addition, there is a 20% relative increase in signal attributed to the nanospheres from day 0 to day 7 (Figure 9C). This increase in signal from nanospheres can be attributed to infiltration of macrophages following the ischemic injury and subsequent endocytosis of the PEGylated nanospheres by the cells. The endocytosis of the nanospheres by macrophages leads to plasmon coupling of the particles [46], as demonstrated by the peak shift in Figure 1, and thus an increase in photoacoustic signal within the range of wavelengths which were used for imaging (680-970 nm). A majority of the infiltrating macrophages are localized around the delivered gel system. This could be attributed in part to the fact that the nanospheres were delivered within the gel system containing the MSCs, and thus the nanoparticles which were available for phagocytosis by the macrophages were already localized in close proximity to the stem cells. In addition, others have shown that macrophages have important roles in wound healing and angiogenesis[24, 51, 52], with stem cells and macrophages potentially undergoing some sort of synergistic crosstalk to further promote the regeneration process. MSCs have been shown to secrete not only angiogenic factors, but also factors which influence macrophage function.[53-55] Furthermore, others have found that macrophages are frequently associated with endothelial cells during the process of angiogenesis.[56] In addition, chemotactic signals secreted from apoptotic stem cells could also promote macrophage migration to the area. Stem cell death following delivery for therapeutic purposes is a common issue, and thus it would not be surprising if macrophages are entering the area to scavenge apoptotic MSCs. Thus, one of the advantages of this dual nanoparticle system is the ability to distinguish the two cell types in vivo, providing information about the interaction between stem cells and macrophages. Such information could include if macrophages are phagocytosing MSCs leading to a transfer of contrast agent from MSCs to macrophages. Based on our imaging system, we would designate transfer of contrast agent from MSCs to macrophages if there is co-localization of the nanosphere and nanorod signal.
Fig 9.

(A) Longitudinal ultrasound/photoacoustic imaging (800 nm) and spectroscopic photoacoustic imaging of NR labeled MSCs and nanospheres injected within PEGylated fibrin gel into the gastrocnemius. (B) Ratio of macrophages/MSCs over time. (C) Quantification of the relative photoacoustic signal increase attributed to nanospheres compared to day 0.
Histological analysis of the muscle sample following sacrifice at day 7 shows the presence of injected MSCs (fluorescently pre-labeled with CM-DiI) distributed throughout the muscle fibers (Figure 10A). In addition, the presence of nanoparticles within the cells is evident under bright field. TUNEL staining was performed to assess cell apoptosis following injection. The TUNEL staining in Figure 10B shows a large extent of cell death within the injection region corresponding to the delivered MSCs. It has been largely reported in the literature that only a small proportion of stem cells survive following delivery.[55, 57, 58] Immunostaining for macrophages (ED1) in Figure 10C shows macrophage infiltration within the muscle and in particularly close proximity to the injected MSCs, which were fluorescently labeled with CM-DiI prior to delivery. The ED1 immunostaining data supports the in vivo photoacoustic imaging results, which shows the presence of macrophages on day 7 surrounding the injected MSCs.
Fig 10.

(A) Fluorescent microscopy of muscle sections demonstrating CM-DiI labeled MSCs which were intramuscularly injected. Bright field microscopy shows the localization of nanoparticles within the cells. (B) TUNEL staining demonstrates MSC death following injection. (C) Immunostaining for ED1 cell surface marker demonstrates macrophage infiltration. Scale bars = 50 μm.
Fluorescence-activated cell sorting of macrophages
Macrophages were sorted from gastrocnemius muscle 7 days following injection. ICP-MS analysis confirmed that macrophages endocytosed gold nanoparticles within the muscle (Figure 11). To confirm that macrophages were not just endocytosing MSCs labeled with gold NRs, a control condition consisting of unlabeled MSCs was used. In this condition gold was also detected within isolated macrophages, confirming that macrophages are endocytosing the gold nanospheres.
Fig 11.
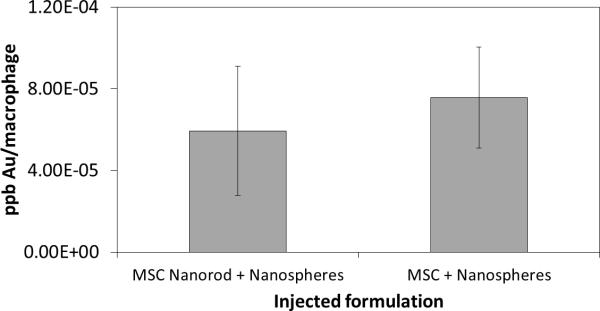
Inductively coupled plasma mass spectrometry analysis to quantify nanoparticle labeling of macrophages isolated from gastrocnemius. Test conditions included nanorod labeled and unlabeled MSCs delivered in combination with nanospheres.
Conclusions
This study demonstrated the use of a dual nanoparticle system to monitor stem cells following delivery and to detect the presence of infiltrating macrophages to a wound area. Cellular uptake of the nanoparticles was qualitatively and quantitatively assessed in vitro using microscopy and mass spectrometry, respectively. In addition, the viability and function of the cells was maintained following nanoparticle labeling. An in vitro phantom imaging experiment verified that the two cell types could be distinguished and quantified using photoacoustic imaging. The stem cells were also successfully monitored following intramuscular injection into a hind limb ischemia model, and the increased infiltration of macrophages into the area was quantified over time. Histological analysis of macrophages confirmed the photoacoustic imaging results, and mass spectrometry analysis confirmed that the macrophages had endocytosed gold nanoparticles, and specifically gold nanospheres. These results represent important advancements in monitoring stem cells for therapeutic purposes and distinguishing the delivered cells from infiltrating immune cells, which also have important roles in the wound healing response.
Acknowledgements
The TEM images were acquired at the Microscopy and Imaging Facility of the Institute for Cellular and Molecular Biology at the University of Texas at Austin. The ICP-MS data was acquired at the Mass Spectrometry Facility in the Department of Chemistry at the University of Texas at Austin and at the Quadrupole ICP-MS lab in the Jackson School of Geosciences at the University of Texas at Austin. The FACS samples were run at the Microscopy and Imaging Facility of the Institute for Cellular and Molecular Biology at the University of Texas at Austin. This work was supported in part by a National Science Foundation Graduate Research Fellowship awarded to Laura M. Ricles and by NIH under grant EB015007.
Notes and references
- 1.Copland IB. Mesenchymal stromal cells for cardiovascular disease. J Cardiovasc Dis Res. 2011;2:3–13. doi: 10.4103/0975-3583.78581. [DOI] [PMC free article] [PubMed] [Google Scholar]
- 2.Taghavi S, Duran JM, George JC. Stem cell therapy for peripheral arterial disease: a review of clinical trials. Stem Cell Studies. 2011;1:105–14. [Google Scholar]
- 3.Cao F, Lin S, Xie X, Ray P, Patel M, Zhang X, et al. In vivo visualization of embryonic stem cell survival, proliferation, and migration after cardiac delivery. Circulation. 2006;113:1005–14. doi: 10.1161/CIRCULATIONAHA.105.588954. [DOI] [PMC free article] [PubMed] [Google Scholar]
- 4.Li Z, Suzuki Y, Huang M, Cao F, Xie X, Connolly AJ, et al. Comparison of reporter gene and iron particle labeling for tracking fate of human embryonic stem cells and differentiated endothelial cells in living subjects. Stem Cells. 2008;26:864–73. doi: 10.1634/stemcells.2007-0843. [DOI] [PMC free article] [PubMed] [Google Scholar]
- 5.van Laake LW, Passier R, Monshouwer-Kloots J, Verkleij AJ, Lips DJ, Freund C, et al. Human embryonic stem cell-derived cardiomyocytes survive and mature in the mouse heart and transiently improve function after myocardial infarction. Stem Cell Res. 2007;1:9–24. doi: 10.1016/j.scr.2007.06.001. [DOI] [PubMed] [Google Scholar]
- 6.Barbash IM, Chouraqui P, Baron J, Feinberg MS, Etzion S, Tessone A, et al. Systemic delivery of bone marrow-derived mesenchymal stem cells to the infarcted myocardium -Feasibility, cell migration, and body distribution. Circulation. 2003;108:863–8. doi: 10.1161/01.CIR.0000084828.50310.6A. [DOI] [PubMed] [Google Scholar]
- 7.Hofmann M, Wollert KC, Meyer GP, Menke A, Arseniev L, Hertenstein B, et al. Monitoring of bone marrow cell homing into the infarcted human myocardium. Circulation. 2005;111:2198–202. doi: 10.1161/01.CIR.0000163546.27639.AA. [DOI] [PubMed] [Google Scholar]
- 8.Kraitchman DL, Tatsumi M, Gilson WD, Ishimori T, Kedziorek D, Walczak P, et al. Dynamic imaging of allogeneic mesenchymal stem cells trafficking to myocardial infarction. Circulation. 2005;112:1451–61. doi: 10.1161/CIRCULATIONAHA.105.537480. [DOI] [PMC free article] [PubMed] [Google Scholar]
- 9.Daldrup-Link HE, Rudelius M, Metz S, Piontek G, Pichler B, Settles M, et al. Cell tracking with gadophrin-2: a bifunctional contrast agent for MR imaging, optical imaging, and fluorescence microscopy. Eur J Nucl Med Mol Imaging. 2004;31:1312–21. doi: 10.1007/s00259-004-1484-2. [DOI] [PubMed] [Google Scholar]
- 10.Xiong T, Zhang Z, Liu BF, Zeng S, Chen Y, Chu J, et al. In vivo optical imaging of human adenoid cystic carcinoma cell metastasis. Oral Oncol. 2005;41:709–15. doi: 10.1016/j.oraloncology.2005.03.012. [DOI] [PubMed] [Google Scholar]
- 11.Kawada H, Fujita J, Kinjo K, Matsuzaki Y, Tsuma M, Miyatake H, et al. Nonhematopoietic mesenchymal stem cells can be mobilized and differentiate into cardiomyocytes after myocardial infarction. Blood. 2004;104:3581–7. doi: 10.1182/blood-2004-04-1488. [DOI] [PubMed] [Google Scholar]
- 12.Ricles LM, Nam SY, Sokolov K, Emelianov SY, Suggs LJ. Function of mesenchymal stem cells following loading of gold nanotracers. Int J Nanomedicine. 2011;6:407–16. doi: 10.2147/IJN.S16354. [DOI] [PMC free article] [PubMed] [Google Scholar]
- 13.Guzman R, Uchida N, Bliss TM, He D, Christopherson KK, Stellwagen D, et al. Long-term monitoring of transplanted human neural stem cells in developmental and pathological contexts with MRI. Proc Natl Acad Sci U S A. 2007;104:10211–6. doi: 10.1073/pnas.0608519104. [DOI] [PMC free article] [PubMed] [Google Scholar]
- 14.Lin S, Xie X, Patel MR, Yang YH, Li Z, Cao F, et al. Quantum dot imaging for embryonic stem cells. BMC Biotechnol. 2007;7:67. doi: 10.1186/1472-6750-7-67. [DOI] [PMC free article] [PubMed] [Google Scholar]
- 15.Chung E, Ricles LM, Stowers RS, Nam SY, Emelianov SY, Suggs LJ. Multifunctional nanoscale strategies for enhancing and monitoring blood vessel regeneration. Nano Today. 2012;7:514–31. doi: 10.1016/j.nantod.2012.10.007. [DOI] [PMC free article] [PubMed] [Google Scholar]
- 16.Chithrani BD, Chan WC. Elucidating the mechanism of cellular uptake and removal of protein-coated gold nanoparticles of different sizes and shapes. Nano Lett. 2007;7:1542–50. doi: 10.1021/nl070363y. [DOI] [PubMed] [Google Scholar]
- 17.Chithrani BD, Ghazani AA, Chan WC. Determining the size and shape dependence of gold nanoparticle uptake into mammalian cells. Nano Lett. 2006;6:662–8. doi: 10.1021/nl052396o. [DOI] [PubMed] [Google Scholar]
- 18.Kubinova S, Sykova E. Nanotechnologies in regenerative medicine. Minim Invasive Ther Allied Technol. 2010;19:144–56. doi: 10.3109/13645706.2010.481398. [DOI] [PubMed] [Google Scholar]
- 19.Lu CW, Hung Y, Hsiao JK, Yao M, Chung TH, Lin YS, et al. Bifunctional magnetic silica nanoparticles for highly efficient human stem cell labeling. Nano Lett. 2007;7:149–54. doi: 10.1021/nl0624263. [DOI] [PubMed] [Google Scholar]
- 20.Nam SY, Ricles LM, Suggs LJ, Emelianov SY. In vivo ultrasound and photoacoustic monitoring of mesenchymal stem cells labeled with gold nanotracers. PLoS One. 2012;7:e37267. doi: 10.1371/journal.pone.0037267. [DOI] [PMC free article] [PubMed] [Google Scholar]
- 21.Amsalem Y, Mardor Y, Feinberg MS, Landa N, Miller L, Daniels D, et al. Iron-oxide labeling and outcome of transplanted mesenchymal stem cells in the infarcted myocardium. Circulation. 2007;116:I38–45. doi: 10.1161/CIRCULATIONAHA.106.680231. [DOI] [PubMed] [Google Scholar]
- 22.Dupont KM, Sharma K, Stevens HY, Boerckel JD, Garcia AJ, Guldberg RE. Human stem cell delivery for treatment of large segmental bone defects. Proc Natl Acad Sci U S A. 2010;107:3305–10. doi: 10.1073/pnas.0905444107. [DOI] [PMC free article] [PubMed] [Google Scholar]
- 23.Sunderkotter C, Steinbrink K, Goebeler M, Bhardwaj R, Sorg C. Macrophages and angiogenesis. J Leukoc Biol. 1994;55:410–22. doi: 10.1002/jlb.55.3.410. [DOI] [PubMed] [Google Scholar]
- 24.Chazaud B, Brigitte M, Yacoub-Youssef H, Arnold L, Gherardi R, Sonnet C, et al. Dual and beneficial roles of macrophages during skeletal muscle regeneration. Exerc Sport Sci Rev. 2009;37:18–22. doi: 10.1097/JES.0b013e318190ebdb. [DOI] [PubMed] [Google Scholar]
- 25.Mahdavian Delavary B, van der Veer WM, van Egmond M, Niessen FB, Beelen RH. Macrophages in skin injury and repair. Immunobiology. 2011;216:753–62. doi: 10.1016/j.imbio.2011.01.001. [DOI] [PubMed] [Google Scholar]
- 26.Wynn TA, Chawla A, Pollard JW. Macrophage biology in development, homeostasis and disease. Nature. 2013;496:445–55. doi: 10.1038/nature12034. [DOI] [PMC free article] [PubMed] [Google Scholar]
- 27.Kim J, Hematti P. Mesenchymal stem cell-educated macrophages: a novel type of alternatively activated macrophages. Exp Hematol. 2009;37:1445–53. doi: 10.1016/j.exphem.2009.09.004. [DOI] [PMC free article] [PubMed] [Google Scholar]
- 28.Anton K, Banerjee D, Glod J. Macrophage-associated mesenchymal stem cells assume an activated, migratory, pro-inflammatory phenotype with increased IL-6 and CXCL10 secretion. PLoS One. 2012;7:e35036. doi: 10.1371/journal.pone.0035036. [DOI] [PMC free article] [PubMed] [Google Scholar]
- 29.Chen L, Tredget EE, Wu PY, Wu Y. Paracrine factors of mesenchymal stem cells recruit macrophages and endothelial lineage cells and enhance wound healing. PLoS One. 2008;3:e1886. doi: 10.1371/journal.pone.0001886. [DOI] [PMC free article] [PubMed] [Google Scholar]
- 30.Chung E, Nam SY, Ricles LM, Emelianov SY, Suggs LJ. Evaluation of gold nanotracers to track adipose-derived stem cells in a PEGylated fibrin gel for dermal tissue engineering applications. Int J Nanomedicine. 2013;8:325–36. doi: 10.2147/IJN.S36711. [DOI] [PMC free article] [PubMed] [Google Scholar]
- 31.Alkilany AM, Murphy CJ. Toxicity and cellular uptake of gold nanoparticles: what we have learned so far? J Nanopart Res. 2010;12:2313–33. doi: 10.1007/s11051-010-9911-8. [DOI] [PMC free article] [PubMed] [Google Scholar]
- 32.Jain PK, El-Sayed MA. Plasmonic coupling in noble metal nanostructures. Chem Phys Lett. 2010;487:153–64. [Google Scholar]
- 33.Hore MJA, Composto RJ. Nanorod Self-Assembly for Tuning Optical Absorption. ACS Nano. 2010;4:6941–9. doi: 10.1021/nn101725j. [DOI] [PubMed] [Google Scholar]
- 34.Mallidi S, Larson T, Tam J, Joshi PP, Karpiouk A, Sokolov K, et al. Multiwavelength photoacoustic imaging and plasmon resonance coupling of gold nanoparticles for selective detection of cancer. Nano Lett. 2009;9:2825–31. doi: 10.1021/nl802929u. [DOI] [PMC free article] [PubMed] [Google Scholar]
- 35.Zhang G, Drinnan CT, Geuss LR, Suggs LJ. Vascular differentiation of bone marrow stem cells is directed by a tunable three-dimensional matrix. Acta Biomater. 2010;6:3395–403. doi: 10.1016/j.actbio.2010.03.019. [DOI] [PubMed] [Google Scholar]
- 36.Jana NR, Gearheart L, Murphy CJ. Seed-mediated growth approach for shape-controlled synthesis of spheroidal and rod-like gold nanoparticles using a surfactant template. Adv Mater. 2001;13:1389–93. [Google Scholar]
- 37.Nikoobakht B, El-Sayed MA. Preparation and growth mechanism of gold nanorods (NRs) using seed-mediated growth method. Chem Mater. 2003;15:1957–62. [Google Scholar]
- 38.Stober W, Fink A, Bohn E. Controlled Growth of Monodisperse Silica Spheres in Micron Size Range. J Colloid Interf Sci. 1968;26:62. [Google Scholar]
- 39.Lu Y, Yin YD, Mayers BT, Xia YN. Modifying the surface properties of superparamagnetic iron oxide nanoparticles through a solgel approach. Nano Lett. 2002;2:183–6. [Google Scholar]
- 40.Chen YS, Frey W, Kim S, Homan K, Kruizinga P, Sokolov K, et al. Enhanced thermal stability of silica-coated gold nanorods for photoacoustic imaging and image-guided therapy. Opt Express. 2010;18:8867–78. doi: 10.1364/OE.18.008867. [DOI] [PMC free article] [PubMed] [Google Scholar]
- 41.Arnida, Janat-Amsbury MM, Ray A, Peterson CM, Ghandehari H. Geometry and surface characteristics of gold nanoparticles influence their biodistribution and uptake by macrophages. Eur J Pharm Biopharm. 2011;77:417–23. doi: 10.1016/j.ejpb.2010.11.010. [DOI] [PMC free article] [PubMed] [Google Scholar]
- 42.Albukhaty S, Naderi-Manesh H, Tiraihi T. In vitro labeling of neural stem cells with poly-L-lysine coated super paramagnetic nanoparticles for green fluorescent protein transfection. Iran Biomed J. 2013;17:71–6. doi: 10.6091/ibj.1114.2013. [DOI] [PMC free article] [PubMed] [Google Scholar]
- 43.Nayerossadat N, Maedeh T, Ali PA. Viral and nonviral delivery systems for gene delivery. Adv Biomed Res. 2012;1:27. doi: 10.4103/2277-9175.98152. [DOI] [PMC free article] [PubMed] [Google Scholar]
- 44.Horak D, Babic M, Jendelova P, Herynek V, Trchova M, Likavcanova K, et al. Effect of different magnetic nanoparticle coatings on the efficiency of stem cell labeling. J Magn Magn Mater. 2009;321:1539–47. [Google Scholar]
- 45.Mallidi S, Larson T, Aaron J, Sokolov K, Emelianov S. Molecular specific optoacoustic imaging with plasmonic nanoparticles. Opt Express. 2007;15:6583–8. doi: 10.1364/oe.15.006583. [DOI] [PubMed] [Google Scholar]
- 46.Wang B, Yantsen E, Larson T, Karpiouk AB, Sethuraman S, Su JL, et al. Plasmonic intravascular photoacoustic imaging for detection of macrophages in atherosclerotic plaques. Nano Lett. 2009;9:2212–7. doi: 10.1021/nl801852e. [DOI] [PubMed] [Google Scholar]
- 47.Larson TA, Joshi PP, Sokolov K. Preventing protein adsorption and macrophage uptake of gold nanoparticles via a hydrophobic shield. ACS Nano. 2012;6:9182–90. doi: 10.1021/nn3035155. [DOI] [PMC free article] [PubMed] [Google Scholar]
- 48.Walkey CD, Olsen JB, Guo H, Emili A, Chan WC. Nanoparticle size and surface chemistry determine serum protein adsorption and macrophage uptake. J Am Chem Soc. 2012;134:2139–47. doi: 10.1021/ja2084338. [DOI] [PubMed] [Google Scholar]
- 49.Alkilany AM, Nagaria PK, Hexel CR, Shaw TJ, Murphy CJ, Wyatt MD. Cellular Uptake and Cytotoxicity of Gold Nanorods: Molecular Origin of Cytotoxicity and Surface Effects. Small. 2009;5:701–8. doi: 10.1002/smll.200801546. [DOI] [PubMed] [Google Scholar]
- 50.Niidome T, Yamagata M, Okamoto Y, Akiyama Y, Takahashi H, Kawano T, et al. PEG-modified gold nanorods with a stealth character for in vivo applications. J Control Release. 2006;114:343–7. doi: 10.1016/j.jconrel.2006.06.017. [DOI] [PubMed] [Google Scholar]
- 51.Arnold L, Henry A, Poron F, Baba-Amer Y, van Rooijen N, Plonquet A, et al. Inflammatory monocytes recruited after skeletal muscle injury switch into antiinflammatory macrophages to support myogenesis. J Exp Med. 2007;204:1057–69. doi: 10.1084/jem.20070075. [DOI] [PMC free article] [PubMed] [Google Scholar]
- 52.Novak ML, Koh TJ. Phenotypic transitions of macrophages orchestrate tissue repair. Am J Pathol. 2013;183:1352–63. doi: 10.1016/j.ajpath.2013.06.034. [DOI] [PMC free article] [PubMed] [Google Scholar]
- 53.Chen LW, Tredget EE, Wu PYG, Wu YJ. Paracrine Factors of Mesenchymal Stem Cells Recruit Macrophages and Endothelial Lineage Cells and Enhance Wound Healing. PLoS One. 2008:3. doi: 10.1371/journal.pone.0001886. [DOI] [PMC free article] [PubMed] [Google Scholar]
- 54.Kim J, Hematti P. Mesenchymal stem cell-educated macrophages: A novel type of alternatively activated macrophages. Exp Hematol. 2009;37:1445–53. doi: 10.1016/j.exphem.2009.09.004. [DOI] [PMC free article] [PubMed] [Google Scholar]
- 55.Hu XY, Yu SP, Fraser JL, Lu ZY, Ogle ME, Wang JA, et al. Transplantation of hypoxia-preconditioned mesenchymal stem cells improves infarcted heart function via enhanced survival of implanted cells and angiogenesis. J Thorac Cardiov Sur. 2008;135:799–808. doi: 10.1016/j.jtcvs.2007.07.071. [DOI] [PubMed] [Google Scholar]
- 56.Nucera S, Biziato D, De Palma M. The interplay between macrophages and angiogenesis in development, tissue injury and regeneration. Int J Dev Biol. 2011;55:495–503. doi: 10.1387/ijdb.103227sn. [DOI] [PubMed] [Google Scholar]
- 57.Toma C, Pittenger MF, Cahill KS, Byrne BJ, Kessler PD. Human mesenchymal stem cells differentiate to a cardiomyocyte phenotype in the adult murine heart. Circulation. 2002;105:93–8. doi: 10.1161/hc0102.101442. [DOI] [PubMed] [Google Scholar]
- 58.Zhang M, Methot D, Poppa V, Fujio Y, Walsh K, Murry CE. Cardiomyocyte grafting for cardiac repair: Graft cell death and anti-death strategies. J Mol Cell Cardiol. 2001;33:907–21. doi: 10.1006/jmcc.2001.1367. [DOI] [PubMed] [Google Scholar]