Abstract
The transport sector is the largest source of NOx and CO emissions, and among the largest sources of PM2.5 and VOCs. As a result of EPA’s new near-road monitoring requirements, high-quality measurements of ambient NO2, CO, and PM2.5 concentrations will be available from more than 120 sites adjacent to major roads in over 100 cities nationwide in the next few years. This article discusses how data from the new network will provide opportunities to further develop, calibrate, and verify exposure assessment methods and models.
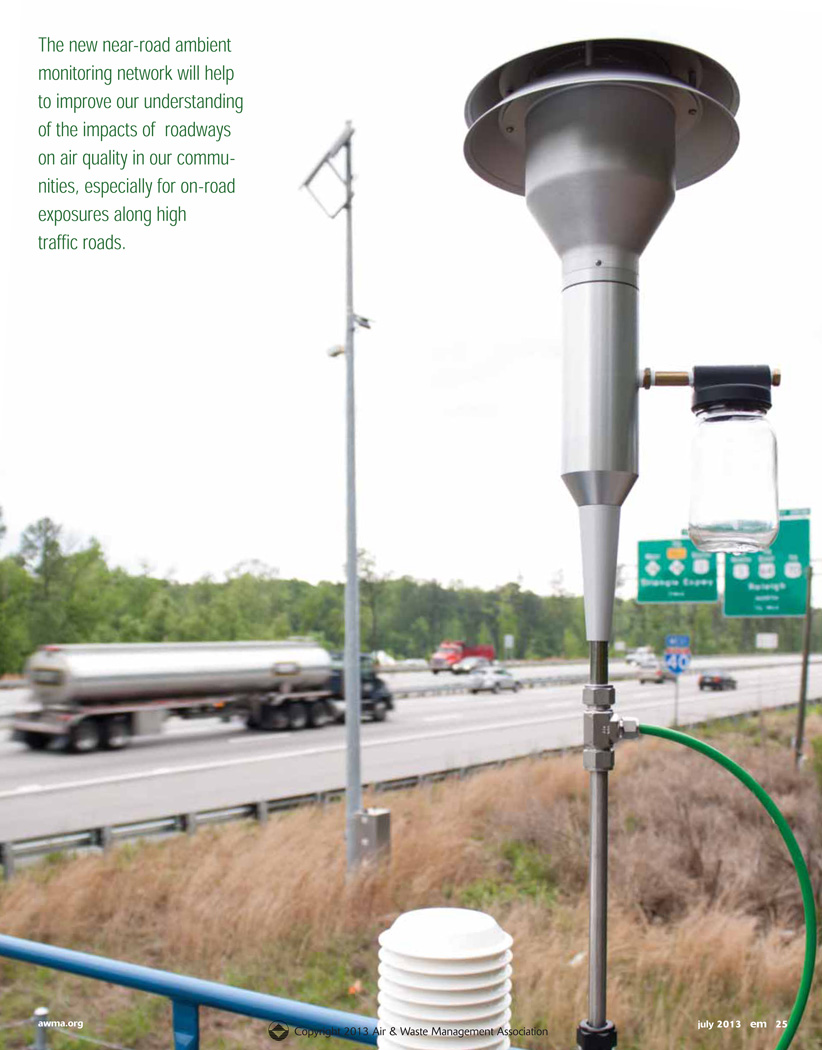
Near-Road Ambient Monitoring
While improvements in fuels, engines, and emission control systems have significantly reduced vehicle exhaust emissions, the transport sector remains the largest emitter of nitrogen oxides (NOx) and carbon monoxide (CO) in the United States and elsewhere, and mobile sources are major sources of other pollutants, including fine particulate matter (PM2.5) and volatile organic compounds (VOCs).1,2 These emissions are released at or near ground level and mostly in urban areas. Understanding the concentrations that result from traffic-related emissions is increasingly important for exposure, risk, epidemiologic, health impact assessment, and accountability studies conducted at project-level, intra-urban, multicity, and national scales.3–8
The U.S. Environmental Protection Agency’s (EPA) new near-road ambient monitoring requirements will yield new data regarding concentrations of traffic-related air pollutants. As described by Weinstock et al. elsewhere in this issue of EM, near-road monitoring of NO2 is being required in larger metropolitan areas to support the revised National Ambient Air Quality Standard (NAAQS).9 These areas include the Core Based Statistical Areas (CBSAs) with populations over 500,000, which include about 102 cities. The smallest of these is the Portland/South Portland, Oregon CBSA (2012 population of 518,00010); the largest is the New York/Newark/Jersey City CBSA (population of 19,832,000). Of these areas, the (approximately) 50 with populations exceeding one million also will require near-road monitoring of CO and PM2.5; these start with the Grand Rapids/Wyoming CBSA in western Michigan. A second near-road monitor will be required in about 21 of the largest CBSAs with populations over 2,500,000 or those that have roadway segments with traffic volumes exceeding 250,000 vehicles per day (AADT); these start with the Denver/Aurora/Lakewood CBSA (population 2,645,000). EPA also encourages states to measure other pollutants, meteorology and traffic volume.9
The new monitoring requirements mean that high-quality and continuous (hourly) ambient monitoring data from more than 120 sites in over 100 cities nationwide will start streaming in the next few years. This article suggests ways to use these data that go beyond the compliance and policy activities related to the NO2 NAAQS, focusing on exposure assessment.
Importance of Traffic-Related Pollutant Exposure
Exposure to traffic-related air pollutants has been associated with adverse health effects that include exacerbation of asthma, asthma onset, impaired lung function, cardiovascular morbidity and mortality, adverse birth outcomes, and cognitive declines, although the epidemiologic and toxicologic evidence currently is considered sufficient to support causality for only some of the respiratory outcomes.5,11,12
While the number of scientific investigations on traffic-related air pollutants is increasing, data for exposure assessment purposes are still not abundant; the data gap in developing countries is particularly large.13 Thus, there is a clear need for methods and data to better assess air pollution exposures from traffic sources, and to reduce the spatial and temporal errors in exposure estimates for subjects in epidemiologic and other studies.14–16 As described below, data from the near-road network will be used for these and other purposes.
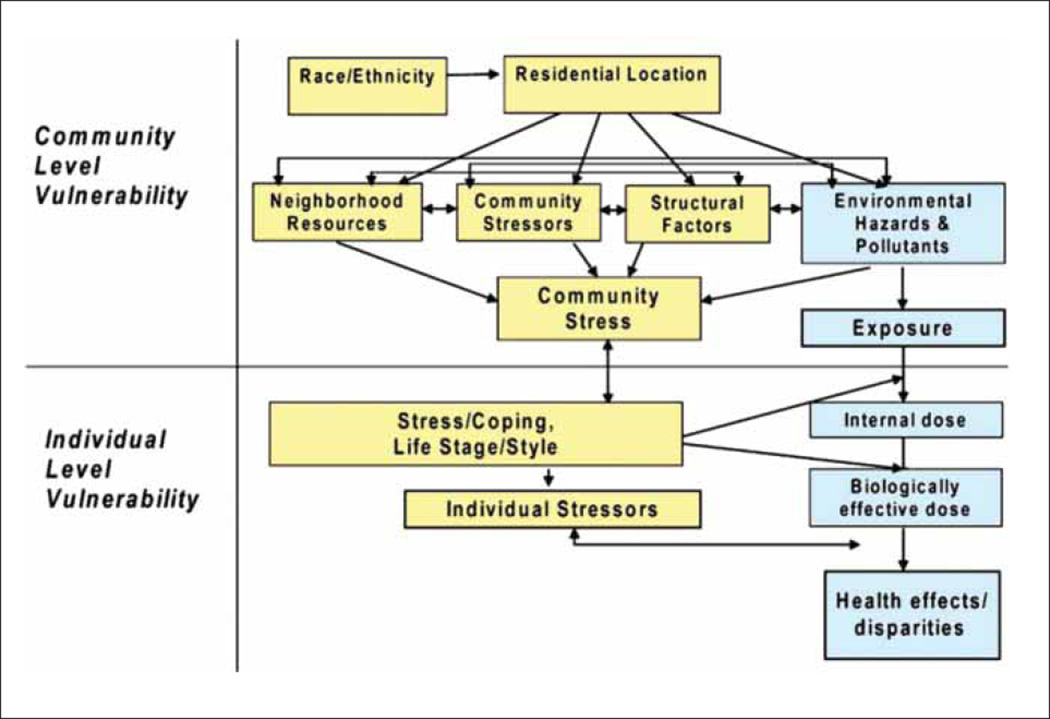
An individual’s exposure to air pollutants can be defined as the time-integrated product of concentration and breathing rate, while exposure assessment is a description of the nature and size of populations exposed to a substance and the magnitude and duration of the exposure,17 expressed more succinctly as the “who,” “how much,” “how long,” “what,” and “where” questions.16 Health impacts are estimating by combining exposure and toxicity information. Health outcomes and cumulative risks depend on many community and individual level factors, as illustrated in Figure 1.11
Figure 1.
Exposure-disease-stress model for cumulative risks from multiple stressors, taken from the Integrated Science Assessment for NO2.11
It is particularly important to focus on vulnerable groups and communities that are susceptible to adverse health impacts due to personal, environmental, and socio-economic determinants. For air pollutants in general, these include age (i.e., young, old), (low) socio-economic position, and preexisting disease (e.g., cardiovascular and respiratory).11 For traffic-related air pollutants in particular, a key exposure determinant is the proximity of emission sources to frequented locations (e.g., residences, workplaces, schools, playgrounds), a result of historical and current land-use patterns (e.g., street layout, urban development, and traffic patterns).18,19 Because many or most residents in high-traffic areas are non-White and low income,20 people exposed to traffic-related air pollutants represent a vulnerable group.
Near-Road Monitoring and Exposure Assessment
The requirements for selecting near-road monitoring sites have been designed to detect peak (1-hour) NO2 levels. According to EPA, the near-road monitors are to be located within 50 m, and ideally within 20 m of the nearest high traffic lane. State and local agencies can consider “population exposure and/or likeness to other road segments throughout the CBSA” in siting decisions,9 suggesting that sites might be selected to give more representative measurements.
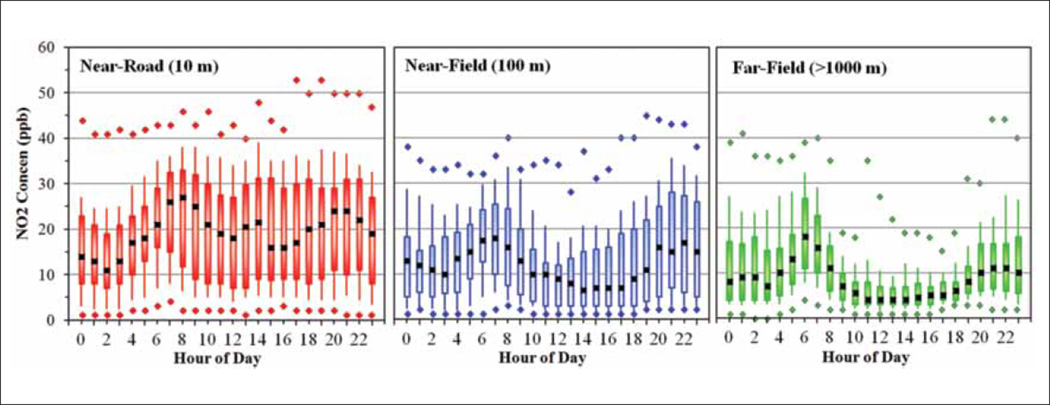
Data provided by the near-road monitoring network will be helpful for understanding pollutant exposure. However, the near-road network is not designed to yield data on population exposures to traffic-related air pollutants, specifically, the exposures that apply to many individuals over broad regions, much less the exposures experienced by vulnerable groups. Generally, the same types of limitations apply to data provided by central ambient monitoring sites, which often fail to fully capture local-scale pollutant variability due to their limited number and siting criteria.3,21 Exposure to traffic-related air pollutants occurs in on-road, near-field and far-field micro-environments. Figure 2 depicts recent NO2 data in these three microenvironments from Detroit, MI, showing hour-to-hour, day-today, and spatial variability, as discussed next.
Figure 2.
NO2 concentrations by time-of-day for spring 2012 (March-May) at near-road, near-field, and far-field sites in Detroit, MI. Based on Michigan Department of Environmental Quality data collected at Eliza Howell 1 and 2, and East 7 Mile sites. The first two sites are 10 and 100 m north of I96, an interstate with an annual average daily traffic (AADT) of about 135,000 vehicles per day and a fleet equivalent AADT of about 180,000. The third site is in a residential neighborhood in Northeast Detroit, downwind from the urban core, and over 3.5 km from freeways. Plots show hourly concentrations for minimum, maximum, 10th, 25th, 50th, 75th, and 90th percentile concentrations.
On-Road Exposure
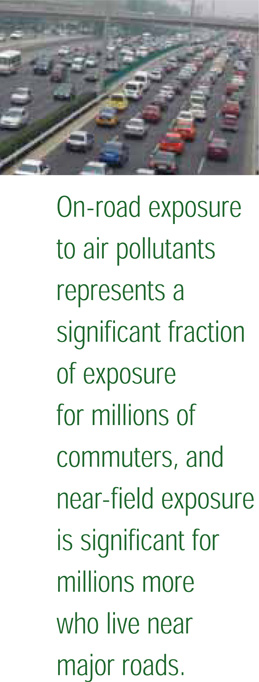
The first microenvironment important for exposure to traffic-related air pollutants is called the on-road environment, applying to commuters, pedestrians, cyclists, and workers such as police, truck drivers, and highway workers. (The term on-road is more encompassing than in-transit or in-cabin.) Individuals traveling and working on high traffic roads during traffic peaks are likely to be the most exposed.
On-road exposure affects individuals in vehicle cabins, which can provide a degree of sheltering and filtration for a portion of PM (but rarely vapors or gases), an area receiving recent attention for the ultrafine PM component of “fresh” vehicle exhaust.22–24 On-road exposure is also important for pedestrians, cyclists, and runners, who may experience considerably elevated exposures due to much higher breathing rates while exercising, as well as the lack of sheltering and filtration.25,26
The 2009 American Community survey27 gives statistics relevant for estimating the number of exposed individuals by transportation mode while commuting: 119 million persons used (private) cars, trucks, and vans; 7 million used public transportation; 4 million walked; and 375,000 bicycled. The average commute duration in 2009 (each way, all modes) was 25 minutes, and nearly twice as long for public transport. There are significant differences by region/city and by race/ethnicity. For example, among White/non-Hispanics, 92% drove alone or carpooled and 3.2% took public transit; among Black/African-American/non-Hispanics, 84% drove or carpooled, and 11.5% used public transit.
Although the duration of on-road exposure is short for most individuals, the higher on-road concentrations can result in a significant fraction of an individual’s total exposure or dose.24,28 In addition, the longer duration of commutes by public transit for non-Whites, and the higher concentrations of PM often found in diesel buses typically used (sometimes due to self-pollution from the vehicle itself), reinforce the need to focus on vulnerable groups.
Will the near-road monitoring network provide information relevant for estimating on-road concentrations and exposure? As discussed by Lurmann et al. elsewhere in this issue of EM, the prevailing meteorology and the few seconds needed to transport tailpipe exhaust emissions to the near-road monitor will affect NOx-O3 chemistry and aerosol processes (e.g., nucleation, condensation, coagulation, evaporation). Thus, along with effects of cabin filtration, some differences between monitoring results and on-road exposures at the same road segment are expected.
More significantly, however, most near-road monitoring sites will be adjacent to very large controlled- or limited-access highways. These locations are not necessarily representative of other locations on the same road or other large roads (e.g., collectors and major arterials) due to differences in traffic level, fleet mix, congestion and stop/start patterns, roadway design (e.g., number of lanes, road grade above/below ground), local structures affecting dispersion (buildings, sound walls), and other factors. Thus, while the near-road network should provide representative (or possibly worst-case for NO2) data relevant for on-road exposures along high traffic roads, it does not represent the diversity of exposure conditions, including those potentially affecting vulnerable groups.
Near-Field Exposure
The second microenvironment, and the one most widely analyzed to date, is the region within several hundred meters of major roads. Many people live, work, go to school, and recreate in this near-field microenvironment. Of all residence units in the United States, approximately 18% fall within 300 feet of a four-lane highway, railroad, or airport; the fraction increases to 22% and 25% for Hispanic and Black households, respectively.29 Ironically, numbers in the near-field group with potentially high exposure to traffic-related pollutants may grow due to trends encouraging transit-oriented development (TOD) and compact urban development, which are higher density and often mixed-use development located near transit facilities. Unfortunately, placement of TODs in (more polluted) transport corridors can increase exposure to traffic-related air pollutants.30,31
Estimating concentrations and exposures of traffic-related air pollutants in the near-road environment involves several challenges. First, concentrations of traffic-related air pollutants show localized gradients, with levels decreasing sharply over a distance of several hundred meters from the road, depending on the pollutant and local conditions (e.g., land/building features and meteorology).5,32 Second, rapid changes in pollutant characteristics, including phase, chemical composition, and particle size occur over the same spatial scale.33
Third, urban areas contain many other emission sources that emit the same pollutants, and there are few if any unique or consistent tracers of traffic-related air pollutants. The comingling of “background” and “regional” contributions from non-road, area, point and distant sources can make intraurban differences small and exposure increments from traffic emissions difficult to distinguish for pollutants such as PM2.5. Fourth, traffic-related emission rates change dramatically over time, with time-of-day, day-of-week, seasonal, and multiyear trends in the rates and composition of emissions. Finally, both ambient monitoring and source modeling networks and datasets (e.g., emission inventories) have not had the spatial or temporal resolution needed to accurately characterize near-field exposures.
Researchers and practitioners have used a variety of creative and non-standard methods to tackle some of these challenges, including proximity assessments, statistical land-use regression models, source-oriented models incorporating mechanistic sub-models (e.g., for emissions, dispersion, transformation, exposure), spatial-temporal models, and hybrid models combining several approaches.5,14,16,18,21,34–36 These methods vary with respect to data requirements and their explanatory/predictive ability. For example, while easy to derive using a geographic information system (GIS), a significant drawback of proximity and traffic intensity measures is the omission of meteorology, vehicle emissions, and time-activity patterns (e.g., time spent away from the location considered). Model validation is a crucial part of the application of any method used to estimate near-field exposure.35,37,38
How will the near-road monitoring network contribute to the challenge of estimating near-field exposures? Data from the network will provide opportunities to further develop, calibrate, and verify the exposure assessment methods discussed above. While the addition of one or two near-road sites to an urban-scale ambient monitoring network represents a limited expansion of a network’s spatial coverage (and is probably more relevant to on-road exposures as discussed earlier), the new data will provide opportunities to quantify concentrations (likely bounded between levels at near-road, population, and regional monitoring sites, as suggested by Figure 2), and should improve the ability to extrapolate and confirm estimates from source-oriented, spatio-temporal, and hybrid models.
Far-Field Exposure
Traffic-related air pollutant exposures also occur in areas relatively distant from both major roads and urban areas, which can be considered the far-field environment. Here, vehicle-related emissions become part of the “urban plume,” where they may participate in the formation of secondary pollutants, most notably O3, but also secondary organic aerosols; other health concerns can include relatively long-lived primary pollutants associated with traffic, such as diesel exhaust PM and benzene. At this scale, data from the near-road monitoring network would not be representative of concentrations or exposures, although temporal patterns will reflect traffic (and meteorological) influences, as shown in Figure 2. Inverse modeling techniques using near-road concentration data and vehicle volumes, ideally measured hourly with vehicle classification data, can be used to estimate (local) emission factors and emission rates, complementing data in mobile source emission inventories39 and improving source-oriented modeling estimates.
Conclusion
Data from the new near-road ambient monitoring network will help improve our understanding of the impacts of major roadways on air quality in our communities. This will, in turn, improve exposure assessments that provide key information in health studies that have associated many adverse health effects with traffic-related air pollutants. The new data will be useful for estimating on- and near-road exposures, and for refining and verifying methods and models used to estimate population exposures, including vulnerable and susceptible groups.
Acknowledgment
The author thanks Susan Wierman, Sara Adar, Veronica Berrocal, Joel Batterman, and Michelle Snyder for their review and encouragement with this article.
References
- 1.European Environment Agency. [accessed March 16, 2013];The contribution of the transport sector to total emissions of the main air pollutants in 2009 (EEA-32) 2013 available online at www.eea.europa.eu/data-and-maps/figures/the-contribution-of-the-transport-1. [Google Scholar]
- 2.U.S. Environmental Protection Agency. [accessed April 16, 2013];National Summary of Nitrogen Oxides Emissions, NEI 2008. 2013 available online at www.epa.gov/cgi-bin/broker?polchoice=NOX&_debug=0&_service=data&_program=dataprog.national_1.sas.
- 3.Hystad P, Setton E, Cervantes A, Poplawski K, Deschenes S, Brauer M, van Donkelaar A, Lamsal L, Martin R, Jerrett M, Demers P. Creating National Air Pollution Models for Population Exposure Assessment in Canada. Environ. Health Perspect. 2011;119(8):1123. doi: 10.1289/ehp.1002976. [DOI] [PMC free article] [PubMed] [Google Scholar]
- 4.Bell ML, Morgenstern RD, Harrington W. Quantifying the human health benefits of air pollution policies: Review of recent studies and new directions in accountability research. Environ. Sci. Pol. 2011;14(4):357–368. [Google Scholar]
- 5.Health Effects Institute. Traffic-related air pollution: A Critical review of the literature on emissions, exposure, and health effect. Boston, MA: HEI; 2010. available online at http://pubs.healtheffects.org/view.php?id=334. [Google Scholar]
- 6.Isakov V, Touma JS, Burke J, Lobdell DT, Palma T, Rosenbaum A, Ozkaynak H. Combining regional- and local-scale air quality models with exposure models for use in environmental health studies. J. Air Waste Manage. Assoc. 2009;59(4):461–472. doi: 10.3155/1047-3289.59.4.461. [DOI] [PubMed] [Google Scholar]
- 7.Lobdell DT, Isakov V, Baxter L, Touma JS, Smuts MB, Ozkaynak H. Feasibility of assessing public health impacts of air pollution reduction programs on a local scale: New Haven case study. Environ. Health Perspect. 2011;119(4):487–493. doi: 10.1289/ehp.1002636. [DOI] [PMC free article] [PubMed] [Google Scholar]
- 8.Molitor J, Jerrett M, Chang CC, Molitor NT, Gauderman J, Berhane K, McConnell R, Lurmann F, Wu J, Winer A, Thomas D. Assessing uncertainty in spatial exposure models for air pollution health effects assessment. Environ. Health Perspect. 2007;115(8):1147–1153. doi: 10.1289/ehp.9849. [DOI] [PMC free article] [PubMed] [Google Scholar]
- 9.U.S. Environmental Protection Agency. Near-road NO2 Monitoring Technical Assistance Document, EPA-454/B-12-002. 2012 available online at www.epa.gov/ttn/amtic/files/nearroad/NearRoadTAD.pdf.
- 10.U.S. Census Bureau. 2013, Annual Estimates of the Population of Metropolitan and Micropolitan Statistical Areas: April 1, 2010 to July 1, 2012. (CBSA-EST2012-01). [Google Scholar]
- 11.U.S. Environmental Protection Agency. Integrated Science Assessment for Oxides of Nitrogen—Health Criteria. Triangle Park, NC: National Center for Environmental Assessment, Office of Research and Development: Research; available online at http://ofmpub.epa.gov/eims/eimscomm.getfile?p_download_id=475020. [Google Scholar]
- 12.Laumbach RJ, Kipen HM. Respiratory health effects of air pollution: update on biomass smoke and traffic pollution. J. Allergy & Clinical Immunol. 2012;129(1):3–11. doi: 10.1016/j.jaci.2011.11.021. quiz 12-3. [DOI] [PMC free article] [PubMed] [Google Scholar]
- 13.Han X, Naeher LP. A review of traffic-related air pollution exposure assessment studies in the developing world. Environ. Int. 2006;32(1):106. doi: 10.1016/j.envint.2005.05.020. [DOI] [PubMed] [Google Scholar]
- 14.Jerrett M, Arain A, Kanaroglou P, Beckerman B, Potoglou D, Sahsuvaroglu T, Morrison J, Giovis C. A review and evaluation of intraurban air pollution exposure models. J. Exp. Anal. Environ. Epidemiol. 2005;15(2):185. doi: 10.1038/sj.jea.7500388. [DOI] [PubMed] [Google Scholar]
- 15.Sheppard L, Burnett RT, Szpiro AA, Kim S-Y, Jerrett M, Pope CA, Brunekreef B. Confounding and exposure measurement error in air pollution epidemiology. Air Qual. Atmos. & Health. 2012;5(2):203. doi: 10.1007/s11869-011-0140-9. [DOI] [PMC free article] [PubMed] [Google Scholar]
- 16.Brauer M. How Much, How Long, What, and Where. Proc. Am. Thoracic Soc. 2010;7(2):111–115. doi: 10.1513/pats.200908-093RM. [DOI] [PubMed] [Google Scholar]
- 17.Lioy PJ. National Research Council. Human exposure assessment for airborne pollutants: advances and opportunities. Washington, DC: National Academy Press; 1991. p. 321. 1991; available online at www.nap.edu/openbook.php?record_id=1544. [Google Scholar]
- 18.Huang Y-L, Batterman S. Residence location as a measure of environmental exposure: a review of air pollution epidemiology studies. J. Exp. Anal. Environ. Epidemiol. 2000;10(1):66. doi: 10.1038/sj.jea.7500074. [DOI] [PubMed] [Google Scholar]
- 19.Wu YC, Batterman SA. Proximity of schools in Detroit, Michigan to automobile and truck traffic. J. Exp. Sci. Environ. Epidemiol. 2006;16(5):457–470. doi: 10.1038/sj.jes.7500484. [DOI] [PubMed] [Google Scholar]
- 20.Tian N, Xue J, Barzyk TM. Evaluating socioeconomic and racial differences in traffic-related metrics in the United States using a GIS approach. J. Exp. Sci. Environ. Epidemiol. 2013;23(2):215. doi: 10.1038/jes.2012.83. [DOI] [PubMed] [Google Scholar]
- 21.Wilson JG, Kingham S, Pearce J, Sturman AP. A review of intraurban variations in particulate air pollution: Implications for epidemiological research. Atmos. Environ. 2005;39(34):6444. [Google Scholar]
- 22.Bigazzi AY, Figliozzi MA. Impacts of freeway traffic conditions on in-vehicle exposure to ultrafine particulate matter. Atmos. Environ. 2012;60:495. [Google Scholar]
- 23.Xu B, Liu S, Liu J, Zhu Y. Effects of Vehicle Cabin Filter Efficiency on Ultrafine Particle Concentration Ratios Measured In-Cabin and On-Roadway. Aero. Sci. Technol. 2011;45(2):234. [Google Scholar]
- 24.Knibbs LD, Cole-Hunter T, Morawska L. A review of commuter exposure to ultrafine particles and its health effects. Atmos. Environ. 2011;45(16):2611. [Google Scholar]
- 25.Zuurbier M, Hoek G, Oldenwening M, Lenters V, Meliefste K, van den Hazel P, Brunekreef B. Commuters’ Exposure to Particulate Matter Air Pollution Is Affected by Mode of Transport, Fuel Type, and Route. Environ. Health Perspect. 2010;118(6):783. doi: 10.1289/ehp.0901622. [DOI] [PMC free article] [PubMed] [Google Scholar]
- 26.Panis LI, Bleux N, Torfs R, Mishra V, de Geus B, Meeusen R, Vandenbulcke G, Thomas I. Exposure of Cyclists to Ultra Fine Particles. Dordrecht: Springer Netherlands; 2010. p. 115. [Google Scholar]
- 27.McKenzie B, Melanie R. Commuting in the United States: 2009, American Community Survey Reports, ACS-15. Washington, DC: U.S. Census Bureau; 2011. [Google Scholar]
- 28.Zhang K, Batterman S. Air pollution and health risks due to vehicle traffic. Sci. Total Environ. 2013;450–451:307. doi: 10.1016/j.scitotenv.2013.01.074. [DOI] [PMC free article] [PubMed] [Google Scholar]
- 29.U.S. Department of Housing and Urban Development and U.S. Department of Commerce. American Housing Survey for the United States: 2009. 2011 available online at www.census.gov/prod/2011pubs/h150-09.pdf.
- 30.Hixson M, Mahmud A, Hu J, Bai S, Niemeier DA, Handy SL, Gao S, Lund JR, Sullivan DC, Kleeman MJ. Influence of regional development policies and clean technology adoption on future air pollution exposure. Atmos. Environ. 2010;44(4):552. [Google Scholar]
- 31.Perez L, Lurmann F, Wilson J, Pastor M, Brandt SJ, Künzli N, McConnell R. Near-roadway pollution and childhood asthma: implications for developing “win-win” compact urban development and clean vehicle strategies. Environ. Health Perspect. 2012;120(11):1619. doi: 10.1289/ehp.1104785. [DOI] [PMC free article] [PubMed] [Google Scholar]
- 32.Karner AA, Eisinger DS, Niemeier DA. Near-roadway air quality: synthesizing the findings from real-world data. Environ. Sci. Technol. 2010;44(14):5334–5344. doi: 10.1021/es100008x. [DOI] [PubMed] [Google Scholar]
- 33.Zhang KM, Wexler AS, Niemeier DA, Zhu YF, Hinds WC, Sioutas C. Evolution of particle number distribution near roadways. Part III: Traffic analysis and on-road size resolved particulate emission factors. Atmos. Environ. 2005;39(22):4155. [Google Scholar]
- 34.Sharma P, Khare M. Modelling of vehicular exhausts—A review. Trans. Res. Part D. 2001;6(3):179. [Google Scholar]
- 35.Hoek G, Beelen R, de Hoogh K, Vienneau D, Gulliver J, Fischer P, Briggs D. A review of land-use regression models to assess spatial variation of outdoor air pollution. Atmos. Environ. 2008;42(33):7561. [Google Scholar]
- 36.Lipfert FW, Wyzga RE. On exposure and response relationships for health effects associated with exposure to vehicular traffic. J. Exp. Sci. Environ. Epidemiol. 2008;18(6):588. doi: 10.1038/jes.2008.4. [DOI] [PubMed] [Google Scholar]
- 37.Colvile RN, Woodfield NK, Carruthers DJ, Fisher BEA, Rickard A, Neville S, Hughes A. Uncertainty in dispersion modelling and urban air quality mapping. Environ. Sci. Pol. 2002;5(3):207–220. [Google Scholar]
- 38.Claggett M, Niemeier D, Eisinger D, Bai S, Chen H. Predicting Near-Road PM2.5 Concentrations. Transportation Research Record: Journal of the Transportation Research Board. 2009;2123(1):26–37. [Google Scholar]
- 39.Zhang KS, Batterman SB. Near-road air pollutant concentrations: A comparison of generalized additive models and CALINE4. Atmos. Environ. 2010;4:1740–1748. [Google Scholar]


