

Abstract
Purpose
Data generated in the care of patients are widely used to support clinical research and quality improvement, which has hastened the development of self-service query tools. User interface design for such tools, execution of query activity, and underlying application architecture have not been widely reported, and existing tools reflect a wide heterogeneity of methods and technical frameworks. We describe the design, application architecture, and use of a self-service model for enterprise data delivery within Duke Medicine.
Methods
Our query platform, the Duke Enterprise Data Unified Content Explorer (DEDUCE), supports enhanced data exploration, cohort identification, and data extraction from our enterprise data warehouse (EDW) using a series of modular environments that interact with a central keystone module, Cohort Manager (CM). A data-driven application architecture is implemented through three components: an application data dictionary, the concept of “smart dimensions”, and dynamically-generated user interfaces.
Results
DEDUCE CM allows flexible hierarchies of EDW queries within a grid-like workspace. A cohort “join” functionality allows switching between filters based on criteria occurring within or across patient encounters. To date, 674 users have been trained and activated in DEDUCE, and logon activity shows a steady increase, with variability between months. A comparison of filter conditions and export criteria shows that these activities have different patterns of usage across subject areas.
Conclusions
Organizations with sophisticated EDWs may find that users benefit from development of advanced query functionality, complimentary to the user interfaces and infrastructure used in other well-published models. Driven by its EDW context, the DEDUCE application architecture was also designed to be responsive to source data and to allow modification through alterations in metadata rather than programming, allowing an agile response to source system changes.
Keywords: Cohort definition, Research query tool, Medical informatics applications, Information systems, Application development, System design and architecture
1. Introduction
Many healthcare organizations have created integrated data repositories to organize and store data generated in the care of patients for secondary analysis [1–3]. Traditionally, these data have been provided to researchers following consultation with database analysts, who translate requirements into structured query language (SQL) queries that return data extracts. However, this method is time-consuming, does not scale easily, and often does not allow clinician researchers or quality improvement personnel to intervene during data exploration in order to match project and research objectives.
A self-service query interface can alleviate these issues, allowing users to access data without first needing to understand the underlying database structure [1–3]. However, such an interface must ensure a consistent environment for data exploration and related activities by users and provide a robust framework for complex query concepts. Despite the importance of this topic, issues surrounding the design of a user-friendly query interface, query path, and underlying application architecture have received scant attention in the literature, likely reflecting the wide heterogeneity of available methods and technical frameworks [4–7].
In this paper, we discuss the design, application architecture, and implementation of Cohort Manager (CM), the keystone module within the Duke Enterprise Data Unified Content Explorer (DEDUCE) self-service data access portal, and its context in the overall application modular design. CM allows subject–area-spanning cohort definition, combination of cohorts from multiple queries, and data extract definition in a Web-based environment. We describe our framework for presenting complex query design options to users, the application architecture supporting this framework, and the product's usage patterns to date.
2. Materials and methods
2.1. Duke Medicine enterprise data warehouse
The Duke Medicine enterprise data warehouse (EDW) stores and interrelates data generated in the care of the approximately 4.3 million patients in our health system, comprised of three hospitals and a wide network of affiliated outpatient primary care and specialty clinics. Retrospective data extend back to 1996. The EDW is a dimensionally modeled, standards-based database organized into multiple high-level subject areas such as demographics, encounters, provider orders, procedures, diagnoses, lab results, medications, vitals, radiology reports, and pathology reports. A series of extract-transform-load (ETL) processes integrate data from source systems to ensure consistency and quality and to minimize redundancy. The EDW is supported by a team of more than 25 staff, and has been described previously [8].
2.2. Rationale for a simple, self-service “Guided Query” tool at Duke Medicine
Individual consultation with data analysts had typically been required for obtaining clinical data extracts for research and quality improvement tasks at our organization, but the number of requests exceeded available resources, and wait times for service increased. To address this issue and support a sustainable mechanism to facilitate access to data, we developed a Web-enabled business intelligence environment called DEDUCE Guided Query (GQ), which allows researchers and quality improvement personnel direct access to EDW data. Specifically, DEDUCE GQ allows users to apply filter criteria to one clinical subject area at a time in a wizard-like setting to obtain both aggregate reports and predesigned raw data extracts from the EDW, with protected health information (PHI) available as appropriate [8]. DEDUCE v1.0, with GQ as the centerpiece, was deployed in August 2008 within the Cognos Business Intelligence (BI) platform (version 8.2; IBM, Armonk, NY, USA).
2.3. Development of DEDUCE as a modular design for more sophisticated enterprise data delivery
DEDUCE GQ was intentionally designed to be simple and easy to use; for those reasons, it was not configured to allow user-defined “join” logic. Through feedback from users, we quickly realized that more sophisticated self-service querying functionality was desirable. For example, a researcher may wish to identify all patients with a given chronic disease, such as type 1 diabetes, who have presented to a health-system clinic within the previous month. The user may realize that although this chronic condition is persistent for a patient (as is sex or race), it would not be captured on a patient-based, demographic basis. It would seem logical to use GQ to search for all clinic encounters within the past month and then identify those with appropriate diagnosis codes from the billing context. However, this strategy would miss diabetic patients who might have presented at Duke Medicine, but who did not have the relevant ICD-9-CM code applied during their most recent encounter – a potential scenario if, for example, the patient presented for a lab test or urgent care visit where their diabetes was not pertinent to the care provided. A better approach would be to individually identify two distinct, encounter-based patient cohorts: (a) all patients who had ever had a diagnosis code for type 1 diabetes; and (b) all patients who had presented at a Duke clinic in the past month. Joining these two cohorts to retain only those individuals common to both groups (by applying the Boolean “and” operator) would create the correct dataset and have the effect of using information associated with encounters as “patient-based” query attributes.
To allow for this more sophisticated type of self-service data querying, we reevaluated our overall approach and conceptualized an environment of interconnecting modules that, taken together, comprise the DEDUCE enterprise data delivery framework (Fig. 1).
Fig. 1. The DEDUCE modular design for self-service enterprise data delivery.

The Duke Enterprise Data Unified Content Explorer (DEDUCE) is comprised of a set of modules, each providing a distinct functionality for enterprise data interaction. Cohort Manager (CM) is the keystone module and provides self-service cohort definitions and joining functionality without the need to use structured query language (SQL) on the underlying enterprise data warehouse (EDW). Other DEDUCE modules interact with CM as illustrated above. Key to numbering: 1. A Guided Query (GQ) result set is imported into CM as a new cohort. 2. A given CM cohort is used to launch associated Clinical Text (CT) reports. 3. Patients from a given set of CT reports are imported into CM as a new cohort. 4. A given CM cohort is used to launch geospatial visualization in DEDUCE Geo. 5. Represents future state where patients identified using Geo visualization will be imported into CM as a new cohort. 6. The Chart Review (CR) functionality is used to select a set of patients and import into CM as a new cohort. 7. A given CM cohort is used to launch the CR dialogue and functionality. 8. A given CM cohort is used to launch the Future Appointments Report. 9. A user's patient listing is imported into CM as a new cohort. 10. A given CM cohort is used to launch the Export Manager module.
This modular conception has been the blueprint for subsequent releases of DEDUCE. DEDUCE was extended as a Web-based ASP.NET and C# application beginning with v2.0 in August 2009. This infrastructure, which is complimentary to the Cognos BI platform supporting DEDUCE v1.0, has been the basis for all subsequent module development.
CM was released with DEDUCE v2.0 and is the keystone module that provides cohort definition and data exploration features; it sits at the core of the DEDUCE framework. CM allows the definition of complex datasets by filtering across multiple subject areas, providing query join features, and serving as a hub of activity for other modules. GQ remains as a simple wizard-like module for data exploration, and is extensible to CM via a mechanism allowing a cohort defined within GQ to be loaded into CM. DEDUCE v2.0 also included the Chart Review functionality allowing review of the electronic health record (EHR) from within the DEDUCE application, thus facilitating efficient manual screening of the patient's medical record through the clinician's regular workspace. DEDUCE v3.0 (December 2010) added an application-level project organization to accommodate sharing of cohorts among project team members, as well as Export Manager, an interface that allows users to review, recall, and modify prior extract exports created in the system.
More recent versions of DEDUCE have added new modules with functionality sufficiently distinct to require description in separate, future manuscripts. In brief, DEDUCE Clinical Text (CT; DEDUCE v4.0, September 2011) allows querying and retrieval of radiology reports and pathology reports, with the ability to receive cohorts from CM for further review, as well as to return further-filtered cohorts back to CM for additional refinement and export. Our newest feature, DEDUCE Geo (v4.3, November 2012), allows the visualization of patient data within an interactive mapping application, with the ability to filter and compare the geospatial characteristics of different cohorts, including the relationship to population density.
DEDUCE development follows an agile software development methodology in which regular testing, release, and feedback cycles from users drive system design, thereby providing DEDUCE with community-chosen design elements that ensure utility and longevity. Future DEDUCE modules, which are likely to target genomics data, biospecimen availability, and access to Duke Medicine-based clinical trial databases, will be developed and placed into the DEDUCE framework in such a way that CM continues to act as a point of central interaction.
2.4. Design of the DEDUCE CM query interface
In order to deconvolute the details of a query and the actions involved in creating a patient cohort, we determined that the search method should be presented sequentially and visually. Each progressive step represents an additional SQL step that has the net effect of creating a more complicated query, as described in early work by Nigirin and Kohane [9]. Because CM is the central hub of the DEDUCE modular environment, we emphasized the seamless integration with other modules and ease of user experience in our design.
The CM query interface is designed to guide users to organize their queries in a manner that separates the execution steps for filter criteria that should be restricted to co-occurring within the same patient encounter (e.g., find a lab report generated within a type of inpatient visit by joining encounter identifiers) from the steps required to describe relationships occurring across encounters (e.g., a chronic disease diagnosis). We did this by creating the CM user query interface as a grid where users sequentially add grid lines corresponding to distinct cohorts of patients and their encounters. This approach is supported by a qualitative analysis of the structure of 16 years' worth of research data queries, where queries were seen to be developed in sets, with each new query in a set working off the results of the previous query in a parent–child relationship [10]. There are four options for adding an initial cohort: upload a patient identifier list to create a discrete cohort, add all EDW patients, import a GQ cohort, or import a CT cohort. Applying sequential user-specified filters to a cohort grid line restricts the cohort such that all encounters must meet all filter criteria (i.e., the Boolean “and” operator is applied). Joining cohorts from different grid lines has the effect of finding those patients with the specified join relationship without considering their encounter basis.
Our second major design decision separated the query definition activity in CM (“who do you want to identify for your cohort?”) from the data extraction activity (“what do you want to know about your cohort?”). For example, although race and sex are not typical cohort exclusion criteria, this information is critical for grant applications. This approach helps the user deconstruct their goal into a series of discreet steps and is similar to the process and logic likely to be used by a data analyst in the same situation.
Finally, we ensured that most query steps could be built, and the results of queries saved, without forcing any refresh of data until the user dictated this action. This allows the user to expect the same set of data to persist, even after they discontinue a session, unless they explicitly trigger a re-execution of the query. This decision also improved system efficiency, given both the considerable volume of data that must be filtered to define a specific query, as well as variable system load on shared hardware and network resources within our technology stack.
2.5. Application architecture
In addition to the user interface and modular design, the augmentation of DEDUCE in subsequent releases has incorporated important decisions about application architecture. This context is largely transparent to the user, but is important for system scalability, support of rapid development and deployment, and extensibility.
The data warehousing context behind DEDUCE was a primary driver for the development of these architecture components. The EDW is a consumer of source system data from applications used in the delivery of patient care within Duke Medicine. Because the EDW is the recipient of source system data, and does not directly control the source systems themselves, a primary objective of our work was to create a scalable architecture that is responsive to changes in source system data. The concepts discussed in the following Sections (2.5.1 through 2.5.3) constitute the framework of DEDUCE as a data-driven application.
2.5.1. DEDUCE application data dictionary
The DEDUCE application “data dictionary” is the linchpin of the data-driven application architecture. This set of metadata tables contain the system attributes of every data element available to users within DEDUCE, including the data element's data type, database location, and type of filter/operator that can be applied. The data dictionary serves as a mediator between the DEDUCE application and EDW data structure.
The DEDUCE data dictionary is based on a patient-centric and encounter-basis model. Clinical data are organized into subject areas, such as diagnoses, procedures, and medications. Each subject area must have a logical relationship to the associated patient and/or encounter data. Almost all subject areas are associated with the encounter basis, which represents an important chronological dimension for these data.
Each data element has an access indicator in the data dictionary, defining it as being PHI, a value allowed in a limited dataset, or a value allowed in a de-identified dataset. This property is used to determine whether the data element is available to the user within the context of a given session. For example, if the user is connected to DEDUCE under the role of review preparatory to research, only data elements associated with limited datasets would be available within their session.
Beyond being flexible for when new data elements are added, this structuring allows DEDUCE to be relatively tolerant of changes and expansion of the EDW because database table locations are stored as metadata. New data elements and subject areas are incorporated into the application by entries into the data dictionary and do not necessitate changes to the DEDUCE application programming.
2.5.2. DEDUCE application smart dimensions
The EDW is a dimensionally modeled data warehouse. In broad terms, dimension tables represent the master terminologies, while fact tables contain the corresponding measures. We recognized the opportunity to extend the dimensional concept to an application-specific context, especially to support user exploration of data. Therefore, in addition to the existing infrastructure of dimension tables within the EDW, we implemented a complimentary component within DEDUCE (beginning with v2.1) which we call “smart dimensions.”
Smart dimensions are driven from the DEDUCE data dictionary for every categorical data element. These smart dimension data are stored in a separate application-specific table, which contains the distinct values and counts of associated patient and encounter records. Each night, the smart dimensions are refreshed by automated queries that run against the DEDUCE data dictionary and source data. Smart dimensions are reflective of actual data availability and sources, independent of the data modeling for the EDW itself.
This nightly process allows the user interface to be dynamically constructed in a more efficient manner, since the smart dimension values are already populated, are available to all users, and do not need to be queried at point of interaction. Dimensional values without associated patient or encounter data are not presented to the user. This automated process precludes the need for manual profiling or curation of lists within the application.
2.5.3. Dynamically-generated user interfaces for data exploration
The DEDUCE data-driven application architecture is exposed to the user through the interactive filter dialogues used to explore data and apply data parameters within DEDUCE, primarily within the CM module. Such user interfaces are constructed dynamically at application run-time, rather than being programmed with a static set of options within the application.
When the user triggers a filter action within DEDUCE, the user interface screen is constructed dynamically to display the results. These dynamic user interfaces use a combination of the DEDUCE data dictionary (for the context of the data elements) and the associated smart dimensions (Fig. 2). By default, all filter action interfaces are rendered by dynamic user interfaces, although the application can be programmed to override this behavior.
Fig. 2. Dynamic filter dialogue for lab result panels.
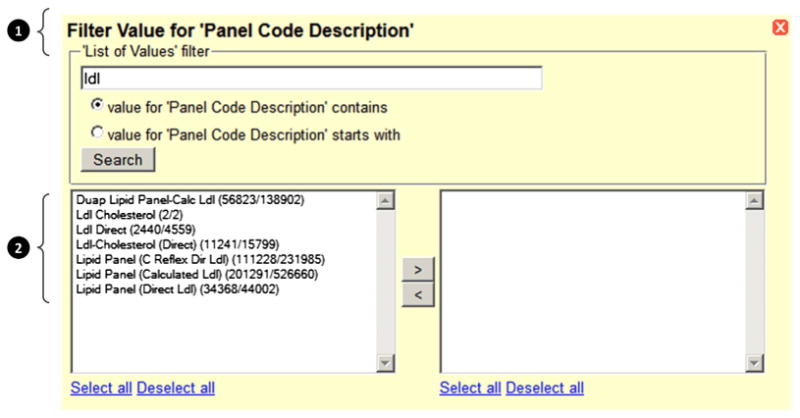
In this example, the filter dialogue has been generated for the data element “Panel Code Description,” and the user has queried on the search string “ldl” (low-density lipoprotein). The results display the matches and also the number of associated records for each result as patient count/encounter count. This filter dialogue is rendered from a combination of the DEDUCE data dictionary (1) and its associated smart dimensions (2).
The patient and encounter counts displayed through the smart dimension allow the user to incorporate data volume and prevalence considerations into their selection without having to drill down to individual results. This context is important in an EDW environment, where naming conventions and distribution of data values within source systems may not be known by the user, and allows more efficient data exploration.
2.6. Access and security
DEDUCE includes a rigorous privacy and security framework that provides only the information that users are authorized to access. DEDUCE has its own active institutional review board (IRB)-approved study protocol that permits it to be used by quality improvement personnel and researchers with appropriate IRB authorization. All DEDUCE developers and data analysts have training in Health Insurance Portability and Accountability Act (HIPAA) regulations with regard to research with human subjects. In all cases, DEDUCE authenticates using Microsoft Windows Server 2003 (Redmond, WA, USA) Active Directory accounts. If an IRB access mode is selected, the user is prompted for the protocol number. Using a connection to the IRB study database, the DEDUCE authentication process validates that the study is active and that the user is included in the protocol. A detailed audit log is maintained of the activity. DEDUCE supports five modes of access (Table 1), an expansion since this model was first described [8] (see Table 2).
Table 1. Modes of DEDUCE access.
| Mode of access | Description |
|---|---|
| Quality and safety operations | Investigators can analyze and integrate EDW data to support research for the purpose of internal quality investigation. Users have full access to PHI. Requires approval of medical director/department chair |
| Review preparatory to research | Investigators can define a cohort based on parameters such as lab values, diagnoses, or demographics. This enables researchers to characterize patient volumes across Duke Medicine and facilitates statistical power calculations. Extracts are limited datasets with no directly identifiable patient information. Requires IRB notification |
| IRB-exempt protocols | Researchers may view and extract de-identified data [11] (which may include dates) to support research. Requires IRB approval |
| IRB-approved protocol with waiver/alteration of consent and HIPAA authorization | Investigators may view and extract PHI data elements for research purposes. Electronic chart review is available in this mode & access to clinical data with PHI is permitted within context of approved protocol. Requires IRB approval |
| Educational purposes | Educators may define a cohort based on specific clinical parameters such as lab values, diagnoses, and demographics and export limited datasets (no direct patient identifiers) to prepare teaching materials. Requires departmental approval |
Abbreviations: DEDUCE, Duke Enterprise Data Unified Content Explorer; EDW, electronic data warehouse; HIPAA, Health Insurance Portability and Accountability Act; IRB, institutional review board; PHI, protected health information.
Table 2.
DEDUCE user characteristics.
| DEDUCE activity between August 1, 2008 and June 30, 2013a | |
|---|---|
| Activated DEDUCE usersb | |
| Cumulative total | 674 users |
| Length of DEDUCE activityc | |
| Mean | 9.9 months |
| Median | 3.8 months |
| Total user logons | |
| Mean | 22 logons |
| Median | 7 logons |
| Max | 820 logons |
| Logons per user per monthd | |
| Mean | 3 logons |
| Median | 2 logons |
| Users with logon activity in each mode of DEDUCE accesse,f | |
| Quality and safety operations | 142 (58.1%) |
| Review preparatory to research | 96 (39.3%) |
| IRB-exempt protocols | 65 (26.6%) |
| IRB-approved protocol with waiver/alteration of consent and HIPAA authorization | 236 (96.7%) |
| Educational purposes | 100 (41.0%) |
Abbreviations: DEDUCE, Duke Enterprise Data Unified Content Explorer; HIPAA, Health Insurance Portability and Accountability Act; IRB, institutional review board.
User activity from members of the DEDUCE development team has been excluded from these results.
Activated users are those that have completed DEDUCE training as indicated by logon activity.
Length of DEDUCE activity is calculated as first logon date minus last logon date.
Logons per user per month are calculated as logons within the number of months where a user had active DEDUCE use. The month denominator is calculated with integers so that user activity is always compared against a full month of activity; any fraction of a month is rounded up to the next greatest integer.
The results reported here do not equal 100% because any given user can have more than one mode of DEDUCE access, depending on their departmental affiliation and involvement with specific research projects.
The audit trail by access mode was deployed as of September 1, 2011.
3. Results
3.1. DEDUCE CM complex query execution use case
Figs. 3–5 illustrate the execution of a complex query within DEDUCE CM. Fig. 3 provides a conceptual representation of the query design for the following use case: Suppose a researcher wishes to find a cohort with specific inclusion criteria (type 2 diabetes; seen at a Duke Medicine facility since February 2009; at least 50 years old at last encounter; glycated hemoglobin [HbA1c] within institutional normal range) and exclusion criteria (history of vascular disease, cirrhosis, or ketoacidosis; or deceased). To filter both within and across encounters, six encounter-based query steps will be defined, executed, and then joined. For inclusion criteria, the user must filter for diabetic patients separately from patients with desired HbA1c values, as the ICD-9-CM diagnosis codes and lab results may be associated with different encounters; the same logic applies to exclusion criteria. Boolean logic can then be used to combine results across encounter-based queries to generate the desired cohort of patients. In Fig. 3, for example, a compound join expression using patient identifiers removes patients meeting exclusion criteria (1.3 or 1.4 or 1.5 or 1.6) from the cohort of patients meeting inclusion criteria (2). When these queries are joined, a total of 671 patients are found.
Fig. 3. Conceptual representation of a complex query design in DEDUCE Cohort Manager.
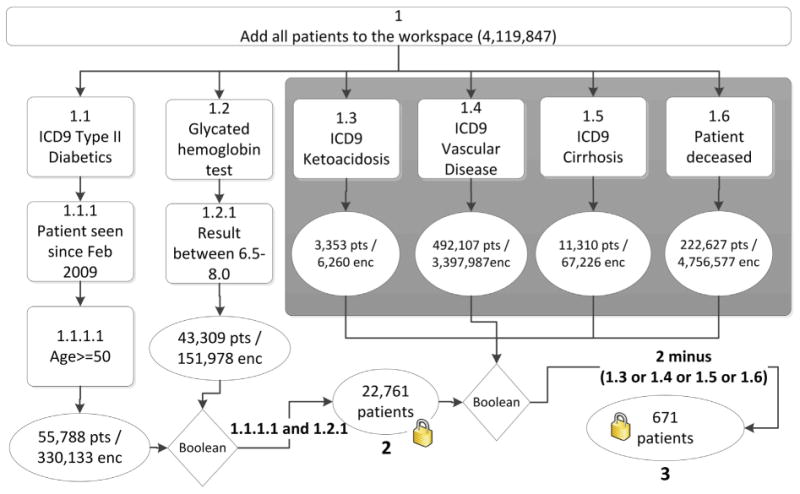
Six queries (1.1 through 1.6) are performed by adding all enterprise data warehouse (EDW) patients to the workspaces and then applying serial filters (boxes) to obtain lists of matching patients and encounters (ovals). Filter criteria that should co-occur within the same care encounter are applied within the same query (e.g., the query branch beginning with 1.1 calls for all patient encounters with an ICD-9-CM diagnosis of type 2 diabetes, an arrival date since February 2009, and an age at encounter of at least 50). Boolean operators are then used to combine results from queries to generate lists of patients meeting all requirements, thus “locking” the cohort to only a patient list without the accompanying encounter details. The final compound Boolean “join” expression finds 671 patients that meet all inclusion (1.1 and 1.2) and exclusion (1.3 through 1.6) criteria. In this figure, “enc” refers to encounters and “pts” refers to patients.
Fig. 5. DEDUCE Cohort Manager (CM) filter definition.
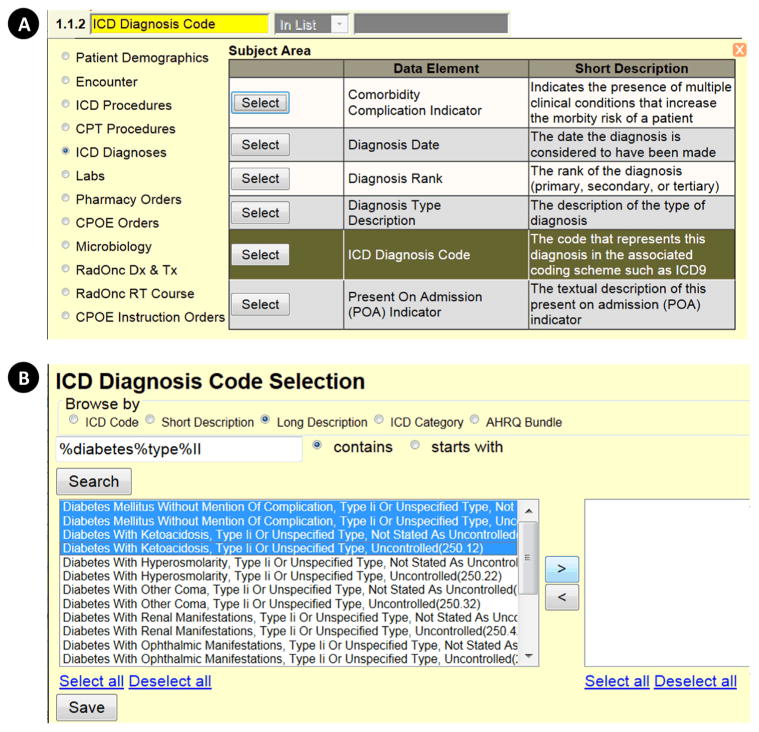
Clicking the funnel button in the CM grid space opens a series of pop-up windows (A and B) that allow the user to build a subject–area-based filter. In the example shown, the user selects the subject area “ICD Diagnoses,” then the data element “ICD Diagnosis Code” (A). A new pop-up window then opens (B) that allows the user to browse the selected data element using various relevant categories or ontologies and apply further criteria before clicking “Search.” In the example shown, the user has opted to browse the “ICD Diagnosis Code” data element by “Long Description,” and has applied the “contains ‘diabetes”’ search term. One or more values can be individually selected, or the user can “Select all.” When the user clicks “Save,” the pop-up windows disappear, and the selections made appear as a filter in the CM grid space.
Fig. 4 illustrates how the same query would be constructed within the DEDUCE CM query interface. At initiation, users are presented with an empty grid-like workspace that facilitates filtering patients hierarchically to create a query “tree.” As filters are applied, each new grid line receives a sequence number (i.e., query branch) for the step taken, a single filter criterion description, and the number of patients and encounters returned by applying that filter. In the use case considered here, the user begins by clicking the “Add ‘All Patients’ Cohort” button (i.e., add all patients in the EDW), but it is also possible to upload patient lists created outside of DEDUCE CM—either offline or from other DEDUCE modules.
Fig. 4. DEDUCE Cohort Manager (CM) query interface.
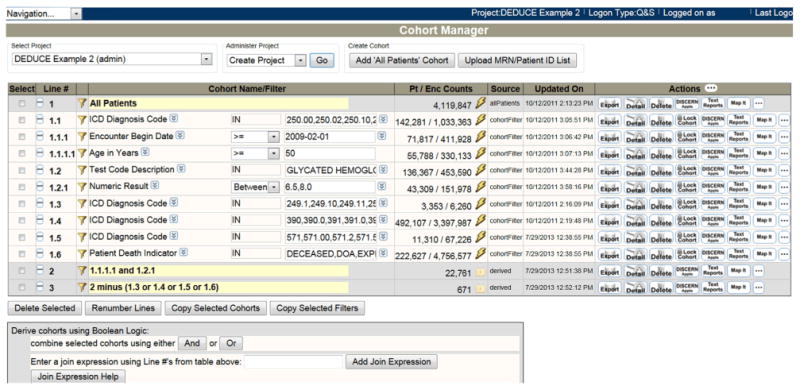
This figure shows the CM interface for executing the complex query outlined in Fig. 3. Adding “All Patients” to the grid space (line 1) allows all enterprise data warehouse (EDW) data to be filtered by clicking the funnel button. Each “tree” hierarchy of filters (e.g., 1.1 > 1.1.1 > 1.1.1.1) represents criteria that apply to the same encounter. The “Pt/Enc Counts” column shows the number of patients and associated encounters that remain after filter application. When encounter-based results are joined using Boolean logic, the underlying associated data are joined by patient key to return only a list of patients, as in line 2, which gives the cohort of patients meeting all inclusion criteria, and in line 3, which gives the final cohort of patients meeting all inclusion/exclusion criteria. Other actions are available in the interface, including “Export” (create a data extract); “Detail” (online chart review), “Delete” (delete the filter line), “Lock Cohort” (remove all encounter-based data to create only a list of patients to appear in a newly generated filter line), and “Add DISCERN” (launch the future appointments report).
Data filters for a given line are created by clicking the “funnel” button adjacent to the line number. This opens a series of pop-up windows that allow the user to define the filter based on subject areas and associated data elements (Fig. 5). Nearly all data elements within a subject area can be used for filtering, including dates, numerical values, and discrete text values. A wide range of operators (e.g., logical operators, in-list, between, in-range) can be applied, as can wildcard symbols.
Once the filter has been defined, the pop-up windows close, and a new gridline is created to hold the “branched” cohort. The filter criteria are applied by clicking the “lightning bolt” button. In Fig. 4, the first branched line (1.1) is created by applying an ICD-9-CM diagnosis filter (Fig. 5) to the “all patients” cohort. The next branched line (1.1.1) is created by applying a second filter describing clinical visit date. Decoupling the definition of filters from their execution by using two different buttons (funnel versus lightning bolt) allows the user to apply additional branched filter criteria while the main query is running. The funnel buttons remain active even after a query has been executed using the lightning bolt, allowing users to create a new branch in the developing query tree without losing prior work. Cohorts are updated upon re-clicking the lightning bolt button, which refreshes the query with the most recent data.
Finally, Fig. 4 illustrates how Boolean logic is used in the DEDUCE CM query interface to combine results to generate the desired final cohort of patients (lines 2 and 3). Although not represented in these examples, users may at any point click the “lock” button (Fig. 4) to create a new cohort of patients by removing the encounter basis and terminating the prior query branch. From this point, new filters would apply to all encounters for patients in that locked cohort.
3.2. DEDUCE Export Manager module and generation of an extract
Once the desired query steps are completed within CM and the user is ready to export data, they click the “Export” button (Fig. 4) to open the export creation window (Fig. 6). The user can build an extract by selecting columns of data from the desired subject areas and can then choose from among three ways to organize the export: (1) separate subject areas, in which there is one file for each subject area, with EDW-generated identifiers to link patients and encounters across different files—a structure that allows for maximal flexibility in the analysis process; (2) partially combined subject areas, in which a different file is created for each subject area, but demographic and encounter data are repeated for all subject area rows; and (3) combined subject areas, in which there is one file containing all possible Cartesian products, which may be useful to those working in advanced statistical programs. As the export is running, a pop-up dialog indicates progress for each step of the export process (e.g. generating intermediate tables; generating SQL for each subject area; running SQL; retrieving rows) as well as the number records found and written to the extracted file. File extraction formats of delimited text, Excel, or SAS format may be selected. When export is complete, a ‘download now’ button appears which allows users to save a compressed file local to their desktop. We do not have a reliable means to test system performance as this is highly dependent upon user load, time of day, and the number of columns chosen for the extract. Anecdotally, retrieving all demographics for 4.1 M patients creates a compressed file for download within 4–12 min mid-day. Users can choose to wait for the extract to download, or have the results sent to their Duke Medicine email address.
Fig. 6. DEDUCE extract export.
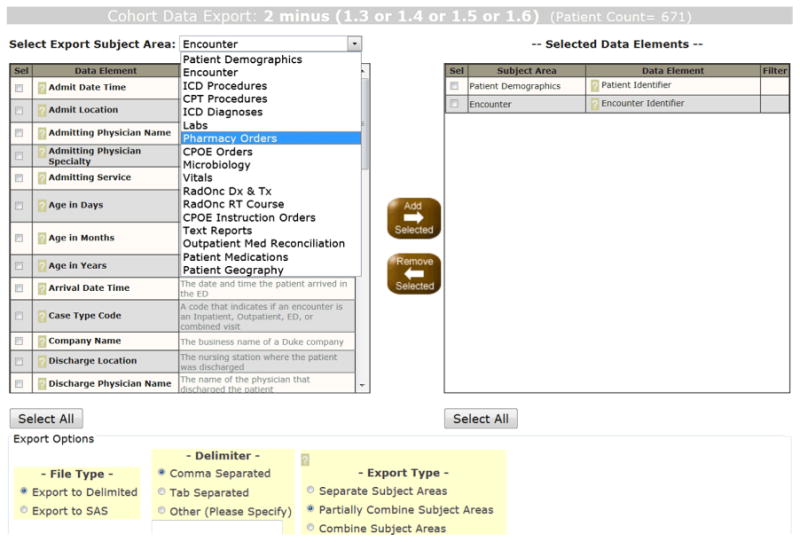
Clicking the “Export” button for any filter line in Fig. 4 brings up the export dialog (shown here), where, for patients in the selected cohort, a wide variety of data elements can be browsed and added to develop a customized extract. To improve usability, definitions are provided for each data element, and selections populate a new pane. Users have additional choices for delimiter, export file structuring, and data delivery mechanism.
Export Manager allows users to review and download all prior data extracts that were created and exported. This allows users to rerun previous exports or tweak parameters, such as adding a filter or adding a data element to a previous retrieved extract. This prevents the user from having to completely rebuild a query to update their data extract. Users are also able to reuse a previously exported extract layout for a new cohort of patients or encounters.
3.3. DEDUCE CM and the management of projects
In order to logically organize cohorts and related activity, facilitate collaboration across study teams, and manage appropriate access permissions, all DEDUCE CM activity takes place within a project context. The project context is an application-specific container where the user can create, delete, and administer project attributes. From a workflow perspective, the user must select a project in order to use CM, and all attributes of their CM activity are associated with only that project.
The project context allows the user to share their CM constructions with other team members within DEDUCE, and to specify each collaborator's level of access to each individual project: administer (full control, including role assignment rights), update (adjust the cohort or query), or read-only (view filter conditions and export data). If the project is associated with a specific IRB protocol, the collaborator must also be logged on and authenticated under the appropriate IRB protocol in order to access the project details.
3.4. Integrated electronic chart review
Electronic chart review facilitated by the Chart Review module is performed through integration with a tool called Clinical Context Object Workgroup (CCOW) [12], which is available on Duke Medicine workstations. CCOW is typically used during patient care to allow clinicians to open different health IT applications in a way such that are synced to the same patient.
In the context of DEDUCE, once users have created a cohort within CM they can click the “Detail” button (Fig. 4) to create a list of medical record numbers linked to the Duke Medicine EHR and allows the user to review the patient attributes directly within the medical record; during this process, the user can also mark patients who should be excluded from the cohort (e.g., because of the presence of a certain social history that makes one ineligible for a study). Once all review is complete, the cohort is placed back within CM on a new cohort gridline to reflect any exclusion decisions made by the investigator.
3.5. DEDUCE usage patterns
In the DEDUCE account management process, users begin with an account setup request, then attend a DEDUCE training session after appropriate access permissions have been confirmed. Attendance is required before the user is permitted to login to the DEDUCE production system. As of June 30, 2013, 1003 user accounts have been established, excluding members of the DEDUCE development team, and 674 users have been fully activated, as indicated by the presence of successful logon activity. We found differing mean and median values within length of activity, total user logons, and logons per user per month. We expect that this pattern can be attributed to multiple reasons, including new users gaining access to the system more recently, but these results also suggest that users may have different patterns of adoption and acceptance; we believe that this is an area that warrants further exploration and evaluation.
As we would expect from the steadily increasing user base, logon activity has grown over time. The logon activity shows variability between months, which we would generally attribute to external drivers such as grant submission cycles and holidays (Fig. 7).
Fig. 7. Monthly logon activity within DEDUCE.

As new users are trained from both the clinical research and quality improvement departments, use of DEDUCE continues to grow at Duke Medicine.
User activity within CM is based around the subject areas, which organize clinical data into high-level domains. By examining the audit of user activity, each filter condition can be can be attributed to its originating subject area. Usage patterns show expected variability between months, along with increased activity over time.
As discussed in Sections 2.4 and 3.2, a major design decision for the CM query interface was to separate the activity of defining and applying filter conditions in CM (“filter execution”) from the activity of defining data extractions (“export execution”). A comparison of filter and export conditions shows that these activities have distinctly different patterns of usage (Fig. 8). For example, data elements within the Patient Demographics subject area are the most commonly exported; however, this subject area ranks fourth for filter execution within CM.
Fig. 8. Comparison of filter and export subject area executions.

The Filter Execution count represents the user action of clicking the “lightning bolt” button in CM to generate or refresh the counts for a given filter condition. The Export Execution count represents the user action of clicking the “Export” button when the subject area is included as part of the export. If multiple data elements within one subject area are included in an Export Execution, the subject area will contain more than one count per execution.
4. Discussion
A central problem in clinical informatics is how best to provide researchers and quality improvement personnel with powerful, flexible, self-service access to the multiple dimensions of patient care data available in an EDW. We have developed and evaluated a portal interface that provides this access while organizing query structures so that users can logically subdivide their questions into (1) what should be filtered within a single encounter versus across encounters, and (2) what data are required for filtering as part of cohort definition versus what data are needed in the extract.
4.1. Other self-service query tool approaches
Recently, various federated query tools have been proposed and implemented to expedite data sharing among organizations [6,13–16]. based on the rationale that only a small subset of items from an EHR is needed to answer a wide variety of research questions, most of which can be addressed without accessing PHI. With these data points defined, organizations can create de-identified data marts. These data marts in turn allow organizations to participate in federated exchange that affords customized access by different user groups while allowing local groups to govern data use and protect patient privacy.
Although the potential of federated models to facilitate research, especially in rare diseases, and support sharing among organizations is undeniable, integrated approaches that leverage the full breadth of a large, centralized EDW are still an attractive and complementary option for many institutions. Federated models require collaborators to agree on common ontologies to serve up data and to align regulatory approval procedures to safeguard privacy. Although this process allows data aggregation across organizations, it becomes unwieldy when one is trying quickly to develop a self-service model for a large EDW like the one we developed at Duke [13]. An organization's local health analytics and research culture, with its attendant preferences for standards, quality program participation, clinical strengths, and research team organization, demands flexibility in ontology selection, which in turn drives data access needs. Finally, for local needs, integrated solutions are better able to serve results at greater speeds when large numbers of data points are involved [17].
When we evaluated our organization's research portal needs, we considered existing query tool platforms [8]. Informatics for integrating biology and the bedside (i2b2) is an open-source, single-site researcher data model and query tool used by more than 60 academic health centers worldwide [18,19]. i2b2 supports secondary use of clinical data for research and trial recruitment and has been expanded with modules that allow distributed queries of i2b2 data repositories residing at other centers [14,15]. We considered i2b2 for collaboration and sharing of selected knowledge domains, but found a number of areas in which the platform, at that time, lacked needed capabilities. When DEDUCE was being developed, i2b2 could not search for and return a series of encounters that met eligibility criteria, which was a fundamental requirement of our tool. Despite repeated attempts to adapt i2b2, our EDW developers eventually concluded that it would be more efficient to build a query tool on top of our established EDW. Also, because we do not rely upon i2b2 releases to provide support for new subject areas, our tool allows us to serve the Duke research community faster and with more agility. Although i2b2 is locally configurable in many ways, choosing to customize i2b2 to Duke's needs would have placed us at risk of being incompatible with future i2b2 upgrades.
Other organizations have developed in-house query tools that provide levels of access similar to those afforded by DEDUCE. Information on such portals has typically been presented in venues outside of the formal literature, making comparisons of feature sets and deployment methodologies difficult. There has also been little discussion of user interfaces to illustrate how a given tool guides users through a complex query process—something that would permit a fuller comparison with DEDUCE.
Stanford University Medical Center has developed an anonymous patient cohort discovery tool (the Stanford Translational Research Integrated Database Environment [STRIDE]) that queries an EDW used by two hospitals and associated clinics [4,20]. STRIDE is a stand-alone Java application featuring a drag-and-drop interface. We infer from the STRIDE website that it can only be used to define cohorts and not collections of clinical observations, and a follow-up data request of the EDW support team is needed to obtain detailed data extracts. Partners Healthcare has published brief reports on its EDW, the Research Patient Data Repository (RPDR), which is designed to aid cohort identification for research studies, support grant applications, and enable outcomes research for two medical centers and four community hospitals [21]. RPDR includes an online query tool to reduce the number of EDW data requests by users; this tool can return aggregate numbers of patients who match a series of filter criteria and extract exports that include PHI when authorized by an IRB protocol. In a 2006 report, RPDR developers estimated the query tool had saved $7 million in recruiting costs and provided critical data for $20.7–$30.7 million in grant funding. Vanderbilt University has created a database originating from EHR data which incorporates systematic processes for de-identification and temporally-consistent obfuscation of dates, the Synthetic Derivative [22]. These data, in association with a large opt-out DNA biobank, support cohort identification and genomic research, particularly associations between genotypes and phenotype presentation [23]. The Synthetic Derivative interrogation Web-based tool allows queries of structured data elements and selection for further review [24].
4.2. Limitations and lessons learned
Our approach has several limitations. Because we use an integrated rather than a federated model for querying data, DEDUCE is not currently configured for query result aggregation and sharing with other organizations within the interface. Although the application architecture is scalable to incorporate new subject areas, data must be related to either a patient or encounter basis in order to be easily incorporated through the existing logical model. Our interface is extensible to other settings that are based in the same patient/encounter paradigm on which the DEDUCE platform is constructed.
Across all subject areas, there is a wide variety of dates available for filtering that could correspond to anything involving a clinical service act, large or small, provided to the patient. As a result, an explicit description of the timestamp semantic definition and significance is crucial for development and support of user querying within DEDUCE CM or any similar tool. Data governance also becomes more complicated as the data become further decoupled from the original source systems and data owners (from an operational IT perspective).
Some usability limitations may constitute barriers for certain users. First, researchers unaccustomed to using sophisticated user interfaces may feel left behind by this tool and at a competitive disadvantage in identifying patients for potential research participation. There is a limited number of “undo” functions, and DEDUCE CM lacks a “drag-and-drop” feel. Due to issues of resources and funding, we have not been able to submit the tool to full usability testing that would formally identify both problems and potential solutions to usability issues in DEDUCE CM.
DEDUCE facilitates exploration, management, and retrieval of data; however, it is not a platform that can be used for the analysis of results. Analytical platforms such as SAS must be provided by the project or institutional infrastructure, as well as the appropriate expertise to analyze the data appropriately and handle in accordance with HIPAA policies. Analysts and statisticians unfamiliar with the EHR data subject areas, particularly the dichotomy of the patient and encounter basis, may unintentionally combine extracts outside of DEDUCE CM in ways that are unsupported by the source data relational integrity. This can lead to consequences such as creation of Cartesian products in the datasets. An active program of DEDUCE training and investigator workshops provide important training in the data model and approach to data exploration activities.
As data availability and breadth expand over time in our institution, we continue to identify new query features that would be useful to end users. For example, users can currently query hospital locations at the time of admission and discharge, but data from these tracking tables have not yet been incorporated into DEDUCE to allow users to know the patient's specific clinical service and location over time. This means that it may be hard to target data for clinical services that do not commonly admit or discharge patients directly. DEDUCE CM also does not currently provide search operations that would describe temporal relationships, such as the presence of readmissions with 30 days, a common metric important to hospital quality initiatives. Such relationships must be investigated outside of DEDUCE using data manipulation tools.
We have chosen not to address DEDUCE system optimization or query response time in this paper because the DEDUCE technology stack of hardware, software, and network services is currently based on shared resources. Benchmarking of system efficiency is influenced by other process utilization unrelated to DEDUCE; the EDW database in particular is utilized by multiple services and data retrieval tasks.
4.3. Future directions
We will continue to solicit user feedback in multiple forums to support appropriate focus for future development of the DEDUCE platform to support our user community. Multiple mechanisms, including regular meetings of the DEDUCE User Group and postings from the online user forum, will inform future decisions on functionality and prioritization.
Our immediate priority is to incorporate data and new subject areas from Duke MAESTRO (Medical Application Environments Supporting Transformation of Research and Operations) Care [25], Duke Medicine's new Epic [26] platform-based EHR platform. The rolling deployments of Duke MAESTRO Care (DMC) are scheduled to be completed in 2014. We expect that incorporation of new DMC-sourced subject areas will be an efficient process because of the DEDUCE application architecture, allowing changes to be made in the metadata instead of changes to the application programming directly. It is noteworthy that two other large health systems in the same geographic area are also adopting Epic for their own EHR platforms and thus will potentially have subject areas similar to those used at Duke. This development—coupled with the inherent flexibility of the data dictionary—would also allow DEDUCE to be easily portable to other institutions. The data dictionary content would need customization and testing for the new institution's database structuring, but would be compatible with the same patient-centric and encounter-basis model. In this context, we are optimistic about the potential to use DEDUCE as a collaboration point with local and national partners.
Second, we will be deploying Greenplum [27] in spring 2014 as a dedicated platform to support optimization of system response for user queries and activity within DEDUCE. This server deployment will be very different from our current technology stack, which is based on shared resources, but is expected to meet the growing needs of our user community with dedicated resources to provide prioritization of DEDUCE-related activity. This extra computation power is expected to support new logic, with its resulting processor burden, to query the patient tracking tables and thus describe their clinical service and hospital nursing unit location throughout the course of an encounter, as described in Section 4.2.
Third, we will continually enhance the user interface guided by user feedback, and release additional subject areas. We also expect that the DMC patient problem lists, representing a new context of provider-mediated patient history, transient, and persistent clinical conditions, will give DEDUCE users greater accuracy in certain query use cases that until now have been limited to diagnoses within the billing context. We plan to add outpatient medications, chemotherapy data, the capability to identify patients across different disease registries, as well as ICD-10-CM searching once that coding method becomes mandatory in October 2014. Given the large increase in the number of codes available using ICD-10-CM, we will have to consider if a different search and select interface may be more appropriate than how we structure presentation of ICD-9-CM descriptions. As users become skilled with DEDUCE, they have requested that their departmental databases or registries (e.g. a local breast cancer data mart) be integrated in the EDW and made accessible through the tool. We are also interested in releasing new query operators that allow building of timelines that describe how data returned should be temporally related (e.g., examining a series of lab results within a certain window of a medication being ordered).
Finally, because all queries are stored for auditing purposes, we plan to mine this information to better understand which areas of the EDW are most frequently accessed, and to recognize opportunities to support optimization of the most frequent user activity, areas where targeted user training should be focused, and development of more effective visualization techniques to support user interactivity.
5. Conclusions
Like many institutions, Duke Medicine is a dynamic environment in which the technical infrastructure of patient care systems is continuously evolving. By incorporating an application architecture that is responsive to underlying data, and that allows modifications to be driven by alterations in metadata rather than programming, DEDUCE is an efficient solution that can respond to source system changes in an agile method. This is particularly important in a data warehousing environment where source systems have different software development life cycles than the platforms, such as DEDUCE, that consume these data.
Research needs are also continuously evolving, and DEDUCE is well-positioned to support future directions in patient care and research interests, allowing data-driven exploration to precede and strengthen hypothesis development, and allowing the investigator to interact directly with the data without depending on EDW data analysts.
Because of the DEDUCE self-service model, careful requirements analysis and user feedback are essential to the interface development process, especially for interface design. Our overall experience indicates that a user-friendly environment is essential for ensuring accessibility to enterprise assets and, ultimately, opening the treasure trove of data generated in the care of patients for continuing use.
Acknowledgments
The authors thank the members of the Duke University Health System Information Management Team for their hard work in building and supporting the DEDUCE platform and user community. We acknowledge the leadership of Robert Califf, Ronald Goldberg, David Tanaka, Lloyd Michener, John Harrelson, Mike Cuffe, James Tcheng, and Lawrence Muhlbaier in their guidance for the design of the DEDUCE tools. W. Edward Hammond provided invaluable critiques of the DEDUCE CM module and the initial manuscript drafts. We also thank Jonathan McCall and Rebecca Gray of the Duke Clinical Research Institute, Durham, NC, for editorial assistance with this manuscript. Finally, we gratefully recognize the contributions and feedback from the DEDUCE user community.
This publication was made possible by Grant Number UL1RR024128 from the National Center for Research Resources (NCRR), a component of the National Institutes of Health (NIH), and NIH Roadmap for Medical Research, and Grant 1F31 NR012599 from the National Institute of Nursing Research (NINR). Its contents are solely the responsibility of the authors and do not necessarily represent the official views of NCRR, NINR, or NIH.
Abbreviations
- BI
Business Intelligence
- CCOW
Clinical Context Object Workgroup
- CM
Cohort Manager
- CR
Chart Review
- CT
Clinical Text
- DEDUCE
Duke Enterprise Data Unified Content Explorer
- DMC
Duke MAESTRO Care
- EDW
enterprise data warehouse
- EHR
electronic health record
- EM
Export Manager
- ETL
extract-transform-load
- GQ
Guided Query
- HbA1c
glycated hemoglobin
- HIPAA
Health Insurance Portability and Accountability Act
- i2b2
informatics for integrating biology and the bedside
- IRB
institutional review board
- ldl
low-density lipoprotein
- MAESTRO
Medical Application Environments Supporting Transformation of Research and Operations
- NCRR
National Center for Research Resources
- NIH
National Institutes of Health
- NINR
National Institute of Nursing Research
- PHI
protected health information
- RPDR
Research Patient Data Repository
- SQL
structured query language
- STRIDE
Stanford Translational Research Integrated Database Environment
References
- 1.West SL, Blake C, Zhiwen L, McKoy JN, Oertel MD, Carey TS. Reflections on the use of electronic health record data for clinical research. Health Informatics J. 2009;15:108–21. doi: 10.1177/1460458209102972. [DOI] [PubMed] [Google Scholar]
- 2.Chute CG, Beck SA, Fisk TB, Mohr DN. The enterprise data trust at mayo clinic: a semantically integrated warehouse of biomedical data. J Am Med Inform Assoc. 2010;17:131–5. doi: 10.1136/jamia.2009.002691. [DOI] [PMC free article] [PubMed] [Google Scholar]
- 3.Kamal J, Silvey SA, Buskirk J, Ostrander M, Erdal S, Dhaval R, et al. Innovative applications of an enterprise-wide information warehouse. AMIA Annu Symp Proc. 2008:1134. [PubMed] [Google Scholar]
- 4.Hurdle JF, Haroldsen SC, Hammer A, Spigle C, Fraser AM, Mineau GP, et al. Identifying clinical/translational research cohorts: ascertainment via querying an integrated multi-source database. J Am Med Inform Assoc. 2013;20:164–71. doi: 10.1136/amiajnl-2012-001050. [DOI] [PMC free article] [PubMed] [Google Scholar]
- 5.Erdal BS, Liu J, Ding J, Chen J, Marsh CB, Kamal J, et al. A database de-identification framework to enable direct queries on medical data for secondary use. Methods Inf Med. 2012;51:229–41. doi: 10.3414/ME11-01-0048. [DOI] [PubMed] [Google Scholar]
- 6.Zhang GQ, Siegler T, Saxman P, Sandberg N, Mueller R, Johnson N, et al. VISAGE: a query interface for clinical research. AMIA Summits Transl Sci Proc. 2010;2010:76–80. [PMC free article] [PubMed] [Google Scholar]
- 7.Behrman RE, Benner JS, Brown JS, McClellan M, Woodcock J, Platt R. Developing the sentinel system—a national resource for evidence development. N Engl J Med. 2011;364:498–9. doi: 10.1056/NEJMp1014427. [DOI] [PubMed] [Google Scholar]
- 8.Horvath MM, Winfield S, Evans S, Slopek S, Shang H, Ferranti J. The DEDUCE Guided Query tool: providing simplified access to clinical data for research and quality improvement. J Biomed Inform. 2011;44:266–76. doi: 10.1016/j.jbi.2010.11.008. [DOI] [PMC free article] [PubMed] [Google Scholar]
- 9.Nigrin DJ, Kohane IS. Data mining by clinicians. Proc AMIA Symp. 1998:957–61. [PMC free article] [PubMed] [Google Scholar]
- 10.Murphy SN, Morgan MM, Barnett GO, Chueh HC. Optimizing healthcare research data warehouse design through past COSTAR query analysis. Proc AMIA Symp. 1999:892–6. [PMC free article] [PubMed] [Google Scholar]
- 11.Centers for Disease Control and Prevention. HIPAA privacy rule and public health: guidance from CDC and the U.S. Department of Health and Human Services. [accessed 19.07.12]; < http://www.cdc.gov/mmwr/preview/mmwrhtml/m2e411a1.htm>.
- 12.Berger RG, Baba J. The realities of implementation of Clinical Context Object Workgroup (CCOW) standards for integration of vendor disparate clinical software in a large medical center. Int J Med Inf. 2009;78:386–90. doi: 10.1016/j.ijmedinf.2008.12.002. [DOI] [PubMed] [Google Scholar]
- 13.Anderson N, Abend A, Mandel A, Geraghty E, Gabriel D, Wynden R, et al. Implementation of a deidentified federated data network for population-based cohort discovery. J Am Med Inform Assoc. 2012;19:e60–7. doi: 10.1136/amiajnl-2011-000133. [DOI] [PMC free article] [PubMed] [Google Scholar]
- 14.Weber GM, Murphy SN, McMurry AJ, Macfadden D, Nigrin DJ, Churchill S, et al. The Shared Health Research Information Network (SHRINE): a prototype federated query tool for clinical data repositories. J Am Med Inform Assoc. 2009;16:624–30. doi: 10.1197/jamia.M3191. [DOI] [PMC free article] [PubMed] [Google Scholar]
- 15.McMurry AJ, Murphy SN, MacFadden D, Weber G, Simons WW, Orechia J, et al. SHRINE: enabling nationally scalable multi-site disease studies. PLoS ONE. 2013;8:e55811. doi: 10.1371/journal.pone.0055811. [DOI] [PMC free article] [PubMed] [Google Scholar]
- 16.Takai-Igarashi T, Akasaka R, Suzuki K, Furukawa T, Yoshida M, Inoue K, et al. On experiences of i2b2 (Informatics for integrating biology and the bedside) database with Japanese clinical patients' data. Bioinformation. 2011;6:86–90. doi: 10.6026/97320630006086. [DOI] [PMC free article] [PubMed] [Google Scholar]
- 17.Nadkarni PM, Brandt C. Data extraction and ad hoc query of an entity-attribute-value database. J Am Med Inform Assoc. 1998;5:511–27. doi: 10.1136/jamia.1998.0050511. [DOI] [PMC free article] [PubMed] [Google Scholar]
- 18.Kohane IS, Churchill SE, Murphy SN. A translational engine at the national scale: informatics for integrating biology and the bedside. J Am Med Inform Assoc. 2012;19:181–5. doi: 10.1136/amiajnl-2011-000492. [DOI] [PMC free article] [PubMed] [Google Scholar]
- 19.Murphy SN, Weber G, Mendis M, Gainer V, Chueh HC, Churchill S, et al. Serving the enterprise and beyond with informatics for integrating biology and the bedside (i2b2) J Am Med Inform Assoc. 2010;17:124–30. doi: 10.1136/jamia.2009.000893. [DOI] [PMC free article] [PubMed] [Google Scholar]
- 20.Lowe HJ, Ferris TA, Hernandez PM, Weber SC. STRIDE—an integrated standards-based translational research informatics platform. AMIA Annu Symp Proc. 2009;2009:391–5. [PMC free article] [PubMed] [Google Scholar]
- 21.Nalichowski R, Keogh D, Chueh HC, Murphy SN. Calculating the benefits of a Research Patient Data Repository. AMIA Annu Symp Proc. 2006;1044 [PMC free article] [PubMed] [Google Scholar]
- 22.Roden DM, Pulley JM, Basford MA, Bernard GR, Clayton EW, Balser JR, et al. Development of a large-scale de-identified DNA biobank to enable personalized medicine. Clin Pharmacol Ther. 2008;84:362–9. doi: 10.1038/clpt.2008.89. [DOI] [PMC free article] [PubMed] [Google Scholar]
- 23.Ritchie MD, Denny JC, Crawford DC, Ramirez AH, Weiner JB, Pulley JM, et al. Robust replication of genotype-phenotype associations across multiple diseases in an electronic medical record. Am J Hum Genet. 2010;86:560–72. doi: 10.1016/j.ajhg.2010.03.003. [DOI] [PMC free article] [PubMed] [Google Scholar]
- 24.Vanderbilt University Synthetic Derivative. [Accessed 3.02.14]; < https://medschool.vanderbilt.edu/dbmi/research/projects/synthetic-derivative>.
- 25.Duke Maestro Care. [accessed 19.07.13]; < http://www.dukehealth.org/maestrocare>.
- 26.Epic. [accessed 19.07.13]; < http://www.epic.com>.
- 27.Pivotal Greenplum database. [accessed 19.07.13]; < http://www.gopivotal.com/pivotal-products/pivotal-data-fabric/pivotal-analytic-database>.