Abstract
Objectives
Osteoarthritis (OA) is a debilitating disease affecting more than 4 million people in the United Kingdom. Despite its prevalence, there is no successful cell-based therapy currently used to treat patients whose cartilage is deemed irrecoverable. The present study aimed to isolate stem cells from tibial plateaux cartilage obtained from patients who underwent total knee replacements for OA and investigate their stem cell characteristics.
Design
Clonally derived cell lines were selected using a differential adhesion assay to fibronectin and expanded in monolayer culture. Colony forming efficiencies and growth kinetics were investigated. The potential for tri-lineage differentiation into chondrogenic, osteogenic, and adipogenic phenotypes were analyzed using histological stains, immunocytochemistry, and reverse transcriptase polymerase chain reaction.
Results
Colony forming cells were successfully isolated from osteoarthritic cartilage and extensively expanded in monolayer culture. Colony forming efficiencies were consistently below 0.1%. Clonal cell lines were expanded beyond 40 population doublings but disparities were observed in the number of population doublings per day. Clonally derived cell lines also demonstrated in vitro multilineage potential via successful differentiation into chondrogenic, osteogenic, and adipogenic lineages. However, variation in the degree of differentiation was observed between these clonal cell lines.
Conclusions
A viable pool of cells with stem cell characteristics have been identified within human osteoarthritic cartilage. Variation in the degree of differentiation suggests the possibility of further subpopulations of cells. The identification of this stem cell population highlights the reparative potential of these cells in osteoarthritic cartilage, which could be further exploited to aid the field of regenerative medicine.
Keywords: cartilage repair, repair, osteoarthritis, diagnosis, stem cells, cells, knee, joint involved, tissue engineering, repair
Introduction
Articular cartilage is avascular and aneural, and hence has an inherent lack of reparative potential. Osteoarthritis (OA) is the most common form of joint disease leading to disability and dependence, with more than 4 million people in the United Kingdom suffering from pain in one or both knees.1
Therapeutic management using physiotherapy and inflammatory medication, as well as surgical methods such as joint replacements, are currently used as palliative forms of treatment in patients where the tissue is deemed irrecoverable. At present, there are no successful cell-based therapies used to treat or modify progression of widespread OA lesions (reviewed by Nelson et al.2). In addition to the overall aim of alleviating pain, research has been directed toward the development of these therapies. Using in vitro culturing methods to isolate and expand cells in order to initiate new cartilage formation, methods have progressed from using chondrocytes to mesenchymal stem cells (MSCs) as a means of eliminating hurdles such as limited expansion potential, chondrocyte dedifferentiation in vitro, and donor site morbidity.3
More recent advancements in cell-based methods for articular cartilage repair investigate the potential of using a population of native cells to repair defective cartilage.4-10 The presence of a stem/progenitor cell population has been demonstrated in bovine articular cartilage, leading to further investigations identifying a similar subpopulation of chondroprogenitor cells residing in human and equine articular cartilage.4,10 We reported that it was possible to isolate and extensively expand clonal cell lines in vitro. This cohort of cells elicited a differential potential during chondrogenic induction in a three-dimensional (3D) pellet culture system as well as demonstrating further multipotent differentiation capacity. Further work showed that unlike traditional MSCs, chondroprogenitor cells do not have the tendency to produce a type X-collagen rich 3D matrix following chondrogenic induction. This was significant as it suggests a superior property, in which the cells do not terminally differentiate along the endochondral pathway.10
To date, work has focused on stem cells within normal articular cartilage. However, with repair and regeneration in mind, research has been expanded to examine these cells within OA cartilage. A native source of progenitor cells within diseased articular cartilage presents with the opportunity to explore regenerative prospects within the diseased state rather than relying on invasive surgical methods.
Alsalameh et al.6 and Fickert et al.11 have also described the presence of cells in articular cartilage with mesenchymal progenitor cell characteristics. More recently, Koelling et al.5 described the presence of migratory chondrogenic progenitor cells within human osteoarthritic cartilage, which are believed to be migrating in response to chemotactic signals. However, it is not clear that these cells receive local differentiation cues9 and differentiate into fully committed chondrocytes.
In this study, we demonstrate that it is possible to selectively isolate and expand stem cells from human OA cartilage. Furthermore, we show that clonally derived populations have the potential for chondrogenic induction and tri-lineage plasticity, displaying characteristics of stem cells isolated from normal human articular cartilage.4
Methods
Tissue Digestion and Chondrocyte Isolation
Cartilage from tibial plateaux removed from patients with OA at the time of total knee replacement was used to isolate resident stem cells (Fig. 1). Tibial plateaux were obtained from males and females aged 45 to 85 year (n = 9). South East Wales Research Ethics Committee safety and ethical guidelines were followed. Cells were released from their matrix by sequential enzyme digestion using 70 U mL−1 pronase followed by 300 U mL−1 collagenase (type I) in supplemented Dulbecco’s Modified Eagles Medium F12 (DMEM/F12) plus Glutamax (DMEM/F12 + Glutamax with 100 mg mL−1 gentamicin, 50 µg mL−1 l-ascorbic acid 2-phosphate, 1 mg mL−1 glucose, 2 mM l-glutamine, and 5% fetal calf serum [FCS]), at 37°C. Following digestion, the cells were filtered through a 40-µm mesh cell strainer. The remaining cell suspension was centrifuged, supernatant removed, and the pellet was resuspended in supplemented DMEM/F12 to be counted using a hemocytometer.
Figure 1.
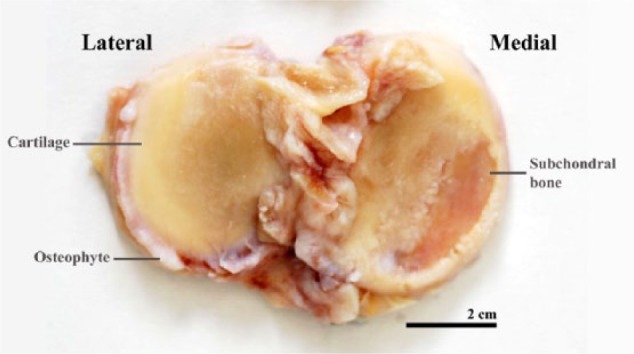
A tibial plateau removed from a patient with osteoarthritis at the time of total knee replacement. Characteristic features can be seen including osteophytes and subchondral bone.
Fibronectin Adhesion Assay to Isolate Cartilage Stem Cells
A differential adhesion assay onto fibronectin-coated plates was used to specifically isolate cartilage stem cells from the cell population (developed from Jones and Watt12). Cells were resuspended at a concentration of 4,000 cells mL−1 in supplemented DMEM/F12 and seeded onto 6-well plates that had been pretreated with fibronectin (10 µg mL−1 in phosphate-buffered saline containing 1 mM MgCl2 and 1 mM CaCl2) for 24 hours at 4°C. Cells were incubated for 20 minutes at 37°C, after which the media and nonadherent cells were removed. Fresh media (DMEM/F12 + 10% FCS) was then added to the dish and the cells were incubated and maintained in culture in a humidified chamber containing 5% CO2 at 37°C.
Colony Forming Efficiencies (CFEs)
Twenty-four hours after cell selection via fibronectin adhesion, the number of cells were counted. Between 8 and 14 days after the initial seeding day, clusters of ≥32 cells (defined as a colony) were counted, as this number represents a population of cells derived from more than 5 population doublings (PDs) of a single cell, thereby discounting a transient amplifying cell cohort. CFEs were then calculated based on (a) the initial seeding density and the number of colonies formed and (b) the number of cells that initially adhered and the number of colonies formed.
Colony Isolation
Colonies were isolated using polystyrene cloning cylinders. One hundred microliters of trypsin-EDTA was used to lift the cells, allowing them to be transferred into 12-well plates containing supplemented DMEM/F12 + 10% FCS, 1 ng mL−1 TGF-β2 and 5 ng mL−1 FGF-2. A minimum of eight clones were isolated from each OA specimen.
Expansion in Monolayer Culture
Clonal cell lines were cultured until confluent and passaged accordingly. PDs could be monitored, using the following formula:
where N is the number of cells recovered at the end of the passage and N0 is the number of cells initially plated. Day 1 was considered the day in which the cells were initially plated.
Chondrogenic Differentiation
Half a million cells resuspended from clonal cell lines at 20 to 25 PDs were centrifuged into pellet mass cultures in sterile 1.5-mL Eppendorf tubes containing chondrogenic media (DMEM/F12 + Glutamax with 2% FCS, 100 mg mL−1 gentamicin, 50 µg mL−1 ascorbic acid, 1 mg mL−1 l-glucose, 2 mM l-glutamine, 1% HEPES, and supplemented with 1% insulin-transferrin-selenium [ITS], 0.1 µM dexamethasone, and 5 ng mL−1 TGF-β2). The Eppendorf tubes containing cells were maintained at 37°C in 5% CO2. Media was changed three times a week for 21 days after which they were either fixed in 4% paraformaldehyde, wax-embedded, and sectioned at 8 µm for analysis, or placed in buffer RLT for RNA extraction using a Qiagen RNeasy Mini Kit (Qiagen, UK). Pellets from a minimum of three different clonal cell lines were analyzed for each OA specimen.
Osteogenic Differentiation
Pellet cultures were established as above. Osteogenic differentiation medium comprised DMEM + 10% FCS, 10 mM β-glycerophosphate, 10 nM dexamethasone, and 0.1 mM l-ascorbic-acid-2-phosphate, 500 mg mL−1 gentamicin, and 1% HEPES. Pellets were incubated at 37°C and 5% CO2, and media was changed every second day for 21 days, after which they were processed. Pellets from a minimum of three different clonal cell lines were analyzed for each OA specimen.
Adipogenic Differentiation
Adipogenic differentiation was induced in monolayer cultures using a modified protocol described by Koch et al.13 In brief, cells were seeded in 6-well plates at 5 × 10⁴ per well and cultured until subconfluent, at which point they were treated with DMEM + 10% FCS containing 10 µg mL−1 insulin, 1 µM dexamethasone, 100 µM indomethacin, 500 µM 3-isobutyl-1-methyl xanthine (IBMX), and 15% normal rabbit serum. The medium was changed every 48 hours (×3) after which the cells were either fixed for 10 minutes with 10% neutral buffered formalin solution (NBFS) and stained with Oil red-O for the presence of lipid droplets, or washed in PBS and lifted for RNA extraction.
Histological Stains
Sections were stained with either safranin O or toluidine blue. Following staining, sections were dried and mounted under coverslips using dibutyl phthalate xylene.
Immunohistochemistry
Indirect immunoperoxidase labeling was carried out using human specific antibodies against collagens type I (COL-1, Sigma Aldrich, UK), II (Abcam, UK), X (Gift from Klaus von der Mark), and aggrecan (5C5, Enzo Life Sciences, UK). Fluorescence labeling was used to detect Stro-1 (R&D Systems, UK). Primary antibodies were diluted in 0.1 M PBS containing 0.01% Tween 20 (PBS-T) at a concentration of 10 µg mL−1. Appropriate antigen retrieval techniques were necessary to expose the collagen, aggrecan, and STRO-1 epitopes. For collagen types I and II, pellets were subjected to a chondroitinase (0.25 U mL−1; Sigma Aldrich, UK) and hyaluronidase (2 U mL−1; Sigma Aldrich, UK) pretreatment for 1.5 hours at 37°C. For collagen type X, pellets were first subjected to a proteinase K (2.0 µg mL−1; Sigma Aldrich, UK) digest for 1 hour at 37°C, and subsequently a chondroitinase (0.25 U mL−1) and hyaluronidase (2 U mL−1) treatment for 30 minutes at 37°C. For aggrecan (5C5), pellets were subjected to a hyaluronidase (2 U mL−1) pretreatment for 1.5 hours at 37°C. Pellets from a minimum of three different clonal cell lines were labeled for each antibody. For STRO-1, pellets were pretreated with 0.3% triton X (in PBS) for 30 minutes at room temperature.
Peroxidase Labeling
Sections were rinsed in PBS-T. Endogenous peroxidase activity was blocked with 0.3% hydrogen peroxide in distilled H2O for 5 minutes. An R.T.U Vectastain Universal Quick Kit (Vector Laboratories, UK) was used in which reagents (excluding primary antibodies) are contained and instructions outlined. Briefly, tissue sections were incubated in prediluted normal horse serum for 20 minutes. Following incubation, excess serum was tipped off and primary antibodies diluted in PBS-T were directly applied and incubated at room temperature for 1 hour. Appropriate species specific IgG immunoglobulins served as negative controls. Sections were subsequently washed and incubated for 15 minutes in prediluted biotinylated pan-specific universal secondary antibody. Following further washes, sections were incubated in a streptavidin/peroxidase complex and developed using a 3,3′-diaminobenzidine (DAB) substrate kit (Vector Laboratories, UK). Mayer’s hematoxylin was used as a counterstain.
Fluorescence
Sections were rinsed in PBS-T and appropriate serum was applied for 1 hour at room temperature to block any nonspecific binding. Primary antibodies and appropriate IgG immunoglobulins were incubated at 4°C overnight. Samples were probed with relevant flourescein isothiocyanate conjugated secondary antibodies diluted in PBS-T (10µg/mL) and mounted in Vectorshield mounting media containing 4’,6-diamidino-2-phenylindole (Vector Laboratories, UK).
Bromodeoxyuridine (BrdU) Labeling of Cells
BrdU incorporation into cellular DNA occurs during cell proliferation in place of thymidine. Briefly, cells were seeded at 1.0 × 10⁵ in 12-well plates and incubated for 24 hours at 37°C in 5% CO2. Ten microliters of BrdU was added to each well and incubated for 24 hours. The cells were then washed in PBS prior to being fixed in precooled 70% ethanol for 30 minutes. Subsequent immunodetection of BrdU using a specific G3G4 anti-BrdU mouse monoclonal antibody (DSHB, USA) (at 3 µg mL−1 for 1 hour at room temperature) allowed for labeling of cells in S-phase of the cell cycle. After several washes in PBS-T, cells were incubated in 3% H2O2 diluted in distilled water for 5 minutes. Following this procedure, cells were incubated in 4 M HCl for 10 minutes. Reagents from the R.T.U Vectastain kit were used to carry out the remaining steps. DAB substrate was used to visualize the staining. An average of three counts was taken for each of the cell lines.
Senescence Associated β-Galactosidase (β-Gal) Staining
Cells were fixed in fixation solution (2% formaldehyde and 0.2% glutaraldehyde diluted in PBS) for 5 minutes at room temperature. Fresh β-Gal stain solution was made immediately before use and consisted of 1 mg mL−1 5-bromo-4-chloro-3-indolyl β-d-galactopyranoside (X-Gal) dissolved in N,N-dimethylformamidine. This was added to 40 mM citric acid/sodium phosphate at pH 6.0, 5 mM potassium ferricyanide, 5 mM potassium ferrocyanide, 150 mM sodium chloride, and 2 mM magnesium chloride dissolved in distilled water. Cells were incubated with β-Gal solution for 16 to 24 hours at 37°C after which they were washed in distilled water and imaged. The assay produces a blue precipitate in cells expressing the senescence marker SA-β-Gal. An average of three counts was taken for each of the cell lines.
Plasticity
Osteogenesis: von Kossa Staining for Calcium Mineral Deposits
Embedded and sectioned pellets were dewaxed and stained with fresh 5% aqueous silver nitrate for 30 minutes under bright light and then rinsed in distilled water. Subsequently, the stain was developed using 5% sodium carbonate in 10% NBFS for 5 minutes. Sections were then rinsed in distilled water again before being fixed in 5% sodium thiosulfate for 2 minutes. Examination and images were recorded using the Leitz DMRB light microscope.
Adipogenesis: Oil Red-O Staining
Following fixation in 10% NBFS, cells were rinsed and maintained in PBS while fresh Oil red-O was prepared (0.3% Oil red-O in 60% isopropanol) immediately prior to staining. The stain was added to the plates for 1 hour at room temperature before being washed thoroughly in distilled water, examined using a Nikon Eclipse TS100 microscope and imaged using a Nikon E4500 camera.
Polymerase Chain Reaction (PCR)
RNA was extracted from cells using a kit (RNAEasy, Qiagen, UK) with a DNase incubation step. RNA was quantified using a Nanodrop 2000c spectrophotometer and 100 ng of each sample was used for reverse transcription. PCRs were performed using the primer combinations outlined in Table 1. All reactions were carried out at 40 cycles with the exception of 18S, which was run at 28 cycles.
Table 1.
Summary Table of Primer Sequences for Specific Genes Used for Generating PCR Products.
| Gene of Interest | Primers (5′-3′) | Annealing Temperature (°C) | Product Size (bp) |
|---|---|---|---|
| 18S Ribosomal RNA | Fwd: CAC AGG AGG CCT ACA CGC CG | 55 | 113 |
| Rev: AGG CTA TCT TCC GCC GCC CA | |||
| Aggrecan | Fwd – GTC TCA CTG CCC AAC TAC CC | 55 | 150 |
| Rev – GAT GCC TTT CAC CAC GAC T | |||
| Sox 9 | Fwd: GGA GGA AGT CGG TGA AGA AC | 55 | 137 |
| Rev: GGA GTG CAC CTC GCT CAT | |||
| Collagen type II | Fwd: GTG AGC CAT GAT TCG CCT C | 60 | 131 |
| Rev: TAT ACC TCT GCC CAT CCT GC | |||
| Lipoprotein lipase (LPL) | Fwd: AGG AGC ATT ACC CAG TGT CC | 60 | 130 |
| Rev: CCA AGG CTG TAT CCC AAG AG | |||
| Osteonectin | Fwd: AAA TAC ATC CCC CCT TGC CT (Exon 6/7) | 60 | 78 |
| Rev: CCA GGA CGT TCT TGA GCC AG (Exon 7) |
Statistics
Data are reported as the mean ± standard error of the mean. One-way ANOVA analysis was used to analyze colony forming efficiency and cell proliferation and senescence data. A P value of <0.05 was considered significant.
Results
Cartilage Stem Cell Immunodetection, Cell Isolation, and Expansion
Cartilage stem cells were successfully isolated from osteoarthritic tibial plateaux by differential adhesion onto fibronectin and clonally derived primary cell lines were established in monolayer culture. The number of days required for colonies of over 32 cells to form ranged from 8 days up to 14 days (Fig. 2). The morphological appearance of the colonies varied by size and how condensed the cells within the colonies were. The cell shape typically observed was fibroblast-like; however, flatter cells with numerous cell protrusions were also identified, as were spindle-like cells. Colonies of cells were then selectively removed to establish clonal cell lines, eliminating the possibility of culturing any transit amplifying cells.
Figure 2.
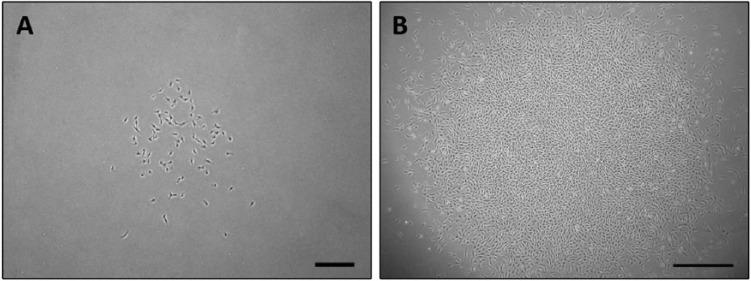
Successful isolation of clonally derived cartilage stem cells from a patient with osteoarthritis. The number of days required for colonies to form ranged, as did the morphological appearance. (A) A clone at day 10 with loosely packed cells. Scale bar = 350 µm. (B) A clone at day 10 with tightly packed cells. Scale bar = 700 µm.
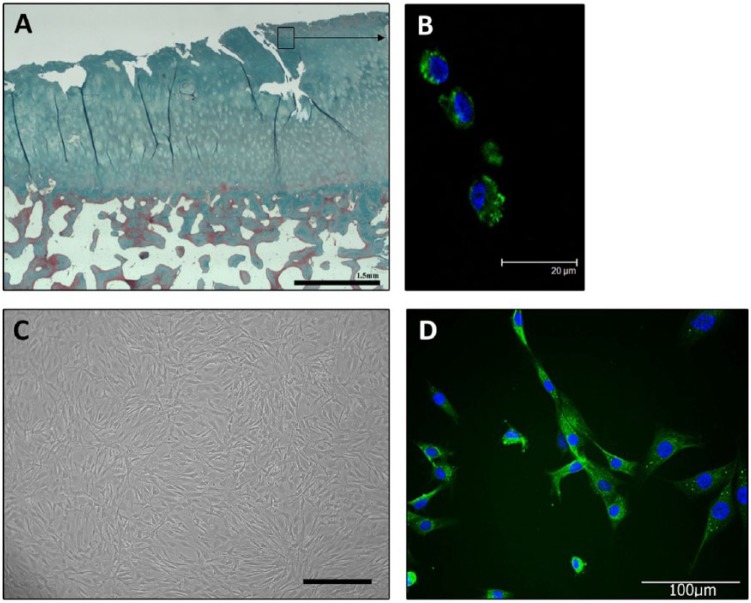
Immunolabeling of tissue sections taken from osteochondral plugs demonstrated the presence of the stem cell marker STRO-1 in the superficial zone (Fig. 3). After fibronectin isolation and expansion, the clonal cell lines also expressed STRO-1.
Figure 3.
(A)Massons trichrome staining demonstrates degenerative cartilage fissuring typical of osteoarthritic tissue. (B) Immunohistochemistry for STRO-1 detected positive labeling in the surface zone of osteoarthritic cartilage. (C) Clonally derived stem cells isolated from osteoarthritic cartilage. Photomicrograph of cells at confluence. Scale bar = 300 µm. (D) STRO-1 labeling detected in clonally derived cartilage stem cells after extended in vitro expansion.
Growth Kinetics
Colony Forming Efficiencies
Initial adhesion to fibronectin ranged between 10.7% and 15.4% of isolated cells. CFEs were calculated based on the initial seeding density and on the number of cells, which initially adhered. CFEs based on the initial seeding densities were consistently below 0.1% (ranging from 0.04% to 0.09%). The number of colonies formed in relation to the number of cells that initially adhered ranged from 0.5% to 0.88% (Fig. 4). No statistically significant variation between donors was found for any of these parameters (P > 0.05).
Figure 4.
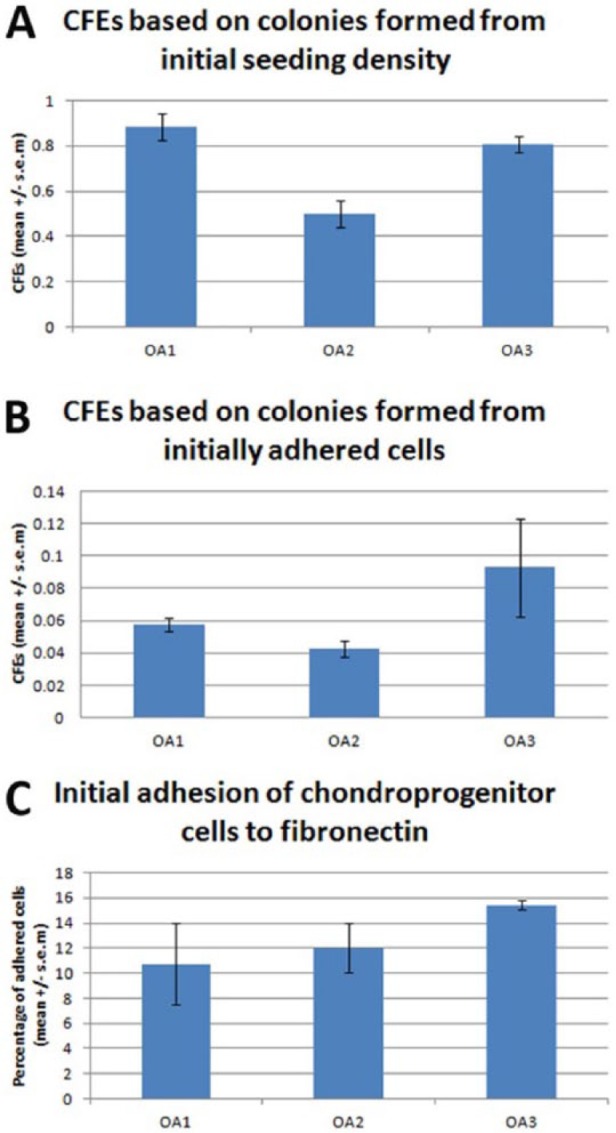
Colony forming efficiencies (CFEs) of stem cells isolated from osteoarthritic tibial plateaux using a fibronectin adhesion assay. (A) CFEs calculated using the initial seeding density of 4000 cells mL−1. (B) CFEs calculated using the number of cells that initially adhered to the fibronectin coated tissue culture plastic. (C) Percentage of total cells that adhered to the fibronectin coated plastic. No significant variation was found for any of these parameters.
Population Doublings
After cloning, more than 50% of the cell lines could be expanded in monolayer beyond 30 PDs, while continually expressing STRO-1 (Fig. 3). The time taken to reach 30 PDs ranged between 34 and 75 days (0.40 to 0.88 PDs per day). The time taken to reach 40 PDs ranged from 50 and 98 days (0.41 to 0.8 PDs per day) (Fig. 5). There was no statistically significant difference found in proliferation rates between males and females (P > 0.05).
Figure 5.
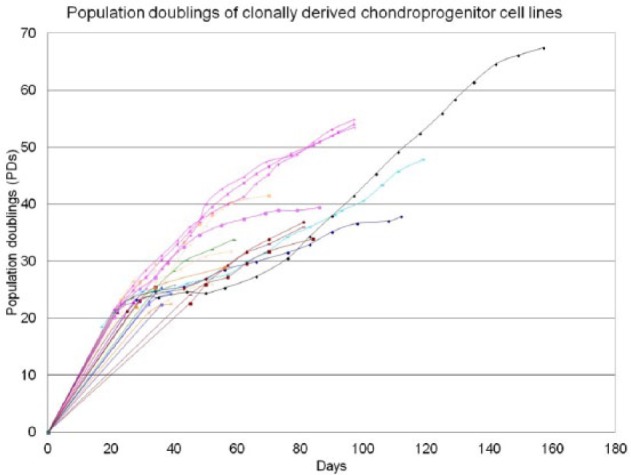
Population doublings of clonally derived stem cell lines derived from osteoarthritic cartilage.
Proliferation and Senescence
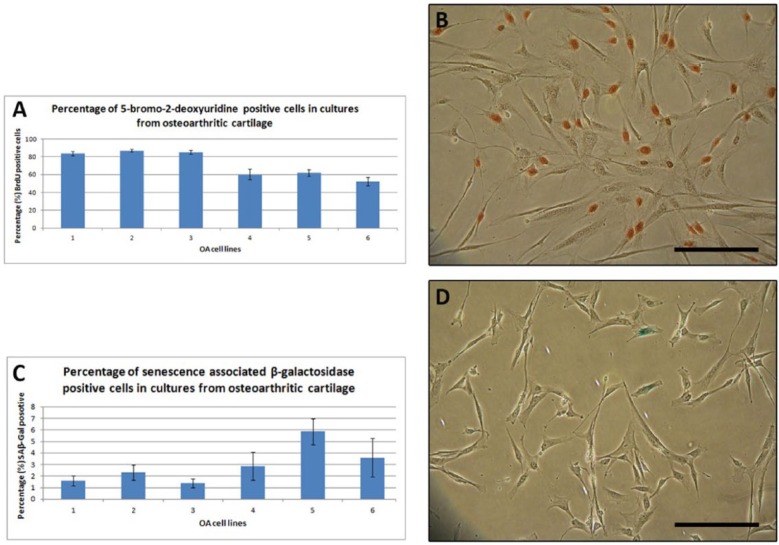
Cell proliferation in clonally derived cell lines from OA articular cartilage was assessed using a BrdU assay, which incorporates BrdU into cellular DNA in place of thymidine during the replicative process. The percent of BrdU positive cells ranged from 52% to 87%, which was a statistically significant variation (Fig. 6A and B). A senescence associated β-galactosidase assay was used to assess the degree of senescence within the stem cell lines from OA cartilage. The percent of SA β-gal positive cells ranged between 1.4% and 5.9 % (a nonsignificant variation, P > 0.05) (Fig. 6C and D).
Figure 6.
Proliferation and senescence of clonal cell lines derived from osteoarthritic cartilage stem cells at 20 to 25 population doublings. (A) Percentage of BrdU positive cells in cultures expanded in vitro. (B) A photomicrograph of cells stained with BrdU. Brown indicates a positive stain. ANOVAs confirmed significant variation (P < 0.05). Scale bar = 200 µm. (C) Percentage of SA β-gal positive cells in cultures expanded in vitro. (D) A photomicrograph of cells stained with SA β-gal. Blue indicates senescing cells. No significant variation was found. Scale bar = 200 µm.
Chondrogenic 3D Pellet Formation
Chondrogenic induction of stem cells produced pellets that were smooth and iridescent, resembling hyaline cartilage. The pellets formed varied in size between clonal cell lines but were typically between 600 µm and 1000 µm in diameter (Fig. 7A and B). All pellets stained positively, to some degree, for toluidine blue and safranin O, suggesting the production of a proteoglycan-rich extracellular matrix. Although not quantified, the proportion of the pellets that labeled positively varied between clonal cell lines and between OA specimens, with no consistent trend. Representative images can be seen in Figure 7C to F. Furthermore, positive labeling with antibodies against type II collagen and aggrecan indicate the formation of a cartilaginous matrix (Fig. 7G and H). Despite the variation in the extent of matrix production, gene expression analysis demonstrated the presence of type II collagen, aggrecan, and the chondrogenic transcription factor Sox9 in all chondrogenic pellets. In the undifferentiated cells, Sox9 was expressed uniformly whereas type II collagen and aggrecan gene expression was low or absent (Fig. 7J).
Figure 7.
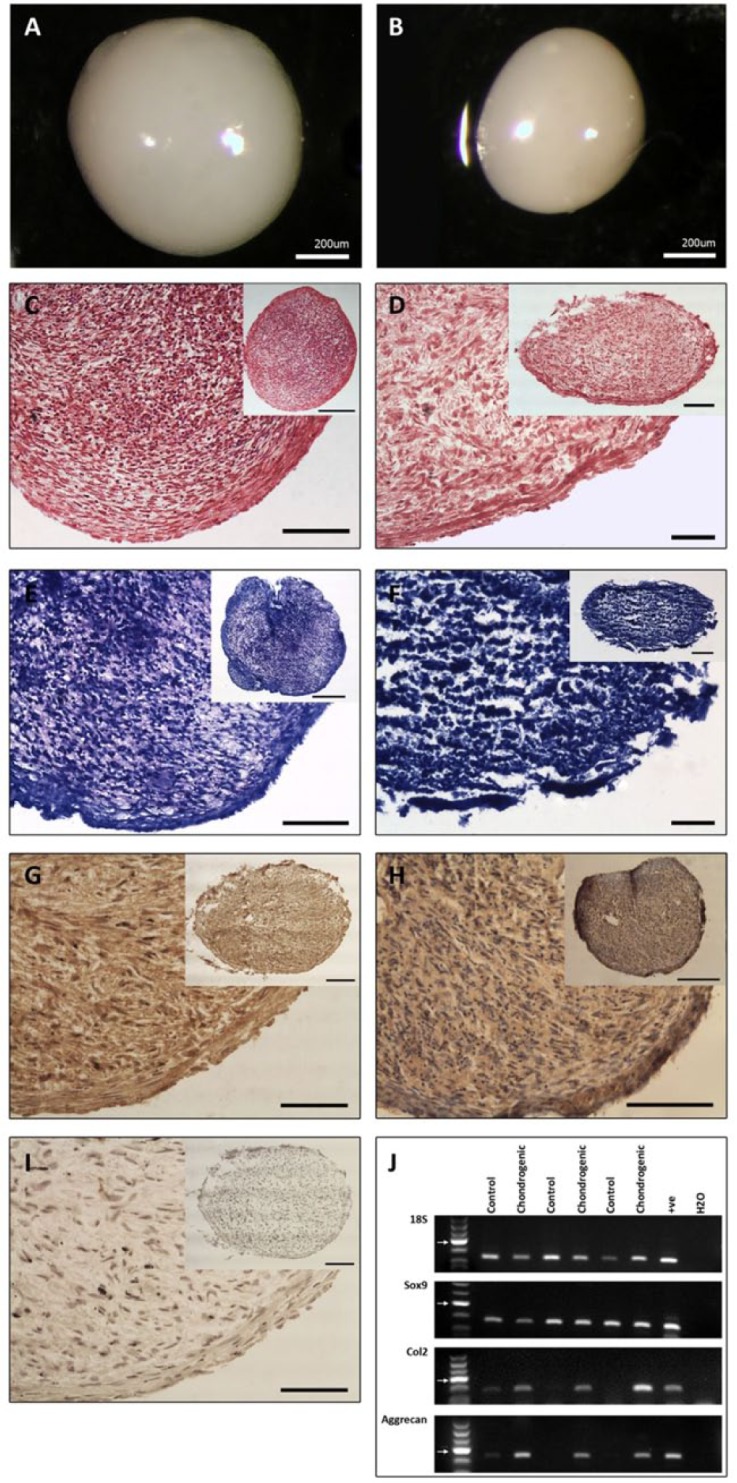
Representative samples of chondrogenic 3D pellet formation. Variation was observed in the extent of matrix production. (A and B) Pellets of varying sizes. Pellets were smooth, iridescent, and displayed consistent characteristics. (C and D). Safranin-O staining in chondrogenically induced stem cells. Degree of staining varied between pellets from different cell lines. (C) A pellet that stained positively for safranin-O throughout the matrix. (D) A pellet of lesser integrity that demonstrated a lesser degree of safranin-O staining throughout its matrix. (E and F). Toluidine blue staining in chondrogenically induced stem cells. (E) Larger pellet with more staining throughout the matrix and greater overall integrity. (F) Smaller pellet with regions lacking toluidine blue staining in the core of the pellet. (G) Type II collagen labeling throughout the chondrogenic 3D pellet. (H) Aggrecan (5C5) labeling throughout the chondrogenic 3D pellet. (I) Control pellet. C to I Scale bars = 50 µm (insert = 100 µm). (J) Representative examples of chondrogenic induction in pellets showing 18S, Sox9, Col2, and aggrecan gene expression by RT-PCR. Control samples are unstimulated cells. Arrows indicate 200 base pair mark.
Osteogenic Differentiation
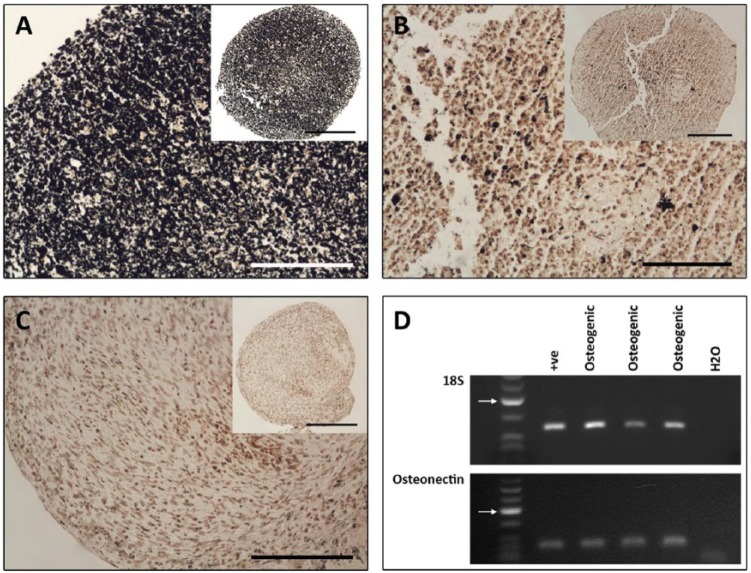
Osteogenic induction of OA cartilage stem cells was also carried out in pelleted clonal cell lines. The pellets resembled those cultured in chondrogenic conditions in size and shape. Fixed, paraffin-embedded pellets were sectioned and stained using the von Kossa technique to detect deposits of calcium, indicative of a mineral-rich matrix. Different levels of such deposits were apparent between different clones after the 3-week incubation time. The varying levels of mineral deposits did not correspond to the varying levels of chondrogenic markers, in that it was not possible to identify pellets that were consistently poor throughout the different lineages. No positive stain was observed in any of the corresponding controls (Fig. 8A-C). By RT-PCR, positive gene expression of the osteogenic marker osteonectin was found in the osteogenically induced clones (Fig. 8D).
Figure 8.
Representative samples of osteogenic induction of cartilage stem cells. (A and B) Osteogenic pellets stained using von Kossa for mineral deposits. (A) An abundance of mineral deposits identified throughout the osoteogenic pellet. (B) Sparse deposits within the osteogenic pellet. (C) Control pellet. A-C Scale bars = 50 µm (insert = 100 µm). (D) Representative examples of osteogenic induction in pellets showing 18S and osteonectin gene expression by RT-PCR. Arrows indicate 200 base pair mark.
Adipogenic Differentiation
After adipogenic induction Oil red-O staining was used to detect the presence of lipid vacuoles in the stem cells. All clonal cell lines from all donors had positive staining. In cultures exposed to adipogenic treatment, RT-PCR detected the expression of mRNA for lipoprotein lipase (LPL), a member of the lipase family found in adipose tissue. Control cultures had no positive staining (Fig. 9).
Figure 9.
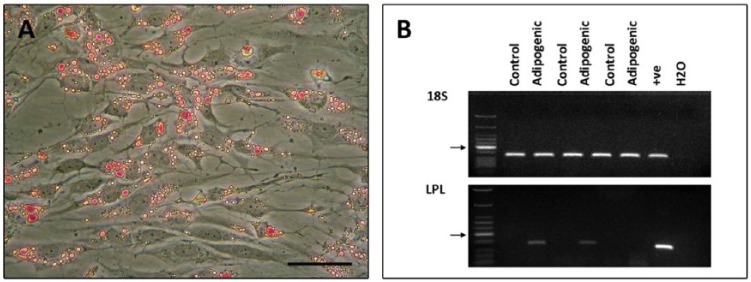
Representative samples of adipogenic induction of cartilage stem cells. (A) Photomicrographs of monolayer cultures following adipogenic induction of cartilage stem cells. (B) Representative examples of adipogenic induction in monolayer cultures showing 18S and LPL gene expression by RT-PCR. Control samples are unstimulated cells. Arrows indicate 200 base pair mark.
Discussion
Previous work from our laboratory has described the isolation and characterization of cells with stem cell properties from normal bovine, equine, and human tissue.4,8-10 These cells can be isolated and expanded in vitro while retaining their chondrogenic capacity. In the present study, we have demonstrated for the first time the presence of a viable stem cell population in human osteoarthritic cartilage. The cells can be isolated with the same methods used previously, which relies specifically on α5β1 integrin–fibronectin interactions.12 We have been able to show that these OA stem cells have a similar differentiation capacity to the stem cells isolated from normal articular cartilage.4
STRO-1, a putative stem cell marker, was identified on the surface of a subpopulation of cells in the fibrillated surfaces of osteochondral plugs taken from degenerate tibial plateaux. Having isolated cartilage stem cells using the fibronectin assay and expanding them in monolayer culture, it was found that these cells also express the cell surface antigen (Fig. 3). This finding is congruent to data published by Grogan et al.,14 who also identified STRO-1 positive labeling in normal and osteoarthritic human articular cartilage; McCarthy et al.10 and Williams et al.4 also identified the antigen on the surface of normal equine and human articular cartilage stem cells, respectively. It is hypothesized that the cells that adhere to fibronectin, which can be expanded without loss of differentiation potential, may be at least a subpopulation of the cells labeled by STRO-1 in situ.
Colonies of cells containing over 32 cells were formed from single cells that adhered to fibronectin. Variation was observed in the time taken for the colonies to expand, as well as in the density and morphology of the cells within the colonies. The colonies, which excluded any transit amplifying cells, were randomly selected for expansion. It would be preferable to systematically isolate colonies based on these variations to determine if these are features that correlate with expansion potential. In a recent study by Pevsner-Fischer et al.,15 the authors discuss the possibility that “long-term culture of MSCs leads to the selection of specific clones overtaking the culture. Since MSCs may be a priori heterogeneous, functionally divergent MSC cultures could simply be an outcome of specific culture conditions that select particular type of MSCs.” While this is a reasonable rationale, we found heterogeneity in clonal cell lines, suggesting a range of differentiation potentials exist within the stem cell population of articular cartilage.
Previous studies by our group specifically characterized progenitor cells residing in the surface zone of articular cartilage in the respective species.4,8,10 Thus, it is likely that the cells isolated in those studies contained a more homogeneous population of stem cells. In the osteoarthritic tissue used for this study, the topographical morphology of the tibial plateaux varied; certain regions were extensively fibrillated, lacking a definable superficial zone, whereas others appeared morphologically “normal”. As such, it was not feasible to only isolate cells from the upper region as surface zone is not always present in OA tissue. This may have contributed to the heterogeneity of the cell lines in this study, a feature that was not determined in our previous studies.
Originally, CFEs were calculated using the percentage of colonies formed as a proportion of the initial seeding density.12 However, depending on seeding densities, cells are known to behave very differently.16 Thus, the data were analyzed not only using the traditional method of CFE calculation but also by calculating the colonies in proportion to the number of cells that initially adhered to the tissue culture plastic coated in fibronectin. Figure 4A illustrates the percentage of colonies formed based on the initial seeding density, giving an indication of colony forming cells within the entire collection of cells released during tissue digestion. The percentage of colonies formed was consistently below 0.2% of total cells. This is similar to results reported by Dowthwaite et al.,8 who calculated a mean CFE of 0.27 in cells isolated from 7-day-old bovine articular cartilage. As such, this subpopulation of cells represents a small proportion of the total cell population within OA cartilage. The percentage of cells that initially adhered (within 24 hours of plating) to fibronectin gives an indication of the number of active α5β1 integrin receptors on the surface of the cells. Comparing results of this study to similar unpublished work from our laboratory using normal human articular cartilage, it was noted that a higher proportion of cells initially adhere in the OA cohort when compared to the normal group. This is in agreement with findings by other authors,11,17 who describe an increase in specific stem cells in OA tissue, albeit using different methods for stem cell isolation.
It must be noted that we consistently isolate far fewer cartilage stem cells from any species or pathological state, than are reportedly isolated by other means.5-7,11,14,17 The method used by Alsalameh et al.,6 to identify progenitor cells relies on the presence of CD105+/166+ cells. However, as well as reporting very high numbers of stem cells in cartilage, there has been contradicting data published with regard to these markers in normal and osteoarthritic cartilage, suggesting that further work would need to be carried out before this method becomes widely accepted.17 Similarly, the Koelling method relies on cells migrating from explants cultured in vitro.5 This phenomenon is a common occurrence in many different tissues, and so should arguably be treated cautiously as a mechanism for isolating progenitor cells, but also inevitably contains a greater selection of various cells with unknown, undisclosed phenotypes. Fickert et al.,11 identified a population of cells that were CD9+/CD90+/CD166+ that showed trilineage differentiation capacities, and found various triple combinations of CD9, CD44, CD54, CD90, and CD166 positive cells accounting for 2% to 12% of the total population within osteoarthritic cartilage. It may be that the cells isolated using the fibronectin adhesion assay form a subset of the cells that Fickert identified, given that these form a smaller proportion of the population but demonstrate similar differentiation potential.
The determination of colonies formed in relation to the number of adherent cells (Fig. 4B) reveals the relative proportion of cells that become colony forming in relation to the number of cells that were initially selected due to receptor–integrin interactions. Despite the higher proportion of initially adherent cells from OA cartilage compared with normal cartilage,8 there were significantly less colonies formed from OA versus normal cartilage.4 It is thus possible to hypothesize that within OA cartilage, a stem cell population is present but the cells are not fully functional, as indicated by the marked reduction in CFEs in the OA group. This would be consistent with the notion posited by Dealy18 that the ability of stem cells to accomplish repair of cartilage may be compromised by the presence of disease rather than being a function of the number of cells present.
Primary cultures of OA clonal cell lines were examined for proliferation and senescence using BrdU and SA β-Gal, respectively. Variation between cell lines again highlights the heterogeneity, suggesting that any differences seen may not necessarily be due to the nature of tissue from which the cells were excised but more so from the mixed population of cells isolated.
Pellet cultures were established using clonally derived cell lines isolated and expanded from osteoarthritic tibial plateaux. The extent to which the cells have the capacity to recapitulate articular cartilage was investigated with histological stains in order to detect the presence of sulfated glycosaminoglycan (GAG) within the extracellular matrix, as well as immunohistochemistry to detect protein expression of cartilage-associated matrix components. Safranin-O and toluidine blue staining indicated the presence of sulfated GAGs in the pellets and collagen type II and aggrecan were present. These results provide evidence that stem cells excised from osteoarthritic tissue have the potential to produce a cartilage-like matrix rich in GAGs, aggrecan, and collagen type II. However, within the cohort of cells selected using the fibronectin adhesion assay, there are variations in the response to chondrogenic stimuli.
The ability of the stem cells to produce multilineage progeny was determined, and the cells were successfully induced into adipogenic and osteogenic lineages. The heterogeneity of the clones obtained from osteoarthritic tissue suggests there may be both stem and more restricted progenitor cells captured by the fibronectin adhesion method (Figs. 7 and 8). Pittenger et al.19 reported heterogeneity for the multilineage capacities of expanded colonies of cells isolated from bone marrow, suggesting a similar MSC and progenitor cell mixture is obtained in marrow harvests. Further work with the cells isolated by using the fibronectin adhesion is necessary to determine the most appropriate cohort of cells to be expanded for use in cartilage regenerative medicine.
Heterogeneity within the cartilage stem cells isolated from osteoarthritic tibial plateaux may be (a) a secondary result of extended ex vivo culture, (b) due to in vivo heterogeneity of variable phenotypes reflecting the natural repertoire of MSCs, or (c) due to the detachment of the cells from their in vivo niche,15 which can result in partial differentiation.20 A combination of these factors may also be responsible for the heterogeneity. Within diseased tissue, where there are active tissue degradation and inflammation-related events occurring, progenitor cells may be involved in different aspects of the reparative effort. Heterogeneity of the progenitor cell population within the tissue may, thus, allow for appropriate selection of specific cell types best suited for different situations. As suggested by Pevsner-Fischer et al.,15 homogeneous populations with limited differentiation capacities could be less effective for tissue repair and immunomodulation. Thus, finding a mixed population of stem cells as our data suggest may reflect the necessary variability required to regulate tissue homeostasis and drive tissue repair. However, it must be acknowledged that the stem cell population remaining in adult human articular cartilage appears unable to effect repair/regeneration in this tissue, which lacks the wound healing response of vascularized tissues. This insufficiency provides the stimulus for tissue engineering and regenerative medicine research for which these articular cartilage stem cells could be an effective, if not exclusive, component.
In summary, we have been able to provide evidence of a viable pool of stem cells within human OA cartilage using a validated method for stem cell isolation. More work is required to decipher the differences between the clonal cell lines and gain a greater understanding of the heterogeneity of stem-like cells in this tissue. With that information, it may be possible to select for the subpopulation of stem cells that have the best regenerative potential for articular cartilage cell therapies.
Footnotes
Acknowledgment and Funding: All of the work carried out in this study was done at Cardiff University, Cardiff. The work was fully funded by Joint Action—the research arm of the British Orthopaedic Association.
Declaration of Conflicting Interests: The author(s) declared no potential conflicts of interest with respect to the research, authorship, and/or publication of this article.
Ethical Approval: South East Wales Research Ethics Committee safety and ethical guidelines were followed.
References
- 1. Arthritis Research UK. Osteoarthritis in general practice; 2013. http://www.arthritisresearchuk.org/arthritis-information/data-and-statistics/osteoarthritis.aspx#sthash.iyZhVZzf.dpuf
- 2. Nelson L, Fairclough J, Archer CW. Use of stem cells in the biological repair of articular cartilage. Expert Opin Biol Ther. 2010;10:43-55. [DOI] [PubMed] [Google Scholar]
- 3. Csaki C, Schneider PR, Shakibaei M. Mesenchymal stem cells as a potential pool for cartilage tissue engineering. Ann Anat. 2008;190:395-412. [DOI] [PubMed] [Google Scholar]
- 4. Williams R, Khan IM, Richardson K, Nelson L, McCarthy HE, Analbelsi T, et al. Identification and clonal characterisation of a progenitor cell sub-population in normal human articular cartilage. PLoS One. 2010;5:e13246. [DOI] [PMC free article] [PubMed] [Google Scholar]
- 5. Koelling S, Kruegel J, Irmer M, Path JR, Sadowski B, Miro X, et al. Migratory chondrogenic progenitor cells from repair tissue during the later stages of human osteoarthritis. Cell Stem Cell. 2009;4:324-35. [DOI] [PubMed] [Google Scholar]
- 6. Alsalameh S, Amin R, Gemba T, Lotz M. Identification of mesenchymal progenitor cells in normal and osteoarthritic human articular cartilage. Arthritis Rheum. 2004;50:1522-32. [DOI] [PubMed] [Google Scholar]
- 7. Pretzel D, Linss S, Rochler S, Endres M, Kaps C, Alsalameh S, et al. Relative percentage and zonal distribution of mesenchymal progenitor cells in human osteoarthritic and normal cartilage. Arthritis Res Ther. 2011;13:R64. [DOI] [PMC free article] [PubMed] [Google Scholar]
- 8. Dowthwaite GP, Bishop JC, Redman SN, Khan IM, Rooney P, Evans DJ, et al. The surface of articular cartilage contains a progenitor cell population. J Cell Sci. 2004;117:889-97. [DOI] [PubMed] [Google Scholar]
- 9. Khan IM, Williams R, Archer CW. One flew over the progenitor’s nest: migratory cells find a home in osteoarthritic cartilage. Cell Stem Cell. 2009;4:282-4. [DOI] [PubMed] [Google Scholar]
- 10. McCarthy HE, Bara JJ, Brakspear K, Singhrao SK, Archer CW. The comparison of equine articular cartilage progenitor cells and bone marrow-derived stromal cells as potential cell sources for cartilage repair in the horse. Vet J. 2012;192(3):345-51. [DOI] [PubMed] [Google Scholar]
- 11. Fickert S, Fiedler J, Brenner RE. Identification of subpopulations with characteristics of mesenchymal progenitor cells from human osteoarthritic cartilage using triple staining for cell surface markers. Arthritis Res Ther. 2004;6:R422-32. [DOI] [PMC free article] [PubMed] [Google Scholar]
- 12. Jones PH, Watt FM. Separation of human epidermal stem cells from transit amplifying cells on the basis of differences in integrin function and expression. Cell. 1993;73:713-24. [DOI] [PubMed] [Google Scholar]
- 13. Koch TG, Heerkens T, Thomsen PD, Betts DH. Isolation of mesenchymal stem cells from equine umbilical cord blood. BMC Biotechnol. 2007;7:26. [DOI] [PMC free article] [PubMed] [Google Scholar]
- 14. Grogan SP, Miyaki S, Asahara H, D’Lima DD, Lotz MK. Mesenchymal progenitor cell markers in human articular cartilage: normal distribution and changes in osteoarthritis. Arthritis Res Ther. 2009;11:R85. [DOI] [PMC free article] [PubMed] [Google Scholar]
- 15. Pevsner-Fischer M, Levin S, Zipori D. The origins of mesenchymal stromal cell heterogeneity. Stem Cell Rev. 2011;7:560-8. [DOI] [PubMed] [Google Scholar]
- 16. Melero-Martin JM, Dowling MA, Smith M, Al-Rubeai M. Optimal in-vitro expansion of chondroprogenitor cells in monolayer culture. Biotechnol Bioeng. 2006;93:519-33. [DOI] [PubMed] [Google Scholar]
- 17. Chang HX, Yang L, Li Z, Chen G, Dai G. Age-related biological characterization of mesenchymal progenitor cells in human articular cartilage. Orthopedics. 2011;34:e382-8. [DOI] [PubMed] [Google Scholar]
- 18. Dealy C. Chondrogenic progenitors for cartilage repair and osteoarthritis treatment. Rheumatol Curr Res. 2012;S3-e001. [Google Scholar]
- 19. Pittenger MF, Mackay AM, Beck SC, Jaiswal RK, Douglas R, Mosca JD, et al. Multilineage potential of adult human mesenchymal stem cells. Science. 1999;284:143-7. [DOI] [PubMed] [Google Scholar]
- 20. Wagner W, Ho AD, Zenke M. Different facets of aging in human mesenchymal stem cells. Tissue Eng Part B Rev. 2010;16:445-53. [DOI] [PubMed] [Google Scholar]


