Abstract
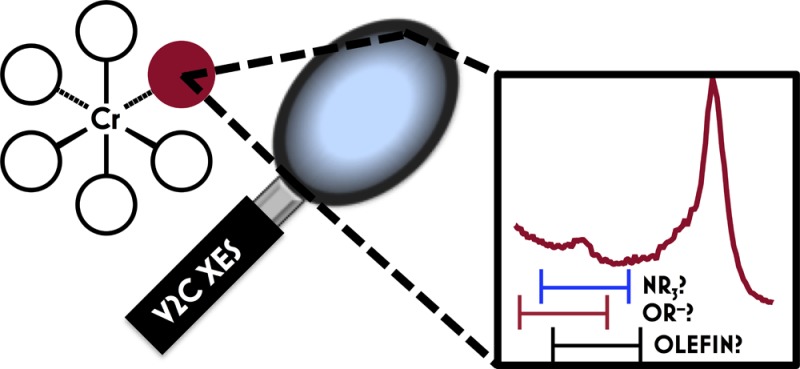
This paper explores the strengths and limitations of valence-to-core X-ray emission spectroscopy (V2C XES) as a probe of coordination environments. A library was assembled from spectra obtained for 12 diverse Cr complexes and used to calibrate density functional theory (DFT) calculations of V2C XES band energies. A functional dependence study was undertaken to benchmark predictive accuracy. All 7 functionals tested reproduce experimental V2C XES energies with an accuracy of 0.5 eV. Experimentally calibrated, DFT calculated V2C XES spectra of 90 Cr compounds were used to produce a quantitative spectrochemical series showing the V2C XES band energy ranges for ligands comprising 18 distinct classes. Substantial overlaps are detected in these ranges, which complicates the use of V2C XES to identify ligands in the coordination spheres of unknown Cr compounds. The ligand-dependent origins of V2C intensity are explored for a homologous series of [CrIII(NH3)5X]2+ (X = F, Cl, Br, and I) to rationalize the variable intensity contributions of these ligand classes.
Short abstract
Experimental data and density functional theory calculations that assess the ability of valence-to-core X-ray emission spectroscopy (V2C XES) to distinguish ligands coordinated to chromium are presented. Discussion extends to the factors dictating the intensity of features corresponding to ligand valence ns → metal 1s transitions.
Introduction
The identification of reactive intermediates is among the most direct routes to a mechanistic understanding of chemical transformations and catalysis. Particularly, NMR spectroscopy and X-ray crystallography have served as workhorse techniques in such pursuits. However, in cases of reaction mixtures containing paramagnetic transition-metal species, NMR is complicated and, in many cases, intractable. X-ray crystallography relies on ideal conditions for the formation of diffraction-quality crystals. Moreover, crystallographically characterized compounds isolated from reaction mixtures may not be relevant to the mechanisms under investigation.
Considering these weaknesses, inorganic and organometallic chemistry have seen the use of alternative methods for experimentally identifying constituent species in reaction mixtures. Electron paramagnetic resonance (EPR) fingerprints the types of paramagnetic species in reaction mixtures and quantifies their relative abundances. X-ray absorption spectroscopy (XAS) is an element-specific technique that probes oxidation states and valence electronic structure. In the present context, XAS can be used to monitor changes in oxidation state through the course of a chemical reaction.1 Furthermore, analysis of extended X-ray absorption fine structure (EXAFS) data affords metrical parameters (e.g., M–L bond distances) for transition-metal species without the need for single crystals.
Despite these and other established techniques, the mechanisms of many organometallic reactions remain controversial. Among the most challenging cases is the mechanism of Cr-catalyzed, selective oligomerization of ethylene to 1-hexene.2 The identities of the catalytically relevant Cr species and the active catalyst(s) formed following activation by methylaluminoxane (MAO) have eluded identification, despite a broad spectrum of analytical approaches, including EPR,3 XAS,3b,3c and ultraviolet–visible (UV-vis) spectroscopy.3a Activation of discrete molecular precatalysts by MAO destroys chemical coherence, leading to heterogeneous mixtures of variably coordinated Cr centers spanning several oxidation states. Many of these oxidation states have preferentially paramagnetic electronic configurations, precluding the use of NMR spectroscopy for precise species identification. EPR has been used to invoke the presence of certain oxidation states of Cr, but spin-counting studies have failed to account for the total Cr population.3c,4 This is in large part due to the presence of integer-spin Cr species that cannot be characterized by conventional continuous wave X-band EPR spectroscopy.5 Moreover, the Cr signals observed by EPR cannot be unambiguously assigned to specific Cr compounds. XAS data have also been reported; however, in these cases, conventional transmission or total fluorescence yield detection modes were employed. In such configurations, the XAS data collected report on the bulk Cr population, so only an average oxidation state of Cr in these reaction mixtures has been extracted.3b,3c Furthermore, the heterogeneity of these reaction systems complicates the analysis of EXAFS data, because multiple Cr centers will give rise to intractably convoluted scattering signals. Thus, Cr-catalyzed ethylene trimerization reactions showcase the shortcomings of the aforementioned methods that diminish their utility in characterizing intermediates.
Valence-to-core (V2C) X-ray emission spectroscopy (XES) offers an alternative approach to the structural characterization of organometallic species that overcomes many of the limitations associated with the previously discussed methods.1a Similar to XAS, sample constraints are virtually nonexistent: meaningful data can be collected for neat solid samples as well as dilute (ca. 1 mM metal) solutions. Data can be collected at cryogenic or ambient temperatures. Moreover, V2C XES can be collected for any transition-metal species, regardless of oxidation state or electronic configuration/spin state.
V2C XES information content complements XAS by delivering electronic structural information pertinent to bound ligands. V2C XES characterizes photons emitted following the energetic demotion of electrons occupying ligand (L)-centered frontier molecular orbitals to repopulate transition-metal (M) core holes generated by X-ray photoionization (Figure 1).1a,6 V2C XES is commonly measured following M 1s photoionization. Here, the V2C features cluster into Kβ″ bands resulting from L-valence s → M 1s transitions and Kβ2,5 bands corresponding to L-valence p → M 1s transitions. Because L-valence s-based molecular orbitals (MOs) minimally participate in M–L bonding, the relative energies of Kβ″ bands closely reflect predictable trends in L-valence s ionization energies.7 Consequently, Kβ″ transitions can be used to not only distinguish ligands by donor atoms,8 but also by the charges of these atoms. For example, Kβ″ peaks for Mn–N3–, Mn–NH2–, and Mn–NH2– are separated by ca. 1 eV per protonation state.9 This capability to distinguish bound ligands surpasses that of EXAFS, which has a Z ≥ 1 error in determination of proximal scatterers.
Figure 1.
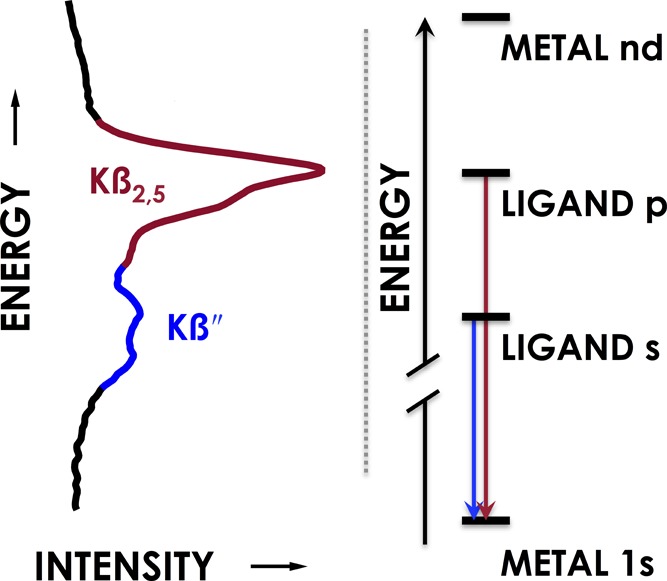
Example valence-to-core (V2C) spectrum with accompanying energy diagram.
Confidence in V2C XES spectral assignments has been strengthened by the development of a straightforward density functional theory (DFT) protocol in which transition energies are calculated as the one-electron orbital energy separations between the core-hole and the ligand frontier MOs.7 These calculated energy separations must be adjusted for each transition metal by experimental calibration, because of the poor modeling of core potentials by DFT.10 Calculated transition intensities are dictated principally by the electronic dipole matrix element between donor and acceptor orbitals. Combined V2C XES and DFT studies involving Ti,11 Mn,12 and Fe7,13 complexes have demonstrated remarkable agreement of calculated and experimental peak energies and their relative intensities following calibration. Consequently, V2C XES has been used to confidently characterize critical species involved in a variety of systems, including nitrogenase,8b photosystem II,14 Fe-ZSM-5,15 and hydrogenase.16 It should be noted that, in these cases, V2C XES data were used to complement characterization from additional structural and spectroscopic techniques.
In principle, the combination of V2C XES with DFT calculations offers a means to identify ligands coordinated to otherwise uncharacterized metal complexes. Moreover, collection of V2C XES intensity as a function of excitation energy permits the measurement of chemically targeted XAS, meaning that features corresponding to specific ligands should allow extraction of highly specific electronic and geometric structural information for individual components of reaction mixtures.17 However, through an experimentally calibrated DFT study of Cr V2C XES, we now show that caution must be used in such approaches. While the V2C XES spectra of characterized compounds are reproduced by DFT with reasonably high fidelity to experiment, statistical analysis of the V2C peak energies of distinct classes of ligands show that these features are rarely unambiguously diagnostic.
Experimental Section
General Considerations
Tetrahydrofuran (THF), benzene, dichloromethane, acetonitrile, n-pentane, and diethyl ether were dried via the method of Grubbs, using a custom-built solvent purification system. Where required, compounds were maintained under inert N2 atmospheres using Mbraun gloveboxes or standard Schlenk techniques. K2Cr2O7, Cr(CO)6, Cr(η6-C6H6)2, and Cr(η6-C6H6)(CO)3 were purchased from Sigma–Aldrich and used without further purification. Cp2Cr (Cp = cyclopentadienyl) was purchased from Strem and used without further purification. The following model compounds were prepared following literature procedures: Np4Cr (Np = neopentyl),18 Cr(OtBu)4,19 (tpfc)CrO (tpfc = tris(pentafluorophenyl)corrole),20 Cr(14-TMC)(O2)(Cl) (14-TMC = 1,4,8,11-tetramethyl-1,4,8,11-tetraazacyclotetradecane),21 [Cr(bpy3)](PF6)3 (bpy = 2,2′-bipyridine),22 [Cr(NH3)6](NO3)3,23 and (NH4)2[CrNCl4].24
Sample Preparation
Neat solid samples of Cr compounds were ground in an agate mortar and pressed into 1-mm aluminum spacers with a 3 mm × 5 mm rectangular hole. These spacers were sealed with 37-μm Kapton tape.
X-ray Emission Spectroscopy
All experimental data were obtained at the Cornell High Energy Synchrotron Radiation Source (CHESS) at the C-line end station under ring conditions of 5.3 GeV and 200 mA. A double-bounce multilayer monochromator was used upstream for energy selection, providing a ca. 90-eV band pass at 8000 eV. The C-line provides an incident flux of ca. 5 × 10¹² photons/s at ca. 8000 eV in a 1 mm vertical × 2 mm horizontal beam spot. A Rh-coated mirror was implemented upstream at a high angle for harmonic rejection. Cr Kβ X-ray emission spectra were measured using an 85-cm analyzer crystal spectrometer (using the 333 reflection of five Si 111 analyzer crystals) in combination with a Si drift diode detector aligned in a Rowland geometry, as described previously.13 The data were normalized with respect to the incident flux in an N2-filled ionization chamber just upstream of the samples. The space between the sample, the spherical analyzers and the detector was filled with He in order to minimize attenuation of the fluorescence. Data were collected at ca. 20 K in a Displex cryostat to minimize photoreduction and to maintain the samples in an inert atmosphere. Two scan types were employed: “full” scans comprising 360 points with 1 s count times spanned both the Kβ1,3 (Cr 3p → Cr 1s) line (5941.1–5962.7 eV) and the V2C region. In total, the “full” scans covered the region of 5941.1–5998.7. “Short” scans, comprised of 180 points with count times of 4 s spanned only the V2C region (5962.7–5998.7 eV). Three “short” scans were averaged for every “full” scan, with a total of 12–16 “short” scans collected per sample. Spectra were collected from multiple spots on each sample to assess sample integrity. All consecutive spectra were superimposable, indicating the lack of photodamage.
The experimental spectra were obtained by first separately averaging full scans and short scans in PyMCA and then merging the resultant average scans together to obtain the full spectra. Energy calibration was performed with a sample of K2Cr2O7 with experimental values for peak maxima taken from the literature.25 For each of the averaged spectra, the Kβ1,3 maximum was set to unit intensity, and the V2C region was least-squares fit using Igor Pro 6.0. The background tail from the Kβ1,3 main line and the V2C features were modeled using pseudo-Voigt lineshapes. Smoothed (25-point, fourth-order Savitzky–Golay)26 second derivatives were used to guide determination of the number of peaks to be fit.
DFT Calculations
All electronic structure and spectroscopic calculations were performed using version 2.90 and 3.00 of the ORCA computational chemistry package. Cr V2C XES spectra were calculated from geometry-optimized structures. Geometry optimizations and relaxed surface scans were performed using the BP86 functional,27 the zeroth-order regular approximation for relativistic effects (ZORA28), as implemented by van Wüllen,29 and the scalar-relativistically recontracted def2-TZVP(-f) basis set.30 Solvation was modeled using the conductor-like screening model (COSMO31) using a dielectric of 9.08 (CH2Cl2).
XES spectra were calculated using a one-electron theoretical protocol, as described previously.7 XES calculations were performed using BP86,27 B3LYP,32 PBE,33 PBE0,34 M06L,32 M06,35 and TPSSh36 functionals. The CP(PPP) basis set was used for Cr (with a special integration accuracy of 7) and the TZVP basis set was used for all other atoms. Solvation was modeled using COSMO in an infinite dielectric. The calculations used a dense integration grid (ORCA Grid4).
Results and Discussion
Experimental Cr V2C XES: Fitting and Qualitative Trends
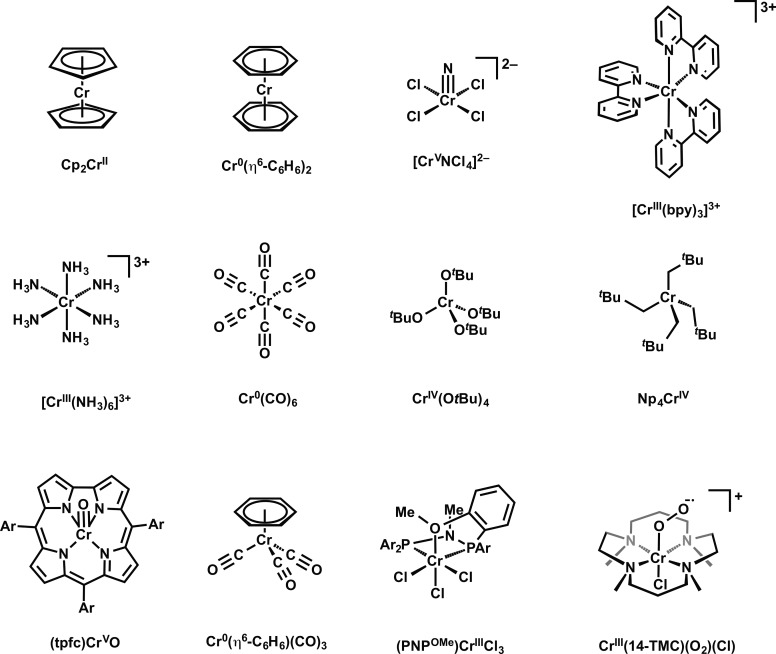
V2C XES data were obtained for 12 Cr complexes (Chart 1). This series is comprised of Cr in oxidation states of 0 (Cr), +2 (CrII), +3 (CrIII), +4 (CrIV), and +5 (CrV). Molecules were chosen to span the diversity of commonly encountered ligands, with donor atoms including C, N, O, P, Cl, and S. Data were normalized by setting the Kβ1,3 “main line” feature to unit intensity. While data are more appropriately normalized by integrating the total intensity of the Kβ main line and V2C regions and setting this total area to unity, the large Bragg angle necessary for collection of data in the Cr Kβ/V2C energy range physically prohibited scans to energies sufficiently low for recording full Kβ main lines. Regardless, the intrinsically low signal-to-noise ratios encountered for V2C data confer large uncertainty values when fitting these peak areas. Thus, we have elected to principally focus our study on the V2C energy domain.
Chart 1. Structures of Cr Compounds and Complex Ions Used for V2C XES Calibrationa.
a For (tpfc)CrO, Ar = pentafluorophenyl; for (PNPOMe)CrCl3, Ar = 2-methoxyphenyl.
V2C peak maxima were determined from pseudo-Voigt least-squares fits to the data, with background modeled by fitting a pseudo-Voigt feature to the Kβ1,3 tail. All fitted peaks were observed in smoothed second derivatives of the data. A representative fit and smoothed second derivative are given in Figure 2, and the remaining experimental spectral data are included in the Supporting Information. Peak maxima along with fitting errors are compiled in Table 1. These fitting errors range from values that are below the spectrometer-defined experimental energy resolution of 0.37 eV to values as high as 1.5–3 eV. These high errors were encountered when fitting weak Kβ″ features close to Kβ1,3 tails and when fitting Kβ2,5 shoulders. The average error found in fitting the entire set of peak positions was 0.65 ± 0.13 eV. Exclusion of features with fitting errors larger than 1.5 eV reduces this error to 0.39 ± 0.06 eV.
Figure 2.
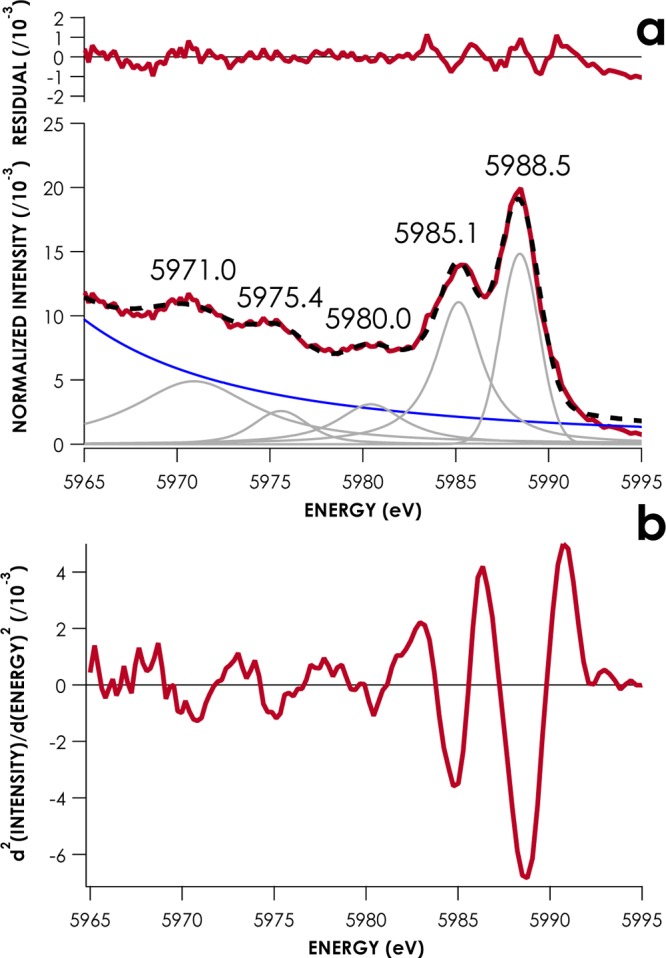
(a) Least-squares fit of pseudo-Voigt lineshapes to the V2C XES spectrum of Cp2Cr. Experimental data are red, fitted data are dashed black. Individual pseudo-Voigt peaks are gray, and the modeled Kβ main line background is blue. (b) Savitsky–Golay smoothed second derivative V2C XES spectrum of Cp2Cr, showing five peaks.
Table 1. V2C XES Peak Energies and Kβ″ Assignments.
| compound | Kβ″ (eV)a | assignment | Kβ2,5 (eV)a |
|---|---|---|---|
| Cp2Cr | 5971.0 (1.4) | C 2s → Cr 1s | 5980.0 (1.6) |
| 5975.4 (0.4) | C 2s → Cr 1s | 5985.1 (0.1) | |
| 5988.5 (0.1) | |||
| Cr(η6-C6H6)2 | 5970.9 (0.3) | C 2s → Cr 1s | 5980.8 (0.7) |
| 5973.6 (0.2) | C 2s → Cr 1s | 5985.3 (0.6) | |
| 5986.5 (0.1) | |||
| (NH4)2[CrNCl4] | 5978.5 (0.1) | N 2s → Cr 1s | 5988.6 (0.1) |
| [Cr(bpy)3](PF6)3 | 5970.6 (0.9) | N 2s → Cr 1s | 5982.9 (3.2) |
| 5975.1 (0.8) | N 2s → Cr 1s | 5986.6 (0.1) | |
| 5989.1 (0.1) | |||
| [Cr(NH3)6](NO3)3 | 5972.7 (0.3) | N 2s → Cr 1s | 5984.4 (0.4) |
| 5988.2 (0.0) | |||
| Cr(CO)6 | 5980.3 (0.2) | σ*C 2s–O 2s → Cr 1s | 5984.3 (0.0) |
| Cr(OtBu)4 | 5972.9 (1.2) | O 2s → Cr 1s | 5986.4 (0.3) |
| Np4Cr | 5976.8 (0.3) | C 2s → Cr 1s | 5984.3 (0.4) |
| 5988.7 (0.1) | |||
| (tpfc)CrO | 5972.9 (0.2) | O 2s → Cr 1s | 5984.6 (3.1) |
| 5988.4 (0.2) | |||
| Cr(η6-C6H6)(CO)3 | 5972.8 (0.6) | C 2s → Cr 1s | 5979.9 (0.1) |
| 5984.4 (0.0) | |||
| 5987.1 (0.1) | |||
| (PNPOMe)CrCl3 | 5977.2 (1.2) | P/Cl 3s → Cr 1s | 5987.6 (0.1) |
| Cr(14-TMC)(O2)(Cl) | 5971.1 (1.3) | O 2s → Cr 1s | 5984.3 (1.6) |
| 5988.3 (0.2) |
Standard errors from least-squares fitting of peak positions are given in parentheses.
Kβ″ features were observed for all analyzed compounds. Cr(CO)6 is expected to have two Kβ″ features, because the CO C 2s orbitals form σ and σ* combinations with O 2s. Only the σ*C 2s–O 2s is observed; the inability to observe the second Kβ″ feature can be attributed to poor overlap of the CO σC 2s–O 2s with Cr 3p, as has been discussed elsewhere for Fe carbonyls.37 It is tempting at this point to formulate a spectrochemical series that uses the relative positions of Kβ″ features to identify bound ligands. Based on these experimental data, such a series would follow expected trends in donor atom ionization energies (IEs), with perturbations to these energies arising due to variations in substitution patterns and charge/protonation states. Others have suggested that donor substitution patterns and other second-sphere effects result in only minor shifts to V2C band energies, although a systematic analysis for multiple molecules within diverse series of ligands has not been reported for any metal.35 Our analysis neglects Kβ2,5 features, which occupy a much narrower energy range and are more strongly affected by metal–ligand covalency.7,8b,12b,15 Both of these features render resolution of individual, ligand-specific transitions within the Kβ2,5 regions largely intractable.
To explore the robustness of a Kβ″ spectrochemical series and to evaluate its utility in identifying unknown ligands, we have used DFT to extend our spectral library to include an additional 90 previously reported Cr compounds of known electronic and geometric structure. This expanded library features compounds whose inner coordination spheres include a variety of commonly encountered ligands in organometallic and coordination chemistry. To confirm the veracity of using such calculated data to construct this series, we will first critically evaluate the accuracy of DFT-calculated Cr V2C XES.
Calculated Cr V2C XES: Reproducing Experimental Data
Prior work has shown that DFT predicts V2C band energies with high fidelity to experiment following calibration.7−9,11−13,16,37 The case is no different for Cr; there is a strong (R2 = 0.99) correlation between the energies of experimentally well-resolved V2C bands (fitting error of <1.5 eV) from the 12 compound experimental library and V2C band energies calculated for these compounds using the BP86 density functional and the scalar relativistically recontracted def2-TZVP basis set (Figure 3). All of the calculated spectra were generated using coordinates with geometries optimized by BP86. To date, V2C calibration studies have involved simple scalar adjustments to align calculated band energies with the experiment.7,12a This protocol accounts for the large systematic errors encountered when using DFT to calculate core orbital potentials.10 The scalar correction found for V2C calculations employing BP86/def2-TZVP-ZORA is 66.0 ± 0.8 eV. (Scalar and linear correlation coefficents for calculated V2C XES spectra are presented in Table 2.)
Figure 3.
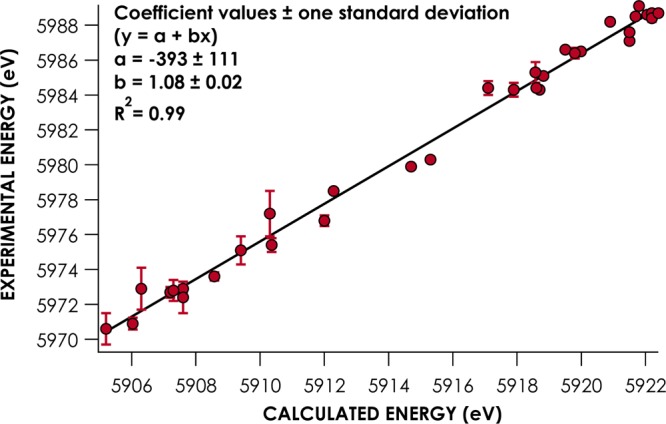
Correlation of experimental Cr V2C XES band energies with energies calculated using BP86/def2-TZVP-ZORA.
Table 2. Scalar and Linear Correlation Coefficients for Calculated V2C XES Spectra.
| functional | scalar correction (eV) | average scalar |ΔE|a (eV) | linear correlation slope | average linear |ΔE|b (eV) |
|---|---|---|---|---|
| BP86 | 66.0 ± 0.8 | 0.68 ± 0.06 | 1.08 ± 0.02 | 0.53 ± 0.07 |
| B3LYP | 35.0 ± 0.6 | 0.46 ± 0.05 | 1.00 ± 0.01 | 0.47 ± 0.05 |
| PBE | 68.3 ± 0.8 | 0.71 ± 0.07 | 1.09 ± 0.02 | 0.57 ± 0.07 |
| PBE0 | 27.7 ± 0.6 | 0.49 ± 0.05 | 0.98 ± 0.02 | 0.47 ± 0.05 |
| M06L | 48.1 ± 0.6 | 0.50 ± 0.05 | 1.00 ± 0.01 | 0.54 ± 0.05 |
| M06 | 28.4 ± 0.6 | 0.51 ± 0.05 | 1.01 ± 0.02 | 0.54 ± 0.05 |
| TPSSh | 40.3 ± 0.6 | 0.54 ± 0.05 | 1.02 ± 0.02 | 0.52 ± 0.05 |
Absolute value of the magnitude of the difference between experimental V2C XES energies and those calculated by DFT following a scalar energy shift.
Absolute value of the magnitude of the difference between experimental V2C XES energies and those calculated by DFT following a linear energy correction.
The true accuracy of the V2C energy predictions is better judged using the average value of the magnitude of the difference between calculated and experimental values, |ΔE|. For the scalar-corrected data, |ΔE| is 0.68 ± 0.06 eV. However, it should be noted that for the BP86 calculations, the slope fitted for the correlation is not unity, but rather has a value of 1.08 ± 0.02. A linear correction appears necessary to account for smaller systematic errors introduced in calculating the energies of occupied frontier orbitals. Using this linear correction, |ΔE| decreases to 0.54 ± 0.07 eV. Comparison of a linearly corrected BP86 calculated V2C XES spectrum with a scalar corrected spectrum experiment is shown referenced to experimental data in Figure 4.
Figure 4.
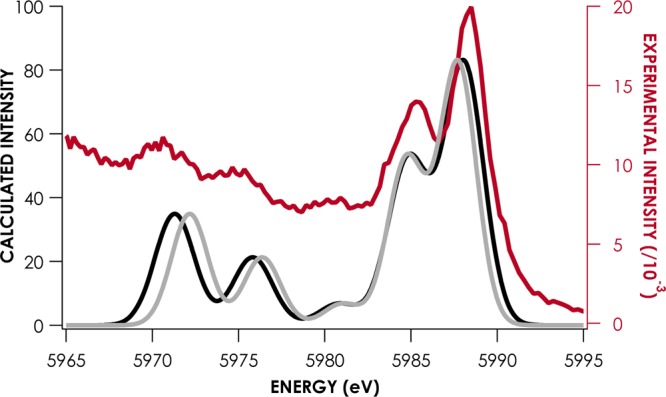
Experimental (red) and BP86/def2-TZVP-ZORA calculated (linear-corrected, black; scalar-shifted, gray) V2C XES spectra for Cp2Cr.
V2C XES spectra for the experimental library of compounds were recalculated using six additional functionals spanning generalized gradient approximation (GGA), hybrid, and hybrid-meta GGA types. All calculations used the same BP86-optimized coordinates for each molecule. The def2-TZVP-ZORA basis set was used for all ligand atoms in these calculations. When using BP86 and PBE, a linear correlation leads to a significant improvement in |ΔE|. For all other tested functionals, application of a linear correction does not significantly alter |ΔE|.
This scenario is a manifestation of Koopmans’ theorem,38 and its discussion has precedence with Stowasser and Hoffmann,39 who noted that both occupied and virtual orbital energies calculated with GGA functionals such as BP86 could be aligned with IEs using a linear scaling factor. On the other hand, Hartree–Fock (HF) mixing in hybrid functionals such as B3LYP ameliorates the need for such a correction, because HF orbital energies more closely reflect IEs. This observation was further elaborated by Zhan and co-workers,40 who extended the use of this linear relationship to other physical properties. As discussed previously,13 V2C XES band energies are a close facsimile to ionization energies, although relative energy separations are slightly perturbed by core hole relaxation effects.
These results show that DFT calculations yield Cr V2C XES energies within 0.5 eV of the experimental value, regardless of functional choice. Aligning V2C energies calculated with pure local and gradient corrected functionals to experimental values required a linear correction to achieve the best agreement, but this agreement matches that exhibited by hybrid and metahybrid functionals.
Calculated Cr V2C XES Energies: Toward Identifying Unknown Ligands
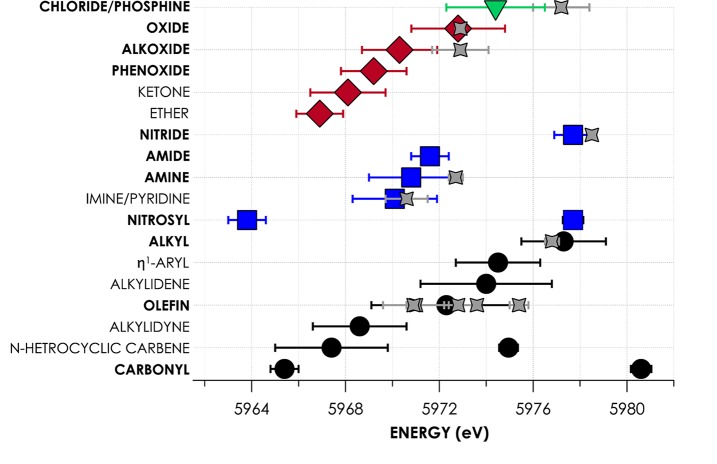
Having established that DFT calculations predict Cr V2C XES energies with an acceptably small error of 0.5 eV, we generated spectra for the 90 previously reported and structurally characterized compounds. Spectra were calculated using the BP86 functional to best balance accuracy with computational expense and were adjusted in the energy domain using the experimentally derived linear correction. All calculations used atomic coordinates that were geometry optimized from crystallographically determined solid-state structures. From these spectra were determined the energies of Kβ″ features corresponding to commonly encountered ligands. These energies were averaged and assembled into a more comprehensive and quantitative spectrochemical series (see Figure 5). No distinction by Cr oxidation state was made among the evaluated compounds, in accord with previously established reports, indicating that metal oxidation states principally influence V2C intensities while having negligible effects on V2C energies.7,9,12a,15
Figure 5.
Plotted spectrochemical series displaying the average energies of experimentally calibrated, DFT-calculated Kβ″ for ligands grouped by donor atom. Error bars represent doubled standard deviations. Gray points indicate experimental Kβ″ energies corresponding to the indicated ligands, with error bars derived from fits to experimental spectra. Ligands indicated in bold are predicted to significantly contribute intensity to Kβ″ regions, while nonbolded ligands are expected to be difficult to resolve with current experimental limitations.
We considered 18 classes of ligand and calculated V2C XES spectra for multiple (n ≥ 5) compounds with ligands representing members of these classes. We noted that several common classes of ligand including carbenes and ethers contributed insignificantly to Kβ″ intensities, and thus are unlikely to be observed experimentally with current instrumentation. The vanishingly small contributions to Kβ″ intensity from such ligands are considered below.
Expected trends are observed when considering solely the averaged energies predicted for Cr Kβ″ bands. For example, Kβ″ band energies increase on proceeding from O to C in the monoanionic series comprising alkoxide, amide, and alkyl ligands, in accord with decreasing ionization energies of these ligands, relative to one another. However, what must be noted are the considerable deviations in ligand electronic structure giving rise to large uncertainty ranges for Kβ″ energies. These deviations may be attributed in part to differential substitution within classes of ligands (e.g., for olefins: H2C=CH2 vs H2C=C(Me)H). Perturbations will also arise due to the other ligands in the inner coordination sphere, which will effect molecular charge redistributions that will influence donor atom ionization energies. Variations in Cr–L distances can be expected in both situations. The resulting perturbations to Cr–L overlap manifest in the observed distributions of Kβ″ energies. The consequent overlaps in Kβ″ energy ranges displayed by several ligand classes affirm that chemical intuition and complementary techniques must be used to narrow the parameter space when considering V2C XES as a probe of inner-sphere coordination.
Cr V2C XES Intensities
Quantitative comparison of experimental to calculated V2C intensities is not justified in the present case because the absence of Kβ′ data (due to the inaccessibility of these Bragg angles by our spectrometer) precludes rigorous normalization across the entire Kβ XES window. From a qualitative perspective, relative band intensities tend to be reproduced well for our set of calculated Cr V2C spectra (see Figure 4, as well as Figures S1–S11 in the Supporting Information). DFT appears to overestimate the contributions of Kβ″, relative to Kβ2,5 transitions in the V2C region. However, Delgado-Jaime and co-workers have evaluated this discrepancy in Fe carbonyl compounds.37 In considering that Fe np orbital admixture confers electric dipole allowedness to V2C transitions, the authors noted that the contracted L ns-based MOs participating in Kβ″ transitions show greater Fe 4p admixture, while the L np-based MOs participating in the Kβ2,5 transitions have greater Fe 3p contributions. Excited states arising from the demotion of electrons in orbitals with Fe 3p character will exhibit different relaxation rates from excited states whose electron holes are of Fe 4p character. The DFT method used to calculate V2C XES is a one-electron, single-determinant approach that consequently does not include effects such as electronic relaxation. As a result, the relative intensities of Kβ″ bands to Kβ2,5 in V2C XES spectra will not be properly reproduced by DFT.
Nevertheless, strong correlations between experimental and DFT-calculated total V2C XES areas have been reported in calibration studies for several metals. Spurred by this precedence of fidelity between experiment and theory, we examined the relationship between the nature of Cr-bound ligands and their Kβ″ intensities to understand the inability to observe ligands such as carbenes and ethers. Recalling that Cr Kβ″ features are effectively ligand-to-metal charge-transfer features, the intensities of these features are expected to be dependent on the magnitude of overlap between orbitals involved in the transitions. Multiple authors have examined this dependence by considering the relationship between V2C intensities and M–L distances.7,41 In all cases, an inverse exponential dependence is exhibited between M–L distance and V2C intensity. These studies have typically considered such dependences with a single ligand.
To further explore the dependence of V2C intensity on M–L overlap, we produced in silico a series of d3, S = 3/2 [CrIII(NH3)5X]2+ complexes (X = F, Cl, Br, and I). For each complex, the geometry was relaxed with the Cr–X distance held constant at 0.11 Å increments from 1.75 to 2.85 Å. V2C XES spectra were calculated for each geometry, and the X ns → Cr 1s Kβ″ intensities were plotted as a function of Cr–X distance (Figure 6). The expected inverse exponential distance dependences are observed. It is noteworthy that I– in all cases contributes the largest intensity at all distances, while emissions from F– are the weakest. At a given distance, the more decontracted I 5s orbital is expected to have the most overlap with Cr np. Consequently, the corresponding Kβ″ transition will gain the most intensity through the electronic dipole mechanism, compared to the other halides. This is borne out in analysis of the orbital coefficients—at a given Cr–X distance, the admixture of halide valence ns character with Cr np rises from F– to I– (Figure 7). The rise in Cr np character and, by extension, Cr–X overlap is most dramatic from F– to Cl–, while smaller and relatively consistent increases are noted when going from Cl– to I–. A larger gap is encountered in Cr np character when going from Br– to I– than in Cl– to Br–, which may be attributable to the relativistic decontraction of the I 5s orbital, as mentioned previously.
Figure 6.
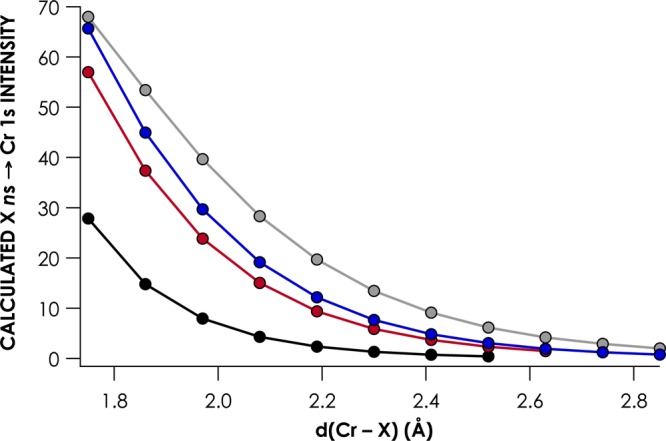
Dependence of the intensity of X ns → Cr 1s Kβ″ transitions for the series [CrIII(NH3)5X]2+ (X = F (black), Cl (red), Br (blue), and I (gray)) on the Cr–X distance.
Figure 7.
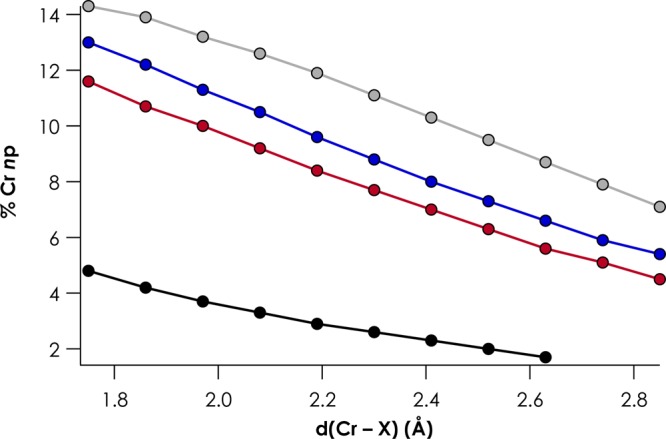
Dependence of the admixture between X valence ns and Cr np for the series [CrIII(NH3)5X]2+ (X = F (black), Cl (red), Br (blue), and I (gray)) on the Cr–X distance.
Lee and co-workers noted that in Fe V2C XES, the Kβ″ features for third-row ligands (P, S, and Cl donors) are predicted to have weaker intensities than their lighter congeners.7 In analyzing the trends in Figures 6 and 7, it becomes apparent that considering the magnitude of Cr np character alone is not sufficient to fully explain the trends in Kβ″ intensities. For example, at a distance of 2.52 Å, there is 9.5% Cr np character mixed with the I 5s orbital, while there is only 2.0% Cr np character mixed with the F 2s orbital. The corresponding Kβ″ intensities are 6.16 for I– and 0.43 for F– (Figure 6). However, when the Cr–F distance is 1.97 Å, 3.7% Cr np character is sufficient to produce 7.96 units of Kβ″ intensity. The discrepancy may arise due to the ability of more decontracted ligand orbitals (such as I 5s) to interact to varying extents with metal 4p rather than 3p orbitals, which will have pronounced effects on the local (metal) contribution to the Kβ″ transition dipole moment.12a
The behavior of Kβ″ features, with respect to Cr–L orbital overlap, was explored further by considering the Cr–L distance dependences of calculated Kβ″ intensities and calculated Kβ″ energies. In Figure 8, we show that, for [CrIII(NH3)5F]2+, the calculated intensity and energy of the F 2s → Cr 1s Kβ″ are inversely correlated across the range of Cr–F distances considered. This behavior follows quite simply from the relationship between orbital overlap and MO interaction energy: as the overlap between F 2s and Cr np increases, the F 2s orbital will be stabilized. Consequently, the energy gap between F 2s and Cr 1s will shrink with the attendant increase in Kβ″ intensity.
Figure 8.
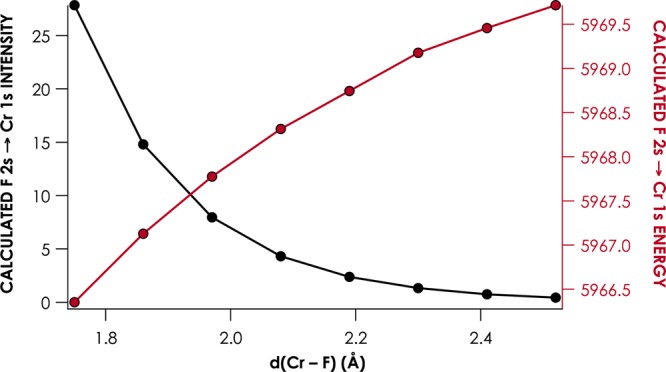
Dependence of the calculated intensity (black) and energy (red) of the F 2s → Cr 1s Kβ″ transition for [CrIII(NH3)5F]2+, relative to Cr–X distance.
Having explored the correlation between Cr np – L n′s overlap and Kβ″ intensity, we may return to the consideration of ligands such as carbenes and ethers that are essentially “invisible” in the Kβ″ regions of V2C XES. We expanded our series of [CrIII(NH3)5L]n+ to consider different classes of C, N, and O donors. The Kβ″ energies, intensities, and geometry-optimized Cr–L bond lengths in these compounds are compiled in Table 3. Kβ″ intensities decrease, albeit with some scatter, as Cr–L bond distances elongate (Figure 9a). More interesting trends emerge when considering the relationship between Kβ″ intensities and L 2s orbital coefficients. Kβ″ intensities correlate modestly (R2 = 0.87) with the donor atom 2s orbital coefficients of MOs calculated for unbound C-, N-, O-, and F-donor ligands (Figure 9b). However, it must be remembered that equilibrium Cr–L distances vary for these different classes of ligand. When the Cr–L distances are held constant at 1.9 Å, Kβ″ intensities for ligands grouped by donor atom show strong (R2 = 0.90–0.99) linear correlations to L 2s orbital coefficients (Figure 9c). Moreover, the slopes of these linear correlations increase markedly as the donor atom goes from F to C, consistent with L 2s orbital decontraction as the atomic number decreases.
Table 3. Calculated L Kβ″ Intensities and Orbital Coefficients for Hypothetical [CrIII(NH3)5L]n+ Complexes.
| L | equilibrium Cr–L distance (Å) | L 2s %a | calculated Kβ″ intensity at equilibrium Cr–L distance | calculated Kβ″ intensity at Cr–L distance of 1.9 Å | |
|---|---|---|---|---|---|
| Carbon | CH3 | 2.08 | 46.8 | 5.4 | 10.2 |
| η1-C6H5 | 2.06 | 4.4 | 1.7 | 1.3 | |
| CO | 2.10 | 45.1 | 5.6 | 14 | |
| NHCb | 2.13 | 12.5 | 0.8 | 3.3 | |
| Nitrogen | pyridine | 2.08 | 6.8 | 1.8 | 0.8 |
| tBuN | 1.85 | 33.9 | 6.3 | 5.2 | |
| N | 1.81 | 100.0 | 27.4 | 19.2 | |
| Oxygen | THF | 2.03 | 49.2 | 3.6 | 7.6 |
| tBuO | 1.87 | 43.4 | 7.5 | 6.4 | |
| O | 1.77 | 100.0 | 27.0 | 14.8 | |
| Fluorine | F | 1.85 | 100.0 | 15.8 | 11.8 |
Calculated donor-atom 2s character from Löwdin population analysis of unbound ligand L.
NHC = 1,3-dimethylimidazolium-2-yl.
Figure 9.
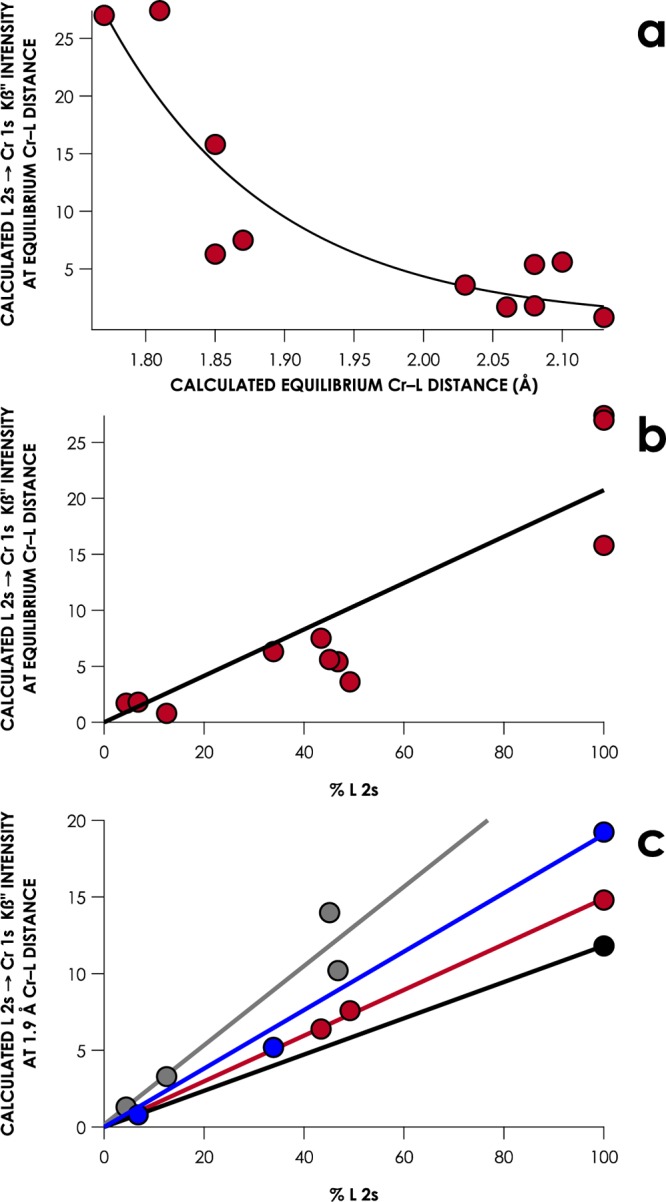
(a) Plot of calculated Kβ″ intensities as a function of calculated equilibrium Cr–L distances for theoretical compounds listed in Table 3. (b) Plot of calculated Kβ″ intensity at calculated equilibrium Cr–L distances as a function of donor atom 2s character in the free L orbital corresponding to the MO involved in the XES transition for theoretical compounds listed in Table 3 (R2 = 0.80). (c) Plot of calculated Kβ″ intensity at a fixed Cr–L distance of 1.9 Å, as a function of donor atom 2s character in the free L-orbital, corresponding to the MO involved in the XES transition for theoretical compounds listed in Table 3. Data points are grouped by donor atom and linear correlations are constrained to a y-intercept of 0. F, black and O, red (R2 = 0.99); N, blue (R2 = 0.99); C, gray (R2 = 0.91).
The ability to resolve Kβ″ features corresponding to Cr-bound ligands relies heavily on Cr np – L n′s orbital overlap. This manifests in the recognized dependence of V2C intensity on the M–L distance.41 However, additional consideration must be made for the natures of the interacting orbitals. M–L orbital overlap will be dramatically influenced by delocalization of the donor orbital by admixture with orbitals of noncoordinating atoms within the ligand. Thus, ligands such as THF exhibit small contributions to Kβ″ regions not only because they interact at long distances, but also because the O 2s orbital is heavily mixed with neighboring C 2s orbitals to form the C–O bonds of the heterocycle. Moreover, O-donor ligands can be expected to have systematically lower Kβ″ contributions than C and N donors, because of O 2s orbital contraction. Similar considerations may be made for comparison of second-row donors to heavier ligands: large covalent radii will attenuate orbital overlap. Moreover, as radial diffusion of ns orbitals increases in progressively larger ligands, overlap will diminish further. This discussion readily extends to V2C XES of the remaining 3d metals. A similar consideration may be made for overlap of metal np-orbitals with ligand orbitals, where the rising Zeff of later metals results in attenuated M–L overlap. This is borne out in the progression to weaker experimental V2C intensities upon going from early metals to late metals, which has been discussed by Beckwith and co-workers.12a
Conclusions
Kβ″ bands in V2C XES show significant ligand sensitivity, and these band energies correlate strongly with the energies calculated by DFT. Benchmarking multiple functionals shows that DFT consistently predicts Cr V2C XES band energies within 0.5 eV. Based on the experimental calibration, the ranges exhibited by Kβ″ band energies overlap for the several classes of ligands whose Kβ″ transitions are predicted to contribute significant spectral intensity. These overlaps show that (i) despite their substantial ligand sensitivity, Kβ″ energies alone are not diagnostic of the class of coordinated ligand and (ii) caution must be exercised when using V2C XES as a tool to characterize the inner coordination spheres of unknown transition-metal complexes.
The assembled spectral library suggests that some ligand classes such as carbenes and ethers are unlikely to contribute sufficient Kβ″ intensity to be resolved in V2C XES spectra. Thus, consideration was given to the origins of Kβ″ intensity in V2C spectra. This intensity principally reflects the magnitude of M–L orbital overlap, which gives rise to a pronounced dependence of Kβ″ on M–L distance. Our work shows that this overlap is also significantly governed by the nature of the interacting orbitals. A trend was observed in the relative intensities of Kβ″ features from ligands with 2s donor orbitals. As ligand Zeff rises, the 2s orbital becomes more contracted, resulting in a progression to weaker Kβ″ intensities. Delocalization of ligand donor MOs off of the donor atom affords a further means by which Kβ″ intensities are attenuated. Consequently, ligands with very localized donor orbitals such as N3– can be expected to contribute substantial Kβ″ intensity, while ligands such as N-heterocyclic carbenes will be challenging to resolve.
Acknowledgments
We thank Kenneth D. Finkelstein, Myung K. Jeon, and Kaitlin E. Schrote for assistance with X-ray data collection. This work was supported by a startup grant to K.M.L. from Cornell University. R.C.W. was supported by the National Institutes of Health, Award Number T32GM008500 from the National Institute of General Medical Sciences. T.J.M. thanks the Oticon Foundation and Knud Højgaards Foundation for travel grants in support of this work. This work is based in part upon research conducted at the Cornell High Energy Synchrotron Source (CHESS), which is supported by the National Science Foundation (NSF) and the National Institutes of Health/National Institute of General Medical Sciences (under NSF Award No. DMR-0936374).
Supporting Information Available
Fitted experimental data, example ORCA input files, and spin state, charge, and geometry optimized coordinates for all calculated compounds. This material is available free of charge via the Internet at http://pubs.acs.org.
The authors declare no competing financial interest.
Funding Statement
National Institutes of Health, United States
Supplementary Material
References
- a Glatzel P.; Bergmann U. Coord. Chem. Rev. 2005, 249, 65–95. [Google Scholar]; b Singh J.; Lamberti C.; van Bokhoven J. A. Chem. Soc. Rev. 2010, 39, 4754–4766. [DOI] [PubMed] [Google Scholar]; c Kanan M. W.; Yano J.; Surendranath Y.; Dinca M.; Yachandra V. K.; Nocera D. G. J. Am. Chem. Soc. 2010, 132, 13692–13701. [DOI] [PubMed] [Google Scholar]
- a Agapie T. Coord. Chem. Rev. 2011, 255, 861–880. [Google Scholar]; b McGuinness D. S. Chem. Rev. 2010, 111, 2321–2341. [DOI] [PubMed] [Google Scholar]
- a Do L. H.; Labinger J. A.; Bercaw J. E. ACS Catal. 2013, 3, 2582–2585. [DOI] [PMC free article] [PubMed] [Google Scholar]; b Moulin J. O.; Evans J.; McGuinness D. S.; Reid G.; Rucklidge A. J.; Tooze R. P.; Tromp M. Dalton Trans. 2008, 1177–1185. [DOI] [PubMed] [Google Scholar]; c Rabeah J.; Bauer M.; Baumann W.; McConnell A. E. C.; Gabrielli W. F.; Webb P. B.; Selent D.; Brückner A. ACS Catal. 2012, 3, 95–102. [Google Scholar]; d Skobelev I. Y.; Panchenko V. N.; Lyakin O. Y.; Bryliakov K. P.; Zakharov V. A.; Talsi E. P. Organometallics 2010, 29, 2943–2950. [Google Scholar]
- Brückner A.; Jabor J. K.; McConnell A. E.; Webb P. B. Organometallics 2008, 27, 3849–3856. [Google Scholar]
- Krzystek J.; Ozarowski A.; Telser J. Coord. Chem. Rev. 2006, 250, 2308–2324. [Google Scholar]
- Pollock C. J.; DeBeer S. J. Am. Chem. Soc. 2011, 133, 5594–5601. [DOI] [PubMed] [Google Scholar]
- Lee N.; Petrenko T.; Bergmann U.; Neese F.; DeBeer S. J. Am. Chem. Soc. 2010, 132, 9715–9727. [DOI] [PubMed] [Google Scholar]
- a Delgado-Jaime M. U.; Dible B. R.; Chiang K. P.; Brennessel W. W.; Bergmann U.; Holland P. L.; DeBeer S. Inorg. Chem. 2011, 50, 10709–10717. [DOI] [PMC free article] [PubMed] [Google Scholar]; b Lancaster K. M.; Roemelt M.; Ettenhuber P.; Hu Y.; Ribbe M. W.; Neese F.; Bergmann U.; DeBeer S. Science 2011, 334, 974–977. [DOI] [PMC free article] [PubMed] [Google Scholar]
- Kropp H.; King A. E.; Khusniyarov M. M.; Heinemann F. W.; Lancaster K. M.; DeBeer S.; Bill E.; Meyer K. J. Am. Chem. Soc. 2012, 134, 15538–15544. [DOI] [PubMed] [Google Scholar]
- DeBeer George S.; Petrenko T.; Neese F. J. Phys. Chem. A 2008, 112, 12936–12943. [DOI] [PubMed] [Google Scholar]
- Swarbrick J. C.; Kvashnin Y.; Schulte K.; Seenivasan K.; Lamberti C.; Glatzel P. Inorg. Chem. 2010, 49, 8323–8332. [DOI] [PubMed] [Google Scholar]
- a Beckwith M. A.; Roemelt M.; Collomb M.-N.; DuBoc C.; Weng T.-C.; Bergmann U.; Glatzel P.; Neese F.; DeBeer S. Inorg. Chem. 2011, 50, 8397–8409. [DOI] [PubMed] [Google Scholar]; b Lassalle-Kaiser B.; Boron T. T. III; Krewald V.; Kern J.; Beckwith M. A.; Delgado-Jaime M. U.; Schroeder H.; Alonso-Mori R.; Nordlund D.; Weng T.-C. Inorg. Chem. 2013, 52, 12915–12922. [DOI] [PMC free article] [PubMed] [Google Scholar]
- Lancaster K. M.; Finkelstein K. D.; DeBeer S. Inorg. Chem. 2011, 50146767–6774. [DOI] [PubMed] [Google Scholar]
- Pushkar Y.; Long X.; Glatzel P.; Brudvig G. W.; Dismukes G. C.; Collins T. J.; Yachandra V. K.; Yano J.; Bergmann U. Angew. Chem., Int. Ed. 2010, 49, 800–803. [DOI] [PMC free article] [PubMed] [Google Scholar]
- Boubnov A.; Carvalho H. W.; Doronkin D. E.; Günter T.; Gallo E.; Atkins A. J.; Jacob C. R.; Grunwaldt J.-D. J. Am. Chem. Soc. 2014, 136, 13006–13015. [DOI] [PubMed] [Google Scholar]
- Lambertz C.; Chernev P.; Klingan K.; Leidel N.; Sigfridsson K. G.; Happe T.; Haumann M. Chem. Sci. 2014, 5, 1187–1203. [Google Scholar]
- Hall E. R.; Pollock C. J.; Bendix J.; Collins T. J.; Glatzel P.; DeBeer S. J. Am. Chem. Soc. 2014, 136, 10076–10084. [DOI] [PubMed] [Google Scholar]
- Schulzke C.; Enright D.; Sugiyama H.; LeBlanc G.; Gambarotta S.; Yap G. P. A.; Thompson L. K.; Wilson D. R.; Duchateau R. Organometallics 2002, 21, 3810–3816. [Google Scholar]
- Alyea E. C.; Basi J. S.; Bradley D. C.; Chisholm M. H. J. Chem. Soc. A 1971, 772–776. [Google Scholar]
- Meier-Callahan A. E.; Gray H. B.; Gross Z. Inorg. Chem. 2000, 39, 3605–3607. [DOI] [PubMed] [Google Scholar]
- Cho J.; Woo J.; Nam W. J. Am. Chem. Soc. 2010, 132, 5958–5959. [DOI] [PubMed] [Google Scholar]
- Barker K. D.; Barnett K. A.; Connell S. M.; Glaeser J. W.; Wallace A. J.; Wildsmith J.; Herbert B. J.; Wheeler J. F.; Kane-Maguire N. A. P. Inorg. Chim. Acta 2001, 316, 41–49. [Google Scholar]
- Maslowsky E. J. Chem. Educ. 2000, 77, 760. [Google Scholar]
- Bendix J. J. Am. Chem. Soc. 2003, 125, 13348–13349. [DOI] [PubMed] [Google Scholar]
- Eeckhout S. G.; Safonova O. V.; Smolentsev G.; Biasioli M.; Safonov V. A.; Vykhodtseva L. N.; Sikora M.; Glatzel P. J. Anal. Atom. Spectrom. 2009, 24, 215–223. [Google Scholar]
- Savitzky A.; Golay M. J. Anal. Chem. 1964, 36, 1627–1639. [Google Scholar]
- a Becke A. D. Phys. Rev. A 1988, 38, 3098–3100. [DOI] [PubMed] [Google Scholar]; b Perdew J. P. Phys. Rev. B 1986, 33, 8822–8824. [DOI] [PubMed] [Google Scholar]
- van Lenthe E.; van der Avoird A.; Wormer P. E. S. J. Chem. Phys. 1998, 108, 4783–4796. [Google Scholar]
- van Wüllen C. J. Chem. Phys. 1998, 109, 392–399. [Google Scholar]
- a Pantazis D. A.; Chen X.-Y.; Landis C. R.; Neese F. J. Chem. Theory Comput. 2008, 4, 908–919. [DOI] [PubMed] [Google Scholar]; b Schafer A.; Horn H.; Ahlrichs R. J. Chem. Phys. 1992, 97, 2571–2577. [Google Scholar]
- Klamt A.; Schuurmann G. J. Chem. Soc., Perkin Trans. 2 1993, 799–805. [Google Scholar]
- Stephens P.; Devlin F.; Chabalowski C.; Frisch M. J. J. Phys. Chem. 1994, 98, 11623–11627. [Google Scholar]
- Hammer B.; Hansen L. B.; Nørskov J. K. Phys. Rev. B 1999, 59, 7413. [Google Scholar]
- Adamo C.; Barone V. J. Chem. Phys. 1999, 110, 6158–6170. [Google Scholar]
- Zhao Y.; Truhlar D. G. Theor. Chem. Acc. 2008, 120, 215–241. [Google Scholar]
- Staroverov V. N.; Scuseria G. E.; Tao J.; Perdew J. P. J. Chem. Phys. 2003, 119, 12129–12137. [Google Scholar]
- Delgado-Jaime M. U.; DeBeer S.; Bauer M. Chem.—Eur. J. 2013, 19, 15888–15897. [DOI] [PubMed] [Google Scholar]
- Koopmans T. Physica 1934, 1, 104–113. [Google Scholar]
- Stowasser R.; Hoffmann R. J. Am. Chem. Soc. 1999, 121, 3414–3420. [Google Scholar]
- Zhan C.-G.; Nichols J. A.; Dixon D. A. J. Phys. Chem. A 2003, 107, 4184–4195. [Google Scholar]
- Torres Deluigi M. d. R.; de Groot F. F.; López-Díaz G.; Tirao G.; Stutz G.; Riveros de la Vega J. J. Phys. Chem. C 2014, 118, 22202–22210. [Google Scholar]
Associated Data
This section collects any data citations, data availability statements, or supplementary materials included in this article.


