

Abstract
The objective of this report was to study the pharmacokinetics of rifampin (RMP), isoniazid (INH), and pyrazinamide (PZA) in HIV-infected children with tuberculosis (TB) treated with a thrice-weekly anti-TB regimen in the government program in India. Seventy-seven HIV-infected children with TB aged 1 to 15 years from six hospitals in India were recruited. During the intensive phase of TB treatment with directly observed administration of the drugs, a complete pharmacokinetic study was performed. Drug concentrations were measured by high-performance liquid chromatography. A multivariable regression analysis was done to explore the factors impacting drug levels and treatment outcomes. The proportions of children with subnormal peak concentrations (Cmax) of RMP, INH, and PZA were 97%, 28%, and 33%, respectively. Children less than 5 years old had a lower median Cmax and lower exposure (area under the time-concentration curve from 0 to 8 h [AUC0–8]) of INH (Cmax, 2.5 versus 5.1 μg/ml, respectively [P = 0.016]; AUC0–8, 11.1 versus 22.0 μg/ml · h, respectively [P = 0.047[) and PZA (Cmax, 34.1 versus 42.3 μg/ml, respectively [P = 0.055]; AUC0–8, 177.9 versus 221.7 μg/ml · h, respectively [P = 0.05]) than those more than 5 years old. In children with unfavorable versus favorable outcomes, the median Cmax of RMP (1.0 versus 2.8 μg/ml, respectively; P = 0.002) and PZA (31.9 versus 44.4 μg/ml, respectively; P = 0.045) were significantly lower. Among all factors studied, the PZA Cmax influenced TB treatment outcome (P = 0.011; adjusted odds ratio, 1.094; 95% confidence interval, 1.021 to 1.173). A high proportion of children with HIV and TB had a subnormal RMP Cmax. The PZA Cmax significantly influenced treatment outcome. These findings have important clinical implications and emphasize that drug doses in HIV-infected children with TB have to be optimized.
INTRODUCTION
Worldwide, tuberculosis (TB) is the most frequent coinfection in subjects with HIV-1 infection (1). A study from Zaire showed that the risk of TB in HIV-positive mothers was three times more than that in HIV-negative mothers (2). Infants born to HIV-infected mothers are susceptible to both HIV infection and TB. Several studies have demonstrated higher rates of childhood TB associated with increasing rates of disease in HIV-infected adults in the community (3, 4). High mortality rates have been observed with standard anti-TB treatment (ATT) regimens in HIV-infected children (5). A prospective cohort study observed that HIV-infected children with TB had a 6-fold higher mortality rate and decreased cure rates compared to those of HIV-negative children; HIV infection was the most important risk factor (6, 7). While HIV influences the TB treatment outcome in different ways, the inability to achieve and sustain therapeutic levels of anti-TB drugs (possibly due to malabsorption) can be a major factor in causing poor treatment outcomes. Malabsorption and decreased bioavailability of anti-TB drugs in adult patients with HIV and TB have been reported (8–11). A few studies have reported low anti-TB drug levels in HIV-infected children with TB (12, 13). However, these studies were conducted using the old TB treatment doses. After the World Health Organization (WHO) revision of doses for first-line anti-TB drugs, Thee et al. demonstrated that children less than 2 years of age achieved target concentrations of first-line anti-TB drugs according to the revised WHO recommendations (14).
Not much is known about the pharmacokinetics of first-line anti-TB drugs in HIV-infected children with TB in India. The Revised National TB Control Programme (RNTCP) uses standardized treatment regimens, with quality-ensured drugs provided through patient-wise boxes, tailored by weight bands in children (15). The entire duration of ATT is thrice weekly. While the majority of the TB control programs across the globe follow daily ATT, the Indian program continues to follow intermittent regimens. In the absence of pharmacokinetic data in HIV-infected children with TB treated with fully intermittent regimens in the RNTCP, we studied the pharmacokinetics of rifampin (RMP), isoniazid (INH), and pyrazinamide (PZA) and the factors influencing the drug pharmacokinetics and TB treatment outcomes.
MATERIALS AND METHODS
Patients.
HIV-infected children aged 1 to 15 years with TB were recruited from the Institute of Child Health (Chennai, India), Government Hospital of Thoracic Medicine (Chennai), Kilpauk Medical College & Hospital (Chennai), Government Rajaji Hospital (Madurai, India), Indira Gandhi Institute of Child Health (Bengaluru, India), and Sarojini Naidu Medical College (Agra, India). All children were diagnosed with TB (pulmonary or extrapulmonary) by clinicians at the various sites. Diagnosis was based on clinical, radiographic, and histopathological evidence, and standard diagnostic criteria were followed. Diagnosis of HIV infection was based on an enzyme-linked immunosorbent assay (ELISA) results; in children <18 months of age, DNA-PCR testing was done to diagnose HIV infection. Children had received ATT according to the RNTCP guidelines for at least 2 weeks (six doses) with either of the following regimens: (i) a 6-month regimen with INH, RMP, PZA, and ethambutol (EMB) for 2 months followed by INH and RMP for the next 4 months (category I), or (ii) an 8-month regimen with streptomycin, INH, RMP, PZA, and EMB for 2 months followed by INH, RMP, PZA, and EMB for 1 month and INH, RMP, and EMB for the remaining 5 months (category II). The entire course of ATT was administered thrice weekly, which was the standard of care in India (15). The drug doses were based on body weight; doses were 10 mg/kg of body weight for RMP and INH, 30 to 35 mg/kg for PZA, 30 mg/kg for EMB, and 15 mg/kg for streptomycin. The drugs were administered by the parent/guardian of the child. Adherence to ATT was assessed by questioning the parent/guardian and reviewing the TB treatment card.
Individual drugs in blister packs were made available for the entire treatment duration in “patient-wise boxes,” which are available in four different weight bands. Children eligible for antiretroviral treatment (ART) received treatment from the ART centers in the respective hospitals according to National AIDS Control Organization (NACO) guidelines. This consisted of efavirenz and lamivudine with either zidovudine or stavudine or tenofovir or abacavir. Parents/guardians gave informed written consent; children more than 7 years old gave their assent. The study was approved by the institutional ethics committee of each study site.
Clinical assessment.
A clinical examination and documentation of baseline demographic data were performed for each eligible child. The clinical history was collected from RNTCP records of the children. Adherence to ATT was assessed by questioning the parents/guardians and reviewing the treatment cards. Anthropometric data (body weight, height, head circumference, and mid-arm circumference) were measured on the pharmacokinetic study day. The clinical management of patients was done by site physicians.
Determination of phenotypic INH acetylator status.
Two milliliters of saliva was collected 5 h after the administration of INH syrup at a dose of 2.5 mg/kg of body weight. Salivary INH levels were assessed by high-performance liquid chromatography (HPLC), and an INH concentration of 0.3 μg/ml or less was indicative of a rapid acetylator status (16, 17).
Conduct of pharmacokinetic study.
The study was conducted at the inpatient wards in the hospitals after children had received at least six doses of anti-TB drugs (i.e., at steady state). On the study day, serial blood samples (2 ml each) at predosing and at 2, 4, 6, and 8 h after drug intake were collected. The anti-TB drugs were administered under direct observation after an overnight fast. Older children were asked to swallow the tablets with water, while younger children who could not swallow tablets received the tablets in powdered form mixed in a small quantity of water and were asked to swallow the entire contents.
Drug estimations.
Plasma INH, PZA, and RMP concentrations were determined by HPLC using validated methods (17, 18). The between- and within-run variations for all the drugs were less than 10%. The lower limits of quantification for RMP, INH, and PZA were 0.25 μg/ml, 0.25 μg/ml, and 1.25 μg/ml, respectively.
Calculation of pharmacokinetic variables.
Peak concentrations (Cmax values) were determined by visual inspection of the data. The linear trapezoidal rule was used to compute exposures, or the areas under the time-concentration curve from 0 to 8 h (AUC0–8 values).
Assessment of nutritional status.
The Z scores for weight and height were computed based on each child's age and gender using the EPI-NUT component of the EPI-INFO 2002 software package (version 3.4.3) from the CDC (based on National Center for Health Statistics reference median values) (19).
Treatment and follow-up.
Children continued ATT per the program guidelines. The treatment outcomes were noted from the card; cured/treatment completion was considered a favorable outcome, while failure, death, and default were unfavorable outcomes.
Sample size.
Based on the findings of Palme et al. (20), who, when considering treatment outcome as the primary endpoint, observed a cure rate of 58% among HIV-positive patients with TB, and using a 95% confidence interval (CI), 80% power, and oversampling of 5% during follow-up, the sample size was calculated to be 73 children.
Statistical evaluation.
The analysis of data was performed using SPSS, version 14.0. The values are expressed medians with interquartile ranges. The Shapiro-Wilks test showed that the pharmacokinetic data were not normally distributed. The Mann-Whitney U test was used to compare the Cmax and AUC0–8 between the different groups of children. Subnormal Cmax values were defined for RMP as <8 μg/ml, for INH as <3 μg/ml, and for PZA as <35 μg/ml (21). A comparison of the proportions between the groups was done using the Z proportion test. Pearson's correlation test was performed to determine the correlation between the Cmax of the drugs and the doses in mg/kg of body weight. Univariate and multivariate regression analyses by the stepwise method were performed to determine the factors that influenced the Cmax and AUC0–8 of RMP, INH, and PZA. A multiple logistic regression analysis by a backward deletion algorithm was used to identify the factors that influenced the treatment outcome. A P value of <0.05 was considered statistically significant.
RESULTS
A total of 77 children coinfected with HIV and TB took part in the study. Their demographic and clinical features are given in Table 1. Overall, 86% of the children received the 6-month category I treatment, and 30% of these children were INH rapid acetylators. While 64% of the children had pulmonary TB, extrapulmonary forms included cervical and axillary lymph node TB (n = 12 children), hilar adenitis (n = 8), mediastinal adenitis (n = 4), TB meningitis (n = 2), TB of the spine (n = 1), and TB of the abdomen (n = 1).
TABLE 1.
Demographic and clinical features of children with TB and HIVa
| Characteristic | Datab |
|---|---|
| Age (yr) | 9.0 (6.5–11.0) |
| Male | 50 (65) |
| Body wt (kg) | 17.0 (14.1–22.5) |
| Nutritional statusc | |
| HAZ | −3.0 (−4.1 to −2.0) |
| WAZ | −2.7 (−3.4 to −1.9) |
| WHZd | −1.1 (−1.7 to 0.02) |
| Mid-arm circumference (cm) | 14.0 (12.0–16.0) |
| Head circumference (cm) | 48.0 (43.0–50.0) |
| Thrice-weekly dose (mg/kg) | |
| RMP | 10.0 (7.5–11.3) |
| INH | 10.0 (7.5–11.3) |
| PZA | 33.0 (27.8–37.5) |
| Duration of ATT (mo) | 1.0 (0.5–1.0) |
| Regimen | |
| Category I | 66 (86) |
| Category II | 11 (14) |
| Type of TB | |
| Pulmonary | 49 (64) |
| Extrapulmonary | 28 (36) |
| Rapid acetylators of INH | 25 (30) |
| CD4 cell count (cells/mm3) | 359.0 (192.5–722.5) |
| On antiretroviral treatment | 45 (60) |
n = 77.
Data presented as no. (%) or median (interquartile range).
HAZ, height-for-age Z score; WAZ, weight-for-age Z score; WHZ, weight-for-height Z score.
Values from 56 children.
Cmax and AUC0–8 of drugs.
Cmax and AUC0–8 data for RMP, INH, and PZA in the different groups of children are given in Table 2. The differences in the Cmax and AUC0–8 between children less than 5 years and those more than 5 years of age were statistically significant for INH and PZA but not for RMP; however, children more than 5 years old had higher RMP Cmax and AUC0–8 values. Children belonging to these two groups did not differ in the doses received (RMP and INH, 11.0 and 9.7 mg/kg, respectively [P = 0.28]; PZA, 39.0 and 32.4 mg/kg, respectively [P = 0.24]).
TABLE 2.
Pharmacokinetics of RMP, INH, and PZA in HIV-infected children with TBa
| Variable | No. of patients | Pharmacokinetic datab for: |
|||||
|---|---|---|---|---|---|---|---|
| RMP |
INH |
PZA |
|||||
| Cmax (μg/ml) | AUC0–8 (μg/ml · h) | Cmax (μg/ml) | AUC0–8 (μg/ml · h) | Cmax (μg/ml) | AUC0–8 (μg/ml · h) | ||
| Age | |||||||
| ≤5 yr | 12 | 2.4 (1.1–4.1) | 9.5 (3.8–13.2) | 2.5 (2.9–4.3) | 11.1 (7.1–16.1) | 34.1 (21.4–40.9) | 177.9 (116.8–232.9) |
| >5 yr | 65 | 2.7 (1.4–4.6) | 10.9 (6.5–19.8) | 5.1 (3.1–7.5)c | 22.0 (11.8–31.2)c | 42.3 (32.3–51.4)d | 221.7 (177.8–283.4)c |
| Sex | |||||||
| Male | 50 | 2.7 (1.1–4.5) | 10.4 (6.1–18.8) | 5.5 (3.3–8.4) | 23.5 (13.9–40.0) | 42.6 (33.3–57.3) | 227.4 (189.4–287.2) |
| Female | 27 | 2.5 (1.3–4.6) | 10.5 (5.9–18.8) | 3.7 (2.6–7.0) | 15.1 (9.6–27.0)c | 40.3 (31.1–47.8) | 218.1 (169.4–271.8) |
| Nutritional status | |||||||
| Normal | 18 | 3.9 (1.7–4.5) | 15.4 (5.6–23.4) | 5.3 (3.3–7.3) | 22.7 (12.4–31.4) | 34.5 (31.5–43.9) | 201.2 (166.9–264.3) |
| Stunted | 59 | 2.4 (1.1–4.4) | 10.1 (6.1–17.6) | 4.6 (2.5–7.3) | 19.5 (10.0–30.8) | 43.2 (31.8–49.1) | 226.8 (177.8–279.1) |
| Normal | 21 | 3.3 (1.1–4.7) | 9.9 (3.6–22.0) | 5.4 (3.1–7.5) | 22.1 (11.6–31.5) | 40.6 (29.4–46.8) | 211.8 (157.0–266.4) |
| Underweight | 56 | 2.5 (1.3–4.2) | 10.9 (6.7–17.7) | 4.4 (2.7–7.2) | 19.2 (10.6–30.7) | 41.3 (31.4–48.6) | 224.6 (175.5–284.9) |
| Normal | 41 | 2.3 (1.2–4.7) | 9.7 (5.7–17.6) | 5.3 (3.2–7.8) | 22.3 (12.4–34.5) | 43.2 (33.9–49.1) | 218.1 (182.8–282.8) |
| Wastede | 15 | 3.4 (1.9–4.4) | 11.5 (6.5–19.8) | 3.3 (2.7–5.3) | 12.2 (10.5–26.6) | 34.5 (28.5–42.6) | 186.4 (169.4–247.9) |
| BMI | |||||||
| <18.5 kg/m2 | 70 | 2.7 (1.3–4.6) | 10.8 (6.3–19.1) | 5.3 (2.5–7.1) | 21.9 (10.5–26.9) | 41.1 (31.2–48.0) | 218.1 (171.3–272.6) |
| ≥18.5 kg/m2 | 7 | 2.2 (1.1–4.1) | 7.2 (2.7–10.2) | 4.1 (2.9–7.5) | 19.0 (10.7–32.3) | 49.6 (39.0–62.2) | 282.3 (191.4–331.0) |
| Serum albumin level | |||||||
| Within normal range | 20 | 3.4 (1.6–5.3) | 15.4 (8.9–22.7) | 4.6 (2.7–7.2) | 19.5 (10.8–29.3) | 44.6 (28.5–55.5) | 255.4 (168.1–288.5) |
| Below normal range | 57 | 2.4 (1.2–4.4) | 9.5 (5.0–17.6) | 6.7 (4.1–7.6) | 33.3 (15.8–35.2) | 41.1 (32.4–47.3) | 216.0 (174.4–260.7) |
| Outcome | |||||||
| Favorable | 54 | 2.8 (1.8–4.7) | 10.6 (7.0–17.6) | 4.3 (2.8–7.3) | 17.5 (10.7–30.1) | 44.4 (40.3–52.2) | 248.1 (207.5–284.9) |
| Unfavorable | 18 | 1.0 (0.2–3.1)c | 4.7 (2.2–17.2)c | 5.1 (2.9–7.2) | 23.4 (10.9–32.7) | 31.9 (26.4–38.7)c | 177.3 (151.8–217.0)c |
| ART | |||||||
| Without | 28 | 2.6 (1.7–5.2) | 11.1 (6.9–22.0) | 4.6 (3.1–6.9) | 21.1 (12.0–30.1) | 44.4 (34.0–54.9) | 226.8 (201.2–283.9) |
| With | 49 | 2.8 (1.1–4.3) | 10.6 (4.2–17.6) | 4.8 (2.4–7.6) | 18.7 (8.1–31.3) | 41.0 (27.8–45.7) | 209.6 (167.5–259.1) |
| Acetylator status | |||||||
| Slow | 52 | 5.4 (3.2–7.7) | 23.9 (14.2–33.6) | ||||
| Rapid | 25 | 3.2 (2.0–4.3)c | 11.1 (7.4–15.1)c | ||||
n = 77.
Values are reported as medians (interquartile ranges). Cmax, peak concentration; AUC0–8, exposure.
P < 0.05.
P = 0.055.
Z scores could not be calculated for 21 children.
Females had lower INH Cmax and AUC0–8 values than males, and the difference was statistically significant for the AUC0–8. Slow acetylators had significantly higher INH Cmax and AUC0–8 values than the rapid acetylators (P < 0.01).
Children with unfavorable outcomes had significantly lower median Cmax and AUC0–8 values for RMP (2.5 versus 4.4 μg/ml, respectively [P < 0.001]; 12.3 versus 17.9 μg/ml · h, respectively [P = 0.008]) and PZA (31.3 versus 44.4 μg/ml, respectively [P = 0.002]; 173.2 versus 250.2 μg/ml · h, respectively [P = 0.003]) than those who had favorable outcomes (Fig. 1).
FIG 1.
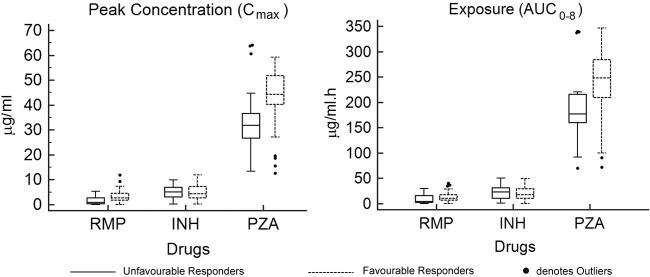
Median RMP, INH, and PZA peak concentrations and exposure in children with favorable and unfavorable responses to anti-TB treatment.
Subtherapeutic Cmax.
Subtherapeutic Cmax values for RMP, INH, and PZA were observed in 97%, 28%, and 33% children, respectively. A higher proportion of children with a subtherapeutic INH Cmax were rapid acetylators than those who were slow acetylators (46% versus 21%, respectively; P = 0.03). The proportions of children with subtherapeutic INH and PZA Cmax values were higher in children less than 5 years old than those more than 5 years old (INH, 55% versus 23%, respectively [P = 0.03]; PZA, 63% versus 29%, respectively [P = 0.06]).
Factors influencing Cmax and AUC0–8 values of RMP, INH, and PZA.
The factors included for analysis were age, sex, height-for-age Z score (HAZ), weight-for-age Z score (WAZ), weight-for-height Z score (WHZ), serum albumin level, and INH acetylator status. The univariate analysis was done first, and only those variables that gave a P value of <0.1 were further tested by a multivariate regression analysis by the stepwise method. Serum albumin levels had a significant influence on the AUC0–8 of RMP, and acetylator status significantly influenced the INH Cmax and AUC0–8 values (Table 3).
TABLE 3.
Multiple regression analysis showing factors significantly influencing peak concentration and exposure of RMP, INH, and PZA
| Factora | Regression data |
||
|---|---|---|---|
| β | 95% CI | P | |
| RMP | |||
| AUC0–8 (μg/ml · h) | |||
| Serum albumin level | 5.495 | 0.350–10.641 | 0.037 |
| INH | |||
| Cmax (μg/ml) | |||
| Acetylator status | 2.116 | 0.313–3.919 | 0.022 |
| AUC0–8 (μg/ml · h) | |||
| Acetylator status | 13.443 | 5.084–21.801 | 0.002 |
Age, acetylator status (for INH), serum albumin level, HAZ, WAZ, and WHZ were used in the multiple linear regression analysis by the stepwise method.
A positive significant correlation was observed among the Cmax values of RMP, INH, and PZA with the respective doses. The r and P values were 0.162 and 0.043 for RMP, 0.387 and <0.001 for INH, and 0.353 and <0.001 for PZA, respectively.
TB treatment outcome.
TB treatment outcomes were known for 72 children; five children were lost during follow-up. An unfavorable outcome was observed in 18 children (8 deaths and 10 treatment failures). Univariate logistic regression analysis was performed to identify factors (age, body mass index [BMI], sex, HAZ, WAZ, WHZ, serum albumin level, INH acetylator status, RMP Cmax, INH Cmax, and PZA Cmax) that had a significant impact on the treatment outcome. The RMP Cmax and the PZA Cmax had significant impacts (P < 0.05; Fig. 2). Further, those factors with a P value of <0.1 in univariate analysis were taken for logistic regression analysis by the stepwise method. It was observed that the PZA Cmax (P = 0.011; adjusted odds ratio, 1.094; 95% CI, 1.021 to 1.173) significantly influenced the treatment outcome.
FIG 2.
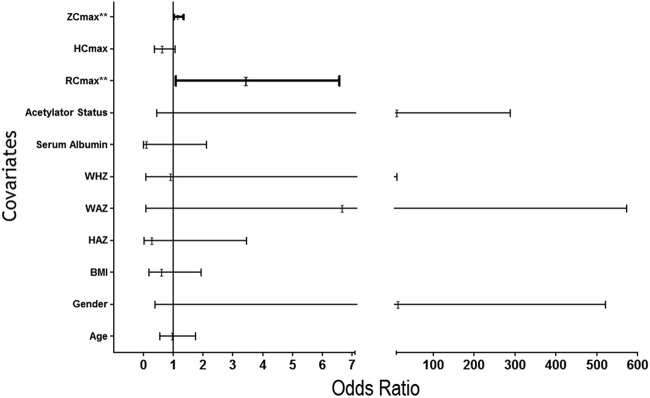
Unadjusted odds ratio of factors influencing TB treatment outcome. **, P value < 0.05. RCmax, Cmax of rifampin; HCmax, Cmax of isoniazid; ZCmax, Cmax of pyrazinamide; Cmax, peak concentration; BMI, body mass index; WAZ, weight-for-age Z score denoting underweight; HAZ, height-for-age Z score; WHZ, weight-for-height Z score.
DISCUSSION
This prospective study has provided pharmacokinetic data of key first-line anti-TB drugs in HIV-infected children with TB. Similar to previous studies, we observed lower INH and PZA Cmax values in younger children (15, 22, 23). We did not observe any difference in RMP concentrations between younger and older children, perhaps because the RMP Cmax was low in a majority of the children across all ages. Furthermore, the proportions of children with subtherapeutic INH and PZA Cmax values were higher in children less than 5 years old. This is despite the similar drug dosages used for children less than and more than 5 years of age. Age-dependent elimination of INH has been demonstrated, with younger children eliminating the drug more rapidly than older children (15, 22). This has been attributed to the relatively larger liver size in proportion to total body weight in younger children (24). Age has a significant impact on drug concentrations and should be considered while making dosing recommendations in children.
We compared pharmacokinetic parameters in relation to malnutrition. Although children with stunting, who were underweight, or who had a BMI and a serum albumin level below the normal ranges had lower drug concentrations than did well-nourished children, the differences did not reach significance. While some studies have reported malnutrition to be a significant predictor of anti-TB drug concentrations (14, 15, 22, 23), there are few studies which did not find a major impact of malnutrition on drug concentrations (25–27).
Irrespective of age and whether the patients are adults or children, the RMP concentrations are the most affected and are subnormal in a high proportion of HIV-infected patients. However, treatment outcomes are often satisfactory. The relationship between plasma drug concentrations and the outcome of TB treatment has been a matter of debate and likely involves the interplay of multiple factors. Treatment outcome is driven by multiple factors, such as the strain involved, virulence, MIC, duration of infection, extent of disease, drug concentrations, immune status, nutritional status, and gene polymorphisms. However, persistently low concentrations can encourage the emergence of drug-resistant Mycobacterium tuberculosis. As treatment progresses, such patients are likely to experience an increased risk of developing resistance, manifesting as delayed smear conversion, treatment failure, or relapse. Hence, maintaining optimal drug concentrations is important and ensures that doses are adequate to achieve the required bactericidal effect.
Importantly, we examined the relationship between drug pharmacokinetics and TB treatment outcomes in children with TB and HIV. After controlling for all factors, we observed that the PZA Cmax significantly influenced treatment outcome, a finding similar to those in published reports (28, 29). Burhan et al. observed an association of low PZA concentrations with a less favorable bacteriological response in adult Indonesian TB patients (28). In a study from Botswana in an HIV-infected cohort of adult TB patients, a low PZA Cmax was associated with poor treatment outcome (29). PZA is a key drug that kills intracellular organisms and is given for only 2 months. These studies highlight the need to treat children with adequate drug doses. A study from Virginia in adult TB patients reported that slow responders to therapy had subtherapeutic concentrations of RMP, INH, and ethambutol (30). Using a hollow-fiber system model of TB, Pasipanodya et al. concluded that low AUCs of RMP, INH, and PZA were predictive of clinical outcomes in TB patients (31). Our study finding raises an important question: were these children underdosed, hence the low drug concentrations? This assumes significance in light of the study findings of Thee et al., who observed that children less than 2 years of age achieved target drug concentrations when treated with the revised WHO-recommended doses (14).
A study limitation was that blood concentrations were determined only up to 8 h postdosing, and this might have affected the PZA AUC. In conclusion, this study, done in a fairly large group of HIV-infected children with TB, has provided evidence that the concentrations of first-line anti-TB drugs are subnormal in a significant proportion of them, and this appears to influence treatment outcomes. This also is likely due to low drug doses that were used intermittently. The finding of PZA playing a key role in TB treatment outcomes needs further attention. Improving outcomes in HIV-infected children with TB requires multiple interventions; an important one will be to optimize drug dosing.
ACKNOWLEDGMENTS
We thank the children who participated in the study, K. Nandagopal (ART medical officer, Kilpauk Medical College and Hospital, Chennai) for assistance with patient recruitment, V. Sudha for drug estimations, S. Venkatesh for counseling and follow-up of patients, and NIRT clinic nurses for blood collection.
This study was funded by the Pediatric HIV Task Force of the Indian Council of Medical Research, New Delhi.
We declare no conflicts of interest.
REFERENCES
- 1.Dye C, Scheele S, Dolin P, Pathana V, Raviglione MC. 1999. Consensus statement. Global burden of tuberculosis: estimated incidence, prevalence, and mortality by country. WHO Global Surveillance and Monitoring Project. JAMA 282:677–686. [DOI] [PubMed] [Google Scholar]
- 2.Braun MM, Badi N, Ryder RW, Baende E, Mukadi Y, Nsuami M, Matela B, Williame JC, Kaboto M, Heyward W. 1991. A retrospective cohort study of the risk of tuberculosis among women of child bearing age with HIV infection in Zaire. Am Rev Respir Dis 143:501–504. doi: 10.1164/ajrccm/143.3.501. [DOI] [PubMed] [Google Scholar]
- 3.Harries AD. 1990. Tuberculosis and human immunodeficiency virus infection in developing countries. Lancet 335:387–390. doi: 10.1016/0140-6736(90)90216-R. [DOI] [PubMed] [Google Scholar]
- 4.Jones D, Malecki J, Bigler W, Witte JJ, Oxtoby MJ. 1999. Pediatric tuberculosis and human immunodeficiency virus infection in Palm Beach County, Florida. Am J Dis Child 146:1166–1170. [DOI] [PubMed] [Google Scholar]
- 5.Swaminathan S. 2004. Tuberculosis in HIV-infected children. Paediatr Respir Rev 5:225–230. doi: 10.1016/j.prrv.2004.04.006. [DOI] [PubMed] [Google Scholar]
- 6.Jeena PM, Pillay P, Pillay T, Coovadia HM. 2002. Impact of HIV-1 coinfection on presentation and hospital-related mortality in children with culture proven pulmonary tuberculosis in Durban, South Africa. Int J Tuberc Lung Dis 6:672–678. [PubMed] [Google Scholar]
- 7.Rekha B, Swaminathan S. 2007. Childhood tuberculosis: global epidemiology and the impact of HIV. Paediatr Respir Rev 8:99–106. doi: 10.1016/j.prrv.2007.04.010. [DOI] [PubMed] [Google Scholar]
- 8.Gurumurthy P, Ramachandran G, Hemanth Kumar AK, Rajasekaran S, Padmapriyadarsini C, Soumya Swaminathan Bhagavathy S, Venkatesan P, Sekar L, Mahilmaran A, Ravichandran N, Paramesh P. 2004. Decreased bioavailability of rifampin and other anti-TB drugs in patients with advanced HIV disease. Antimicrob Agents Chemother 48:4473–4475. doi: 10.1128/AAC.48.11.4473-4475.2004. [DOI] [PMC free article] [PubMed] [Google Scholar]
- 9.Sahai J, Gallicano K, Swick L, Tailor S, Garber G, Sequin I, Oliveras L, Walker S, Rachlis A, Cameron DW. 1997. Reduced plasma concentrations of antituberculous drugs in patients with HIV infection. Ann Intern Med 127:289–293. doi: 10.7326/0003-4819-127-4-199708150-00006. [DOI] [PubMed] [Google Scholar]
- 10.Peloquin CA, MacPhee AA, Berning SE. 1993. Malabsorption of antimycobacterial medications. N Engl J Med 329:1122–1123. doi: 10.1056/NEJM199310073291513. [DOI] [PubMed] [Google Scholar]
- 11.Berning SE, Huitt GA, Iseman MD, Peloquin CA. 1992. Malabsorption of antituberculosis medications by a patient with AIDS. N Engl J Med 327:1817–1818. doi: 10.1056/NEJM199212173272514. [DOI] [PubMed] [Google Scholar]
- 12.Graham SM, Bell DJ, Nyirongo S, Hartkoorn R, Ward SA, Molyneux EM. 2006. Low levels of pyrazinamide and ethambutol in children with tuberculosis and impact of age, nutritional status, and human immunodeficiency virus infection. Antimicrob Agents Chemother 50:407–413. doi: 10.1128/AAC.50.2.407-413.2006. [DOI] [PMC free article] [PubMed] [Google Scholar]
- 13.Schaaf HS, Willemse M, Cilliers K, Labadarios D, Maritz JS, Hussey GD, Mcllleron H, Smith PJ, Donald PR. 2009. Rifampin pharmacokinetics in children, with and without human immunodeficiency virus infection, hospitalized for the management of severe forms of tuberculosis. BMC Med 7:19–29. doi: 10.1186/1741-7015-7-19. [DOI] [PMC free article] [PubMed] [Google Scholar]
- 14.Thee S, Seddon JA, Donald PR, Seifart SI, Werely CJ, Hesseling AC, Rosenkranz B, Roll S, Magdorf K, Schaaf HS. 2011. Pharmacokinetics of isoniazid, rifampin, and pyrazinamide in children younger than two years of age with tuberculosis: evidence for implementation of revised World Health Organization recommendations. Antimicrob Agents Chemother 55:5560–5567. doi: 10.1128/AAC.05429-11. [DOI] [PMC free article] [PubMed] [Google Scholar]
- 15.Revised National Tuberculosis Control Programme. Technical and operational guidelines for tuberculosis control, October 2005. Ministry of Health and Family Welfare, New Delhi, India: http://tbcindia.nic.in/pdfs/Technical%20&%20Operational%20guidelines%20for%20TB%20Control.pdf. [Google Scholar]
- 16.Sarma GR, Kailasam S, Datta M, Loganathan GK, Rahman F, Narayana ASL. 1990. Classification of children as slow or rapid acetylators based on concentrations of isoniazid in saliva following oral administration of body weight and surface area: related dosages of the drug. Indian Pediatr 27:134–142. [PubMed] [Google Scholar]
- 17.Kumar AKH, Sudha V, Ramachandran G. 2012. Simple and rapid liquid chromatography method for simultaneous determination of isoniazid and pyrazinamide in plasma. SAARC J TB Lung Dis HIV/AIDS 9:13–18. doi: 10.3126/saarctb.v9i1.6960. [DOI] [Google Scholar]
- 18.Kumar AKH, Chandra I, Geetha R, Chelvi KS, Lalitha V, Prema G. 2004. A validated high-performance liquid chromatography method for the determination of rifampicin and desacetyl rifampicin in plasma and urine. Indian J Pharmacol 36:231–233. [Google Scholar]
- 19.World Health Organization.2011. Physical status: the use and interpretation of anthropometry. Report of a WHO expert committee. Technical report series no. 854. World Health Organization, Geneva, Switzerland: http://www.who.int/childgrowth/publications/physical_status/en/index.html. [PubMed] [Google Scholar]
- 20.Palme IB, Gudetta B, Bruchfeld J, Muhe L, Giesecke J. 2002. Impact of human immunodeficiency virus 1 infection on clinical presentation, treatment outcome and survival in a cohort of Ethiopian children with tuberculosis. Pediatr Infect Dis J 21:1053–1061. doi: 10.1097/00006454-200211000-00016. [DOI] [PubMed] [Google Scholar]
- 21.Alsultan A, Peloquin CA. 2014. Therapeutic drug monitoring in the treatment of tuberculosis: an update. Drugs 74:839–854. doi: 10.1007/s40265-014-0222-8. [DOI] [PubMed] [Google Scholar]
- 22.McIlleron H, Willemse M, Werely CJ, Hussey GD, Schaaf HS, Smith PJ, Donald PR. 2009. Isoniazid plasma concentrations in a cohort of South African children with tuberculosis: implications for international pediatric dosing guidelines. Clin Infect Dis 48:1547–1553. doi: 10.1086/598192. [DOI] [PubMed] [Google Scholar]
- 23.Ramachandran G, Hemanth Kumar AK, Bhavani PK, Poorana Gangadevi N, Sekar L, Vijayasekaran D, Banu Rekha VV, Ramesh Kumar S, Ravichandran N, Mathevan G, Soumya Swaminathan. 2013. Age, nutritional status and isoniazid acetylator status influence pharmacokinetics of anti-TB drugs in children. Int J Tuberc Lung Dis 17:800–806. doi: 10.5588/ijtld.12.0628. [DOI] [PubMed] [Google Scholar]
- 24.Schaaf HS, Parkin DP, Seifart HI, Werely J, Hesseling PB, van Helden PD, Maritz JS, Donald PR. 2005. Isoniazid pharmacokinetics in children treated for respiratory tuberculosis. Arch Dis Child 90:614–618. doi: 10.1136/adc.2004.052175. [DOI] [PMC free article] [PubMed] [Google Scholar]
- 25.Seifart HI, Donald PR, de Villiers JN, Parkin DP, Jaarsveld PP. 1995. Isoniazid elimination kinetics in children with protein-energy malnutrition treated for tuberculous meningitis with a four-component antimicrobial regimen. Ann Trop Paediatr 15:249–254. [DOI] [PubMed] [Google Scholar]
- 26.Seth V, Beotra A, Bagga A, Seth SD. 1992. Drug therapy in malnutrition. Indian Pediatr 29:1341–1346. [PubMed] [Google Scholar]
- 27.Seth V, Beotra A, Seth SD, Semwal OP, Kabra S, Jain Y, Mukhopadhya S. 1993. Serum concentrations of rifampicin and isoniazid in tuberculosis. Indian Pediatr 30:1091–1098. [PubMed] [Google Scholar]
- 28.Burhan E, Ruesen C, Ruslami R, Ginanjar A, Mangunnegoro H, Ascobat P, Donders R, van Crevel R, Aarnoutse R. 2013. Isoniazid, rifampin and pyrazinamide plasma concentrations in relation to treatment response in Indonesian pulmonary tuberculosis patients. Antimicrob Agents Chemother 57:3614–3619. doi: 10.1128/AAC.02468-12. [DOI] [PMC free article] [PubMed] [Google Scholar]
- 29.Chideya S, Winston CA, Peloquin CA, Bradford WZ, Hopewell PC, Wells CD, Reingold AL, Kenyon TA, Moeti TL, Tappero JW. 2009. Isoniazid, rifampin, ethambutol, and pyrazinamide pharmacokinetics and treatment outcomes among predominantly HIV-infected cohort of adults with tuberculosis from Botswana. Clin Infect Dis 48:1685–1694. doi: 10.1086/599040. [DOI] [PMC free article] [PubMed] [Google Scholar]
- 30.Heysell SK, Moore JL, Keller SJ, Houpt ER. 2010. Therapeutic drug monitoring for slow response to tuberculosis treatment in a state control program, Virginia, USA. Emerg Infect Dis 16:1546–1553. doi: 10.3201/eid1610.100374. [DOI] [PMC free article] [PubMed] [Google Scholar]
- 31.Pasipanodya JG, Mcllleron H, Burger A, Wash PA, Gumbo T. 2013. Serum drug concentrations predictive of pulmonary tuberculosis outcomes. J Infect Dis 208:1464–1473. doi: 10.1093/infdis/jit352. [DOI] [PMC free article] [PubMed] [Google Scholar]