Abstract
Efficacy of anidulafungin is driven by the area under the concentration-time curve (AUC)/MIC ratio. Determination of the anidulafungin AUC along with MIC values can therefore be useful. Since obtaining a full concentration-time curve to determine an AUC is not always feasible or appropriate, limited-sampling strategies may be useful in adequately estimating exposure. The objective of this study was to develop a model to predict the individual anidulafungin exposure in critically ill patients using limited-sampling strategies. Pharmacokinetic data were derived from 20 critically ill patients with invasive candidiasis treated with anidulafungin. These data were used to develop a two-compartment model in MW\Pharm using an iterative 2-stage Bayesian procedure. Limited-sampling strategies were subsequently investigated using two methods, a Bayesian analysis and a linear regression analysis. The best possible strategies for these two methods were evaluated by a Bland-Altman analysis for correlation of the predicted and observed AUC from 0 to 24 h (AUC0–24) values. Anidulafungin exposure can be adequately estimated with the concentration from a single sample drawn 12 h after the start of the infusion either by linear regression (R2 = 0.99; bias, 0.05%; root mean square error [RMSE], 3%) or using a population pharmacokinetic model (R2 = 0.89; bias, −0.1%; RMSE, 9%) in critically ill patients and also in less severely ill patients, as reflected by healthy volunteers. Limited sampling can be advantageous for future studies evaluating the pharmacokinetics and pharmacodynamics of anidulafungin and for therapeutic drug monitoring in selected patients. (This study has been registered at ClinicalTrials.gov under registration no. NCT01047267.)
INTRODUCTION
Echinocandins are a valuable addition for the treatment of invasive fungal infections, as they are efficacious, demonstrate low toxicity, and have limited drug-drug interactions (1).
The area under the concentration-time curve (AUC) divided by the MIC appears to be a good predictor of the efficacy of echinocandin drugs in a neutropenic murine disseminated-candidiasis model (2, 3). No data are available on the influence of the AUC/MIC ratio on the efficacy and mortality of anidulafungin in daily practice. More information is necessary to elucidate this relation. Determination of the anidulafungin AUC along with MIC values is therefore advisable for future research and possibly also in specific clinical situations, since anidulafungin exposure can be low in critically ill patients (4). Lack of response to the standard dose in the situation of an anidulafungin-susceptible tested isolate may prompt measurement of the anidulafungin concentration to detect whether drug exposure is too low.
Obtaining a full concentration-time curve to determine an AUC is not always feasible, since this can be a burden to the patient, is time-consuming, and is relatively expensive. To overcome this problem, limited-sampling strategies may be useful in adequately estimating exposure with one or only a few samples. However, no limited-sampling strategy is available for anidulafungin at this moment.
The objective of this study was to develop a model to predict the individual anidulafungin exposure in critically ill patients using limited sampling strategies.
MATERIALS AND METHODS
Study population.
Pharmacokinetic data were derived from patients who participated in an open-label prospective study on the pharmacokinetics of anidulafungin in critically ill patients (4). This study was performed in the University Medical Center Groningen (The Netherlands). Patients were eligible for inclusion if they were at least 18 years old, admitted to an intensive care unit, and diagnosed with invasive candidiasis. The study protocol was approved by the local institutional ethics committee. The trial was registered at clinicaltrials.gov (NCT01047267). Written informed consent was obtained from each patient or his or her legal representative.
The patients were treated with anidulafungin, starting with a loading dose of 200 mg on day one and continuing with a maintenance dose of 100 mg once daily. On the first day of treatment, blood samples were drawn to measure anidulafungin plasma concentrations 3 and 12 h after the start of the 3-h infusion of the loading dose. A concentration-time curve was obtained at day 3 (±1 day) after the start of anidulafungin. Blood samples were obtained prior to the start of the 1.5-h infusion of anidulafungin and at 1.5, 2, 3, 4, 6, 8, 12, and 24 h after the start of the infusion. In addition, blood samples for measuring anidulafungin trough concentrations were collected every 3 days during the continuation of anidulafungin treatment in the intensive care unit. All samples were tested with a liquid chromatography-tandem mass spectrometry (LC-MS/MS) method that was validated according to FDA guidelines for bioanalytical method validation (5).
Pharmacokinetics.
The area under the concentration-time curve from 0 to 24 h (AUC0–24) was calculated using the log-linear trapezoidal rule using KINFIT (MW\Pharm 3.80; Mediware, The Netherlands).
Potential factors that contribute to the pharmacokinetic variability of anidulafungin were previously investigated (4). A multiple linear regression analysis provided a significant correlation between anidulafungin exposure and total body water and bilirubin concentrations. MW\Pharm is straightforward software which is user-friendly but lacks the ability to include an extensive set of influencing factors in the model. The total body water was incorporated in the model by basing the model on fat-free mass (FFM), but it was unfortunately not possible to include the bilirubin concentration. A two-compartment model based on the observed anidulafungin concentrations was created using an iterative 2-stage Bayesian procedure (6), starting with estimates (clearance [CL], 1.216 ± 0.250 liter/h/56 kg FFM; central volume of distribution [V1], 0.170 ± 0.041 liter/kg lean body mass corrected [LBMc]; intercompartmental clearance [Q], 21.6 ± 2.29 liter/h/56 kg FFM; peripheral volume of distribution [V2], 0.392 ± 0.043 liter/kg LBMc) based on those in the literature (7). Interindividual variability of the pharmacokinetic parameters was assumed to be log-normally distributed. The residual error was assumed to be normally distributed and was modeled as a combination of additive and proportional error. The residual error parameters were estimated during the analysis. The initial value of both parameters was 0.1.
Limited-sampling strategies.
Limited-sampling strategies were investigated with two methods: a Bayesian analysis and a linear regression analysis.
The optimal sampling times were determined with the limited-sampling module of MW\Pharm based on a Monte Carlo simulation of 1,000 patients randomly drawn from the population model using Bayesian analysis for parameter estimation. The performance of a strategy was considered acceptable if the prediction bias was <5% and the precision (RMSE) was <15%. For the most suitable strategy, the AUC0–24 was predicted using the developed pharmacokinetic model.
For the other method, linear regression analyses were performed in IBM SPSS Statistics 20 (IBM Corp., Armonk, NY, USA) for the measured concentrations at every sampling time of the concentration-time curve versus the AUC0–24. The performance of a strategy was considered acceptable if the prediction bias was <5% and the precision (RMSE) was <15%. The AUC0–24 was predicted using the equation of the regression line of the most suitable strategy.
Data analysis.
The validation of the population pharmacokinetic model and the linear regression analysis was performed by a cross-validation in which one patient was left out (n − 1). The AUC0–24 of the patient left out from the developed model was subsequently predicted using this n − 1 model (8). The AUC0–24 predicted with the developed model was subsequently compared with the AUC0–24 predicted with the n − 1 model using a Wilcoxon matched-pair signed-rank test. Means with 90% confidence intervals (CIs) for the ratios of the AUC0–24 predicted with the developed model and the n − 1 model were also calculated.
The best possible limited-sampling strategies for these methods were evaluated by a Bland-Altman analysis for correlation of predicted and observed AUC0–24 and by determining the mean with 90% confidence interval for the ratio of the predicted versus those of the observed anidulafungin exposure as used in bioequivalence tests.
Numerical variables are summarized with medians and interquartile ranges unless stated otherwise.
External data set.
To evaluate if the best possible strategies were also applicable in less-ill patients receiving anidulafungin, we used data from healthy volunteers from drug interaction studies (9, 10).
Possible implications for clinical practice.
Since the AUC/MIC ratio is a good predictor of efficacy (2, 3), information about the distribution of AUCs and MICs is necessary to gain more insight in clinical situations in which it can be appropriate to determine the anidulafungin exposure. Data about AUC distribution were available (4). The distributions of MICs and AUC/MIC ratios were based on EUCAST data (11). The exposure of the general patient population to 110 mg · h/liter (12) is accepted to be sufficient for treating infections with susceptible Candida species (11). A Candida species was considered susceptible if its MIC was not higher than the EUCAST clinical breakpoint. Hence, the AUC/MIC target value is the exposure of the general patient population divided by the clinical breakpoint. Subsequently, the percentage of patients who achieve the AUC/MIC ratio target was calculated per MIC.
The median anidulafungin exposure of 65.7 mg · h/liter in our critically ill patients (4) was lower than the exposure of the general patient population. An anidulafungin maintenance dose of 170 mg seems appropriate to achieve an AUC of 110 mg · h/liter for a patient with this median anidulafungin exposure. This dose was calculated on the basis of the linear pharmacokinetics of anidulafungin (1) by dividing the AUC of the general patient population of 110 mg · h/liter by the achieved AUC and then multiplying the result by the administered dose (100 mg). A simulation of this increased dose was made with the pharmacokinetic model in MW\Pharm.
RESULTS
Study population.
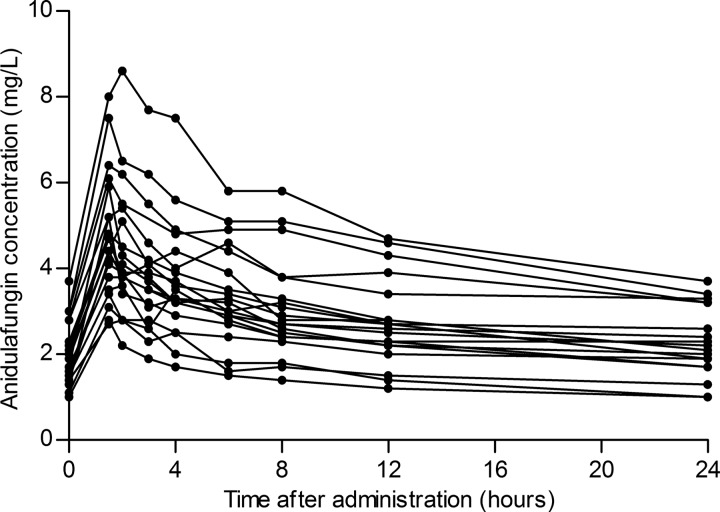
Blood samples were obtained from 20 patients, 11 male and 9 female, with a median age of 71 (60 to 75) years and a body mass index (BMI) of 25.8 (23.4 to 36.4) kg/m2. Patients received treatment with anidulafungin for 9 (7 to 15) days during their stay in the intensive care unit. Additional anidulafungin trough concentrations were measured in 15 patients, 2 (2 to 4) concentrations per patient, and they ranged from 1.2 mg/liter to 4.7 mg/liter. Figure 1 shows the obtained concentration-time curves. The measured anidulafungin maximum concentration of drug in plasma (Cmax) was 4.6 (3.6 to 5.7) mg/liter, and the minimum concentration of drug in plasma (Cmin) was 2.1 (1.8 to 3.1) mg/liter.
FIG 1.
Concentration-time curves of the 20 critically ill patients receiving 100 mg anidulafungin once daily.
Pharmacokinetics.
The observed AUC0–24 was 65.7 (57.3 to 85.0) mg · h/liter. The population pharmacokinetic parameters of the developed model were as follows: CL, 1.39 ± 0.488 liter/h/56 kg FFM; V1, 0.426 ± 0.164 liter/kg LBMc; Q, 7.94 ± 2.30 liter/h/56 kg FFM; V2, 0.514 ± 0.226 liter/kg LBMc (each presented as the population mean ± the standard deviation). The median values of the pharmacokinetic parameters of the model and the model during cross-validation based on all concentration-time curves, are presented in Table 1. The parameters of the cross-validation were not significantly different from the parameters of the model. The residual error parameters were 0.048 mg/liter (additive error) and 0.111 (proportional error). The predicted AUC0–24 values during the cross-validation with the n − 1 models were not significantly different (P = 0.254) from the values obtained with the developed model.
TABLE 1.
AUC0–24 values and population pharmacokinetic model parameters from the developed model and from the n − 1 models from the cross-validation
| Parametera | Model | Validation | P value |
|---|---|---|---|
| AUC0–24 (mg · h/liter) | 64.0 (55.3–84.2) | 64.0 (55.3–84.2) | 0.254 |
| CL (liter/h/56 kg FFM) | 1.26 (1.10–1.71) | 1.26 (1.11–1.71) | 0.062 |
| V1 (liter/kg LBMc) | 0.401 (0.338–0.529) | 0.401 (0.335–0.530) | 0.131 |
| Q (liter/h/56 kg FFM) | 7.79 (7.32–8.45) | 7.81 (7.48–8.39) | 0.550 |
| V2 (liter/kg LBMc) | 0.514 (0.439–0.657) | 0.520 (0.442–0.659) | 0.334 |
AUC0–24, area under the concentration-time curve over a 24-h dosing interval; CL, clearance; FFM, fat-free mass; LBMc, lean body mass corrected; V1, central volume of distribution; Q, intercompartmental clearance; V2, peripheral volume of distribution.
Limited-sampling strategies.
Table 2 shows the results of the limited-sampling module of MW\Pharm using Bayesian analysis for parameter estimation. The anidulafungin concentration measured 12 h after the start of the infusion seemed to be the most suitable time point for predicting the AUC0–24 with an acceptable bias and precision. The predicted AUC0–24 values during the cross-validation with the n − 1 models were not significantly different (P = 0.422) from the values obtained with the developed model. The mean ratio (90% CI) of the predicted exposures was 100.04% (99.67 to 100.40%).
TABLE 2.
Limited sampling strategies from the pharmacokinetic model in MW\Pharm and the linear regression
| Sampling time(s) (h) | MW\Pharm |
Linear regression |
||||
|---|---|---|---|---|---|---|
| R2 | Bias (%) | RMSE (%) | R2 | Bias (%) | RMSE (%) | |
| 12 | 0.89 | −0.1 | 9 | 0.99 | 0.05 | 3 |
| 8 | 0.80 | 0.8 | 12 | 0.97 | 0.7 | 6 |
| 24 | 0.79 | 1.3 | 12 | 0.91 | 0.7 | 10 |
| 1.5, 12 | 0.93 | −1.2 | 7 | 0.99 | 0.04 | 3 |
| 8, 12 | 0.93 | −0.9 | 7 | 0.99 | 0.1 | 3 |
| 1.5, 12, 24 | 0.97 | −1.3 | 5 | 0.99 | −0.02 | 3 |
| 1.5, 8, 12, 24 | 0.98 | −1.5 | 4 | 0.99 | 0.1 | 2 |
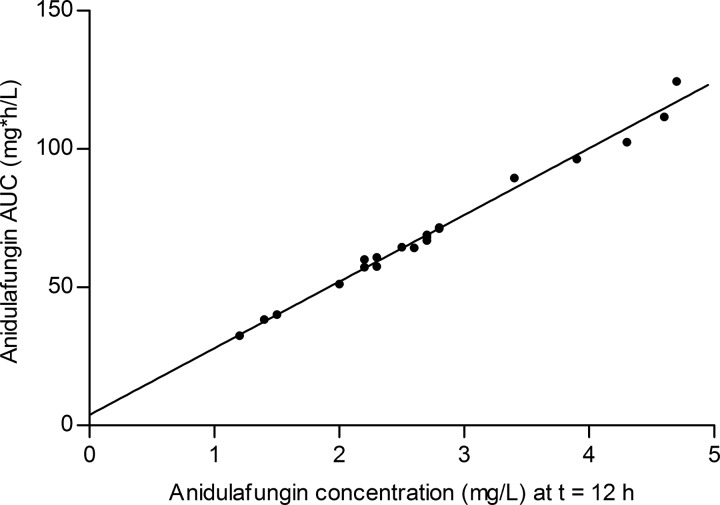
Data from the limited-sampling strategies based on linear regression analyses are presented in Table 2. The sampling time of the most suitable strategy for predicting the AUC0–24 using linear regression was also 12 h after the start of the infusion with anidulafungin. The equation of the corresponding regression line, which is illustrated in Fig. 2, was AUC0–24 = 3.8 + 24.1 · C (12). The predicted AUC0–24 values during the cross-validation with the n − 1 regression were not significantly different (P = 0.772) from the values obtained with the complete regression. The mean ratio (90% CI) of the predicted exposures was 99.97% (99.76 to 100.19%).
FIG 2.
The observed AUC0–24 versus the concentration measured 12 h after the start of the anidulafungin infusion.
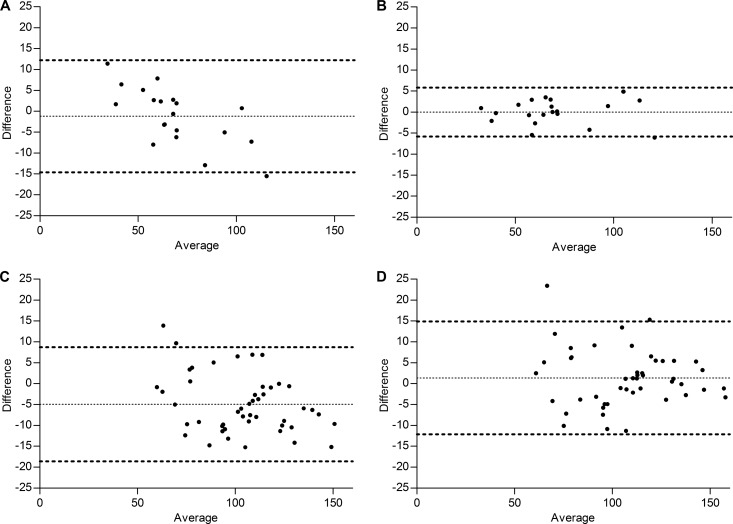
The Bland-Altman analyses of the correlation between the observed AUC0–24 and the predicted AUC0–24 using the pharmacokinetic model and the linear regression equation are shown in Fig. 3A and B, respectively. The mean ratios (90% CIs) of the predicted versus the observed anidulafungin exposure were 99.03% (96.56 to 101.50%) for the pharmacokinetic model and 100.05% (98.97 to 101.12%) for the linear regression analysis.
FIG 3.
Bland-Altman plots of the observed anidulafungin AUC0–24 versus the predicted AUC0–24 values with MW\Pharm (A) or regression analysis (B) for critically ill patients (n = 20) and Bland-Altman plots of the observed anidulafungin AUC0–24 versus the predicted AUC0–24 values with MW\Pharm (C) or regression analysis (D) for the healthy volunteers (n = 47).
External data set.
Data were obtained from 47 healthy volunteers, 38 male and 9 female, with a median age of 24 (22 to 33) years and a BMI of 24.2 (21.5 to 26.2) kg/m2. The observed anidulafungin AUC0–24 was 109.8 (86.7 to 122.4) mg · h/liter. The Bland-Altman analyses of the correlation between the observed AUC0-24 and the predicted AUC0–24 using the pharmacokinetic model and the linear regression equation are shown in Fig. 3C and D. The mean ratios (90% CIs) of the predicted versus the observed anidulafungin exposure were 95.39% (93.75 to 97.03%) for the pharmacokinetic model and 101.62% (99.89 to 103.35%) for the linear regression analysis.
Possible implications for clinical practice.
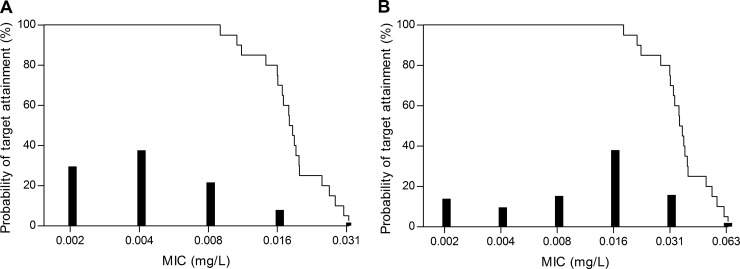
Figure 4 illustrates the specific clinical situations in which it can be necessary to determine anidulafungin exposure. In most patients, anidulafungin exposure will be sufficient after receiving the standard dose (i.e., a loading dose of 200 mg on day one and continuing with a maintenance dose of 100 mg once daily). The anidulafungin AUC of approximately one-quarter of the patients infected with a Candida species with MICs of 0.016 mg/liter for Candida albicans and 0.03 mg/liter for Candida glabrata is expected to be insufficient. For the very few patients with Candida species with MICs of 0.03 mg/liter for C. albicans and 0.06 mg/liter for C. glabrata, the exposure in most critically ill patients may be insufficient.
FIG 4.
The probability of target attainment versus the MIC for C. albicans (A) and C. glabrata (B) for critically ill patients. The bars represent the distribution of MICs based on EUCAST data.
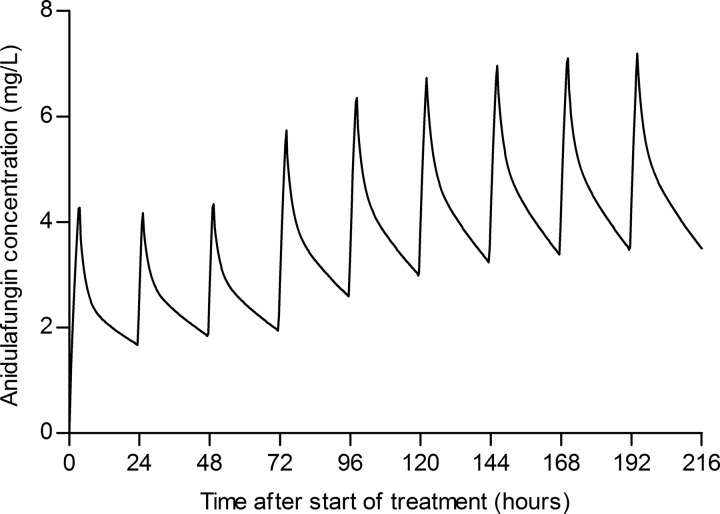
Figure 5 shows a pharmacokinetic simulation of the increased maintenance dose of 170 mg for a 75-year-old patient (BMI, 24.7 kg/m2) with an AUC of 64.5 mg · h/liter after the standard dose of 100 mg after a loading dose of 200 mg. The predicted AUC0–24 after 5 doses of 170 mg is 109.7 mg · h/liter.
FIG 5.
Simulation of an increased anidulafungin dose of 170 mg in a patient with an AUC0–24 of 64.5 mg · h/liter after a loading dose of 200 mg on day 1 and a dose of 100 mg anidulafungin once daily on days 2 and 3.
DISCUSSION
We demonstrate here that limited-sampling strategies can be used to predict anidulafungin exposure with acceptable precision and bias. Anidulafungin exposure can be estimated with the concentration from a single sample drawn 12 h after the start of infusion by either linear regression or using a population pharmacokinetic model.
This limited-sampling strategy can be advantageous for future research, including investigating the AUC/MIC ratio in daily practice and in specific clinical situations when the MIC is unknown or close to the clinical breakpoint since only one sample is required instead of a complete concentration-time curve. In the case of possible insufficient exposure, anidulafungin doses can be increased in a linear manner since anidulafungin exposure increases proportionally to the dose (1). Simulation of a linearly increased anidulafungin dose in our pharmacokinetic model supports this. Deviating from the standard dose is not included in the summary of product characteristics, however. There has been limited experience with increased anidulafungin doses in patients with Candida endocarditis. A double anidulafungin dose seemed to be well tolerated (13). A decrease of the anidulafungin dose seems currently unnecessary because adverse events are uncommon but might be considered in the future to decrease costs when more information is available about the AUC/MIC ratio in daily practice.
We used cross-validation for our pharmacokinetic model and linear regression analysis because this is an efficient method for reliable validation and evaluation of the accuracy and precision of limited-sampling strategies without the need for additional patients (14).
For anidulafungin, it appeared feasible to develop a limited-sampling strategy based on linear regression, which has some advantages. This method is easy to use without extensive knowledge or pharmacokinetic modeling software. The time point 12 h after the start of the infusion appeared to be the optimal sampling time for accurately estimating the anidulafungin exposure based on the linear regression analysis and the Bayesian analysis in MW\Pharm. This time point is convenient for daily practice in our intensive care units since this time point coincides with the time for routine sampling in most cases.
The strength of this study is that the developed limited-sampling strategies in critically ill patients were also investigated with data from healthy volunteers. Accurately estimating the anidulafungin exposure appeared possible using linear regression and the pharmacokinetic model in critically ill patients and in healthy volunteers. These two methods have their own advantages. Linear regression analysis is simple and easy to use and does not require pharmacokinetic software. However, limited sampling based on a pharmacokinetic model is more flexible regarding sampling times, and other data that can improve the predictive performance can be incorporated.
In conclusion, this study shows that anidulafungin exposure can be estimated accurately using a single blood sample drawn 12 h after the start of the infusion by using either linear regression or a pharmacokinetic model in critically ill patients and in less-ill patients, as reflected by healthy volunteers.
ACKNOWLEDGMENT
We thank Pfizer for kindly providing the data from healthy volunteers from drug interaction studies with cyclosporine (9) and tacrolimus (10).
REFERENCES
- 1.Theuretzbacher U. 2004. Pharmacokinetics/pharmacodynamics of echinocandins. Eur J Clin Microbiol Infect Dis 23:805–812. doi: 10.1007/s10096-004-1228-z. [DOI] [PubMed] [Google Scholar]
- 2.Andes D, Diekema DJ, Pfaller MA, Prince RA, Marchillo K, Ashbeck J, Hou J. 2008. In vivo pharmacodynamic characterization of anidulafungin in a neutropenic murine candidiasis model. Antimicrob Agents Chemother 52:539–550. doi: 10.1128/AAC.01061-07. [DOI] [PMC free article] [PubMed] [Google Scholar]
- 3.Andes D, Diekema DJ, Pfaller MA, Bohrmuller J, Marchillo K, Lepak A. 2010. In vivo comparison of the pharmacodynamic targets for echinocandin drugs against Candida species. Antimicrob Agents Chemother 54:2497–2506. doi: 10.1128/AAC.01584-09. [DOI] [PMC free article] [PubMed] [Google Scholar]
- 4.van Wanrooy MJ, Rodgers MG, Uges DR, Arends JP, Zijlstra JG, van der Werf TS, Kosterink JG, Alffenaar JW. 2014. Low but sufficient anidulafungin exposure in critically ill patients. Antimicrob Agents Chemother 58:304–308. doi: 10.1128/AAC.01607-13. [DOI] [PMC free article] [PubMed] [Google Scholar]
- 5.van Wanrooy MJ, Santoe RN, van der Elst KC, Wilmer CM, van Hateren K, Wessels AM, Greijdanus B, Alffenaar JW, Uges DR. 2013. Simultaneous quantification of anidulafungin and caspofungin in plasma by an accurate and simple liquid chromatography tandem mass-spectrometric method. Ther Drug Monit 35:778–784. doi: 10.1097/FTD.0b013e31829591a7. [DOI] [PubMed] [Google Scholar]
- 6.Proost JH, Eleveld DJ. 2006. Performance of an iterative two-stage Bayesian technique for population pharmacokinetic analysis of rich data sets. Pharm Res 23:2748–2759. doi: 10.1007/s11095-006-9116-0. [DOI] [PubMed] [Google Scholar]
- 7.Liu P, Ruhnke M, Meersseman W, Paiva JA, Kantecki M, Damle B. 2013. Pharmacokinetics of anidulafungin in critically ill patients with candidemia/invasive candidiasis. Antimicrob Agents Chemother 57:1672–1676. doi: 10.1128/AAC.02139-12. [DOI] [PMC free article] [PubMed] [Google Scholar]
- 8.Altman DG, Royston P. 2000. What do we mean by validating a prognostic model? Stat Med 19:453–473. doi:. [DOI] [PubMed] [Google Scholar]
- 9.Dowell JA, Stogniew M, Krause D, Henkel T, Weston IE. 2005. Assessment of the safety and pharmacokinetics of anidulafungin when administered with cyclosporine. J Clin Pharmacol 45:227–233. doi: 10.1177/0091270004270146. [DOI] [PubMed] [Google Scholar]
- 10.Dowell JA, Stogniew M, Krause D, Henkel T, Damle B. 2007. Lack of pharmacokinetic interaction between anidulafungin and tacrolimus. J Clin Pharmacol 47:305–314. doi: 10.1177/0091270006296764. [DOI] [PubMed] [Google Scholar]
- 11.Arendrup MC, Rodriguez-Tudela JL, Lass-Florl C, Cuenca-Estrella M, Donnelly JP, Hope W, European Committee on Antimicrobial Susceptibility Testing-Subcommittee on Antifungal Susceptibility Testing (EUCAST-AFST) . 2011. EUCAST technical note on anidulafungin. Clin Microbiol Infect 17:E18–E20. doi: 10.1111/j.1469-0691.2011.03647.x. [DOI] [PubMed] [Google Scholar]
- 12.Pfizer. 2012. Ecalta: summary of product characteristics. Pfizer, New York, NY. [Google Scholar]
- 13.De Rosa FG, D'Avolio A, Corcione S, Baietto L, Raviolo S, Centofanti P, Pasero D, Rinaldi M, Di Perri G. 2012. Anidulafungin for Candida glabrata infective endocarditis. Antimicrob Agents Chemother 56:4552–4553. doi: 10.1128/AAC.00515-12. [DOI] [PMC free article] [PubMed] [Google Scholar]
- 14.Proost JH. 2007. Validation of limited sampling models (LSM) for estimating AUC in therapeutic drug monitoring—is a separate validation group required? Int J Clin Pharmacol Ther 45:402–409. doi: 10.5414/CPP45402. [DOI] [PubMed] [Google Scholar]


