

Abstract
♦ Background: The effect of high peritoneal dialysate glucose concentration (PDGC) on all-cause and cardiovascular disease (CVD) mortality in peritoneal dialysis (PD) patients is unclear.
♦ Objective: Our study aimed to investigate the effect of high PDGC on all-cause and CVD mortality in continuous ambulatory PD (CAPD) patients.
♦ Methods: The study enrolled 716 patients newly initiated on CAPD therapy between January 2006 and December 2010. We allocated the patients to low (<1.56%), medium (≥1.56% to <1.74%), and high (≥1.74%) average PDGC groups according to the tertile of average PDGC in the first 6 months after PD initiation. Cox regression and ordinal logistic regression were used to analyze determinants of mortality and of PDGC use respectively.
♦ Results: Mean follow-up in the study cohort was 31 ± 15 months. The all-cause mortality was 4.7 events per 100 patient-years, and the leading cause of death was CVD. Patients with a higher PDGC had significantly higher cumulative rates of all-cause (log-rank p < 0.001) and CVD mortality (log-rank p < 0.001). In Cox regression analysis, high PDGC independently predicted higher all-cause (hazard ratio: 2.63; p = 0.004) and CVD mortality (hazard ratio: 2.78; p = 0.01). Compared with a lower PDGC, a higher PDGC was significantly associated with older age [odds ratio (OR): 1.02; p < 0.001], low residual renal function (OR: 0.91; p < 0.001), and high dialysate-to-plasma ratio of creatinine (OR: 28.61; p < 0.001) in ordinal logistic regression.
♦ Conclusions: Higher PDGC is associated with higher allcause and CVD mortality in CAPD patients.
Keywords: Cardiovascular disease, mortality, outcomes, peritoneal dialysate, glucose concentration
Cardiovascular disease (CVD) is the leading cause of death in peritoneal dialysis (PD) patients, accounting for approximately 50% of all-cause mortality in Asian and white adult PD populations (1,2).
Glucose remains the traditional osmotic agent in PD solutions because of its low price and efficiency and because it is easily metabolized (3). However, a high peritoneal dialysate glucose concentration (PDGC) may induce metabolic syndrome, with manifestations of hyperglycemia, hypertension, dyslipidemia, and overweight (3–5). Moreover, PD patients with metabolic syndrome experience higher CVD mortality than do those without the syndrome (6). Wu et al. recently indicated that higher PDGC is associated with worse survival in PD patients (7,8). However, whether high PDGC predicts allcause and CVD mortality in PD patients is not clear.
In this retrospective study, we investigated the effect of high PDGC on all-cause and CVD mortality in continuous ambulatory PD (CAPD) patients.
Methods
The Institutional Review Board of the First Affiliated Hospital of Sun Yat-sen University approved this retrospective study. Written informed consent was not required because we retrospectively collected available medical records in the hospital.
Inclusion and Exclusion Criteria for Study Participants
These inclusion criteria were applied: patient received CAPD for more than 6 months, was more than 18 years of age, and was regularly followed every 3 – 6 months. Patients were excluded if they had previously undergone PD, if their PD technique survival was less than 6 months, if they were pregnant or had an active malignancy, and if they were irregularly followed so that their events and PDGC from the first 6 months were not available.
Of 941 patients who initiated PD therapy at our center between January 2006 and December 2010, 225 were excluded, including 16 patients who were younger than 18, 15 who had previously undergone PD, 21 with a PD technique survival of less than 6 months, 10 patients with active malignancy, and 163 patients with irregular follow-up, whose events and PDGC for the first 6 months were not available. The remaining 716 patients were enrolled and followed to February 2012.
Peritoneal Transport Characteristics and PD Adequacy
Peritoneal solute transport was evaluated by a peritoneal equilibration test at the end of the first month after CAPD initiation. Using 24-hour urine and effluent collections, Kt/V (total, peritoneal, and renal) and residual renal function (RRF) were measured. The PD Adequest 2.0 software (Baxter Healthcare Corporation, Deerfield, IL, USA) was used to perform the calculation.
Clinical Data
We reviewed the clinical data for each patient—including age, sex, height, weight, blood pressure, primary kidney disease, peritoneal and renal Kt/V, dialysate-to-plasma ratio of creatinine (D/P Cr), RRF, daily urine output, comorbid diseases, and laboratory values—at the end of the first month after PD initiation. Patients with a body mass index of 23 kg/m2 or greater were defined as overweight (9). Comorbid diseases included CVD (defined as myocardial infarction, angina, congestive heart failure, cerebrovascular event, or peripheral vascular disease with or without amputation), impaired fasting glucose [defined as 100 – 108 mg/dL (5.6 – 6.0 mmol/L) (10)], and diabetes mellitus (DM).
Calculation of Average Pdgc
We collected each patient’s dialysis prescription in the first 6 months after PD initiation. Average PDGC was calculated as the total weight of glucose in the PD solution divided by the total solution volume. The patients were allocated to one of three groups according to average PDGC tertile: low PDGC (<1.56%), medium PDGC (≥1.56% to <1.74%), and high PDGC (≥1.74%).
Statistical Analyses
Characteristics of the study patients are reported as means ± standard deviation or medians with interquartile range (Q25, Q75) for continuous variables, and as percentages or frequencies for categorical variables. For the descriptive analysis, continuous variables were analyzed using one-way analysis of variance or nonparametric tests, and categorical variables were analyzed using the Pearson chi-square test. Cumulative all-cause and CVD mortality curves were constructed using the Kaplan–Meier method and compared using the Mantel–Cox log-rank test. In multivariate analysis, risk factors for all-cause and CVD mortality were assessed in Cox models. Time at risk started at 6 months after PD start. Center transfer, transplantation, and hemodialysis transfer led to censoring. The Cox models were built based on biologic significance, including age, sex, overweight, pre-existing DM, pre-existing CVD, Kt/V, transport status, RRF, serum albumin, and PDGC. We performed ordinal logistic regression analysis to determine individual factors affecting average PDGC. A two-sided p value less than 0.05 was considered statistically significant. Statistical analyses were performed using the SPSS software application (version 16: SPSS, Chicago, IL, USA).
Results
Baseline Characteristics
We compared baseline characteristics for the patients enrolled in the study (n = 716) and those excluded because of irregular follow-up (n = 163). No differences were found with respect to age, sex, body weight, and proportion of pre-existing DM or CVD between the groups (data not shown). However, compared with the study patients, the patients with irregular follow-up had higher mortality (19.6% vs 12.2%, p = 0.01), mean baseline arterial pressure (103 ± 13 mmHg vs 100 ± 11 mmHg, p = 0.01), hemoglobin (9.4 ± 1.7 g/dL vs 8.6 ± 2.2 g/dL, p < 0.001), serum albumin (37 ± 5 g/dL vs 36 ± 5 g/dL, p = 0.03), and fasting glucose (104.5 ± 52.2 mg/dL vs 93.7 ± 37.8 mg/dL, p = 0.04).
The 404 men and 312 women enrolled in the study had a mean age of 51 ± 15 years. Mean follow-up in the overall cohort was 31 ± 15 months. The causes of end-stage renal disease (ESRD) were glomerulonephritis (60%), diabetic nephropathy (15%), hypertensive nephropathy (4%), lupus nephritis (1%), and others (20%). Overweight, CVD, and DM were present in 29%, 26%, and 22% of the patients respectively.
Table 1 shows the clinical characteristics of patients in the three PDGC groups. Compared with patients in the lower PDGC group, patients in the higher PDGC group were older; had lower levels of Kt/V, RRF, daily urine output, and serum albumin; had higher levels of D/P Cr and fasting glucose; and had a higher proportion of pre-existing DM and CVD. More patients in the high PDGC group also took angiotension II receptor blockers and calcium channel blockers.
TABLE 1.
Demographic and Baseline Clinical Data for the Study Patients
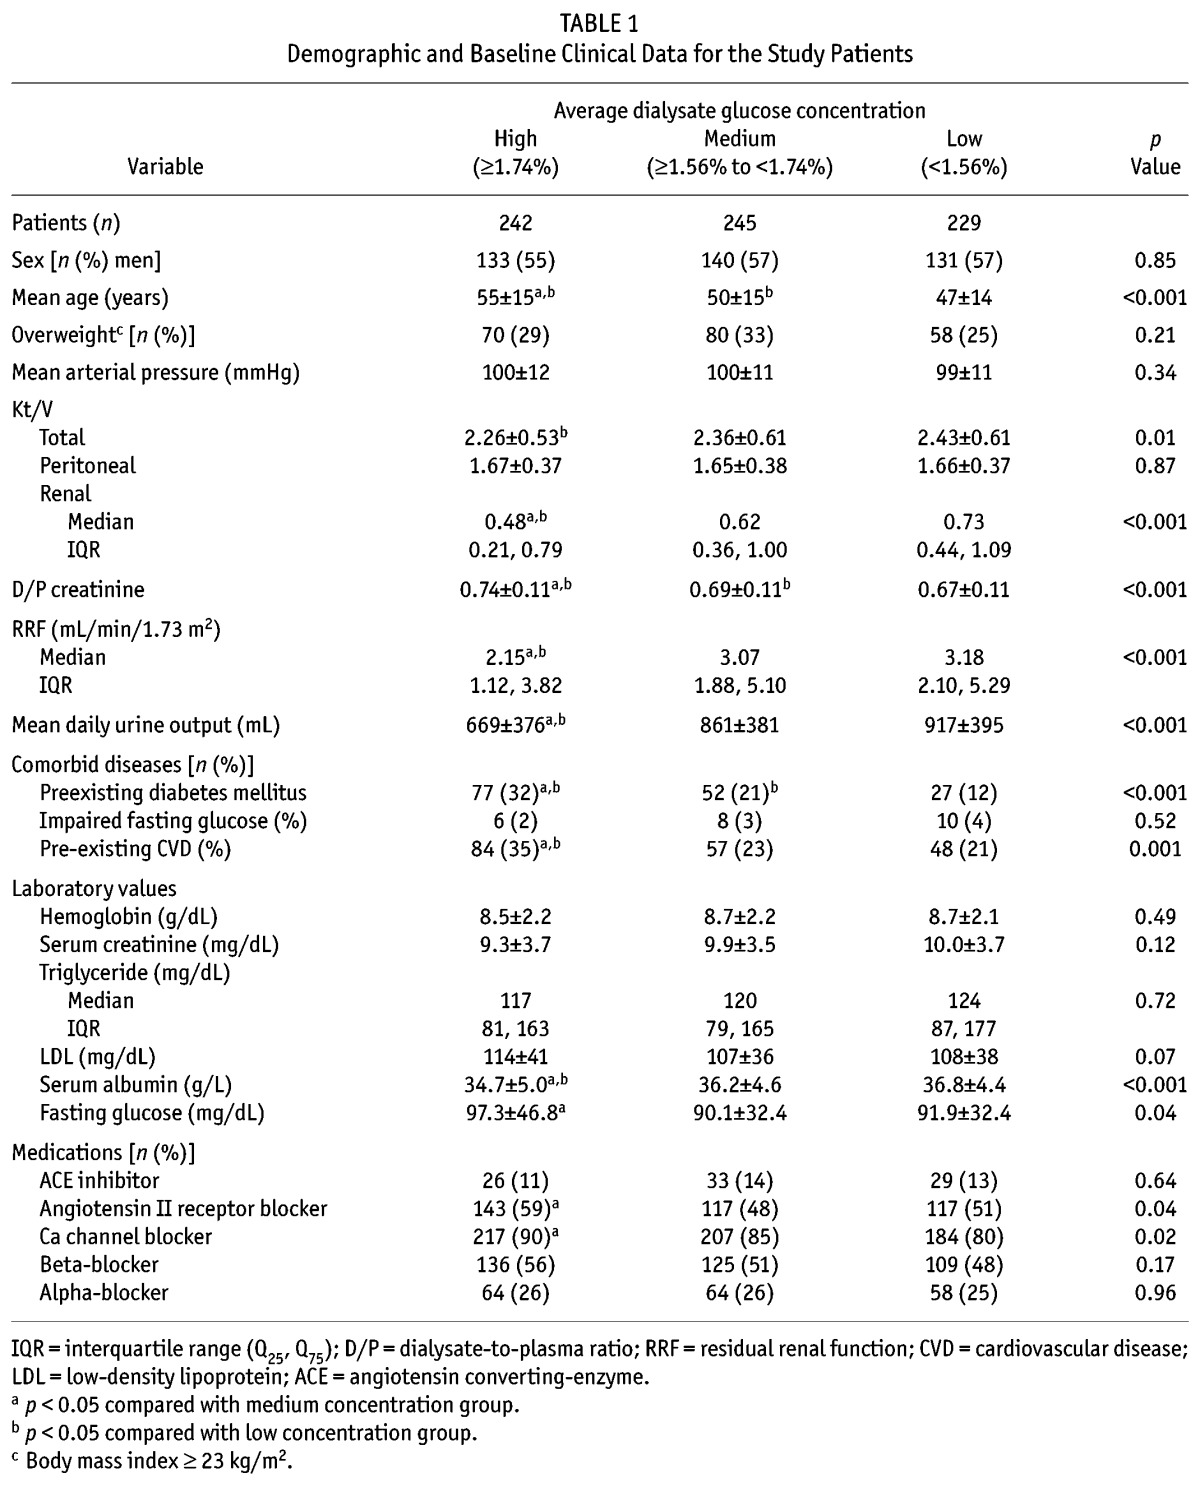
Figure 1 shows the frequency distribution of average PDGC in the study patients, the median value being 1.64% (interquartile range: 1.54% – 1.80%).
Figure 1 —
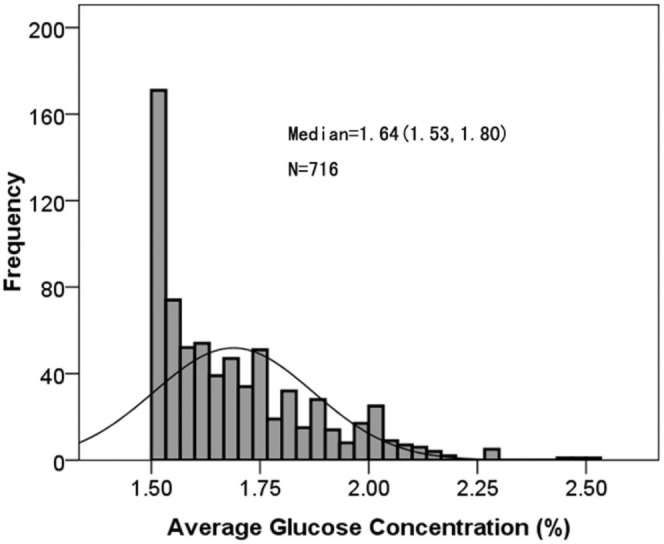
Frequency distribution of average dialysate glucose concentration in the first 6 months after initiation of peritoneal dialysis in 716 continuous ambulatory peritoneal dialysis patients. The average dialysate glucose concentration was calculated using the formula: (total glucose weight) / (total solution volume).
Incidence of All-Cause and CVD Mortality
By the end of follow-up, 221 patients had stopped CAPD (Table 2) for reasons including renal transplantation (n = 70), death (n = 87), transfer to hemodialysis (n = 44), and transfer to other PD centers (n = 20).
TABLE 2.
Reasons for Patient Withdrawal from Peritoneal Dialysis (PD)

The observed all-cause mortality was 4.7 events per 100 patient–years in this cohort. The leading cause of death was CVD (3.1 events per 100 patient–years, Table 2). Cumulative all-cause mortality in the 1st, 2nd, and 3rd years was, respectively, 9%, 17%, and 34% in the high PDGC group; 7%, 10%, and 19% in the medium PDGC group; and 3%, 6%, and 10% in the low PDGC group. Kaplan–Meier mortality curves showed a significant increase in all-cause mortality in patients with a higher PDGC [log-rank test: 20.72; p < 0.001; Figure 2(A)]. Moreover, cumulative CVD mortality in the 1st, 2nd, and 3rd year was, respectively, 6%, 11%, and 26% in the high PDGC group; 5%, 6%, and 11% in the medium PDGC group; and 2%, 5%, and 5% in the low PDGC group. Kaplan-Meier mortality curves showed a significant increase in CVD mortality in patients with a higher PDGC [log-rank test: 15.21; p < 0.001; Figure 2(B)].
Figure 2 —

Cumulative (A) all-cause and (B) cardiovascular disease (CVD) mortality in 716 continuous ambulatory peritoneal dialysis patients by dialysate glucose concentration (low: <1.56%, n = 229; medium: ≥1.56% to <1.74%, n = 245; and high ≥1.74%, n = 242). Mortality curves were constructed using the Kaplan-Meier method and compared using the Mantel-Cox log-rank test. Patients in the high concentration group showed higher all-cause and CVD mortality.
Risk Factors for All-Cause and CVD Mortality
Cox regression analysis showed that older age [hazard ratio (HR): 1.04; 95% confidence interval (CI): 1.02 to 1.06; p < 0.001], pre-existing DM (HR: 1.66; 95% CI: 1.00 to 2.75; p = 0.048), and high PDGC (HR: 2.63; 95% CI: 1.36 to 5.08; p = 0.004) are independent predictors of all-cause mortality in CAPD patients. Older age (HR: 1.03; 95% CI: 1.00 to 1.05; p = 0.02) and high PDGC (HR: 2.78; 95%CI: 1.24 to 6.24; p = 0.01) were independent predictors of CVD mortality in CAPD patients (Table 3).
TABLE 3.
Independent Effects of Risk Factors on All-Cause and Cardiovascular Disease (CVD) Mortality in the Study Patients by Cox Regression Analysis

Determinants for Average PDGC
Ordinal logistic regression analysis showed that older age [odds ratio (OR): 1.02; 95% CI: 1.01 to 1.03; p < 0.001], low RRF (OR: 0.91; 95% CI: 0.86 to 0.97; p < 0.001), and high D/P Cr (OR: 28.61; 95% CI: 7.41 to 110.48; p < 0.001) were independently associated with higher PDGC, but not with lower PDGC (Table 4).
TABLE 4.
Independent Effects of Risk Factors on Average Dialysate Glucose Concentration in the Study Patients by Ordinal Logistic Regression Analysis

Discussion
In the present study, we showed that, compared with CAPD patients having a lower PDGC, those having a higher PDGC experienced higher all-cause and CVD mortality. High PDGC independently predicted all-cause and CVD mortality in long-term CAPD patients. Moreover, older age, low RRF, and high D/P Cr were risk factors for a high average PDGC in CAPD patients.
Glucose is low-priced, efficient, and easily metabolized, which is why it is the main osmotic agent in PD solutions (3). However, a high average PDGC might, over the long term, heighten the risk of mortality. Researchers in Taiwan performed a retrospective analysis of 90 PD patients with varying average PDGC values (7), and they showed a borderline association between higher PDGC and worse patient survival (log-rank p = 0.10) and a significantly worse technique survival (log-rank p = 0.002). Their most recent study, which recruited 173 PD patients, indicated that higher average PDGC is significantly correlated with worse patient survival (log-rank p = 0.03) and technique survival (log-rank p = 0.06) (8). Our study also showed that a higher PDGC was significantly associated with higher cumulative all-cause mortality in 716 CAPD patients. Moreover, we found that CAPD patients with a higher PDGC experienced a significant increase in cumulative CVD mortality, a finding that has not previously been reported.
Cardiovascular disease remains the leading cause of mortality in patients with ESRD, and cardiac and cerebrovascular causes account for 65% of mortality in ESRD patients receiving long-term PD (11). In our study, CVD mortality was also the leading cause of all-cause death (Table 2). In implementing specific treatment strategies, an assessment of CVD mortality predictors is important. Several modifiable risk factors associated with CVD mortality in ESRD patients have been found. In 25 588 patients on hemodialysis therapy, Tentori et al. (12) found that higher levels of calcium, phosphorus, and parathyroid hormone were correlated with increased CVD mortality. Echida et al. (13) suggested that serum non-high-density lipoprotein cholesterol was a significant CVD mortality predictor in chronic hemodialysis patients. Hypoalbuminemia and higher C-reactive protein were found to be risk factors for CVD mortality in Japanese hemodialysis patients (14). However, Isbel et al. (15) showed that improvement of hyperphosphatemia, dyslipidemia, hypertension, and anemia did not result in an effective reduction in CVD mortality in ESRD patients.
Our study showed that high PDGC independently predicted all-cause mortality in CAPD patients. Moreover, high PDGC was also an independent risk factor for CVD mortality (Table 3). Although Wu et al. (8) reported that higher PDGC is associated with significantly worse patient survival (HR: 6.23; 95% CI: 1.26 to 30.74) in PD patients, the authors did not discuss the relationship between high PDGC and CVD mortality. Indeed, higher PDGC in PD solution is usually correlated with worse fluid control, more peritoneal damage, and more glucose uptake from the peritoneum (3,16,17). In addition, more glucose uptake from the peritoneum leads to an increase in insulin resistance and high blood glucose, resulting in DM in the long term (18). High average PDGC induces metabolic syndrome, with manifestations of hyperglycemia, hypertension, dyslipidemia, and overweight (3–5). Mortality from CVD is higher in PD patients with metabolic syndrome than in those without metabolic syndrome (6). Many studies have suggested that applying low-glucose regimens is a promising strategy to preserve peritoneal membrane integrity and RRF in PD patients (19–21). Although our study suggested that lower PDGC was associated with lower all-cause and CVD mortality in CAPD patients, large randomized trials are required to confirm the benefit of low-glucose regimens on clinical outcomes.
For better control of PDGC in PD patients, we investigated risk factors for high PDGC by ordinal logistic regression. We found that, compared with lower PDGC, higher PDGC was significantly correlated with older age, low RRF, and high D/P Cr (Table 4). Older PD patients often have malnutrition and more comorbidities (22). Low RRF and a high peritoneal transport rate are associated with higher overall mortality in PD patients (23). Liao et al. (24) reported that the rate of RRF decline is associated with all-cause mortality and technique survival in patients on long-term PD. A meta-analysis showed that a higher peritoneal transport rate is significantly associated with higher patient mortality (25). A higher peritoneal transport rate is also a risk factor for rapid loss of RRF, which may lead to dialysis inadequacy in PD patients (26,27). Lower RRF and a higher peritoneal transport rate are correlated with higher peritoneal glucose exposure (28,29). Patients with low RRF and a high peritoneal transport rate are prone to fluid overload, which requires high PDGC to eliminate overhydration (30,31). In our study, high PDGC was an independent risk factor for all-cause and CVD death after adjustment for RRF, Kt/V, and D/P Cr. Indeed, high PDGC may aggravate peritoneal membrane damage and induce ultrafiltration failure (32,33), which both contribute to increased mortality in the long term. Preserving RRF and strengthening management in high peritoneal transport may therefore help to break this vicious cycle and reduce all-cause and CVD mortality in CAPD patients.
Limitations
Our study has a few limitations, including its observational design and the fact that it was conducted at a single center. Also, the prevalence of DM at our center is low and differs from that in other centers. The applicability of our findings to the general PD population is therefore limited. Also, follow-up in the study was relatively short. To overcome those limitations, a prospective multicenter study with longer follow-up is warranted.
Conclusions
Our study shows that CAPD patients with higher PDGC experience higher all-cause and CVD mortality than do those with lower PDGC. High PDGC independently predicted all-cause and CVD mortality in long-term CAPD patients. Older age, low RRF, and high D/P Cr are independently associated with high PDGC in CAPD patients.
Disclosures
The authors declare that they have no financial conflicts of interest.
Acknowledgments
This study was supported by projects supported by the National Key Technology Research and Development Program of the Ministry of Science and Technology of China (grant no. 2011BAI10B05), the National Basic Research Program of China (grant no. 2011CB504005), the Key Clinical Discipline Program of the Ministry of Health, China (grant no. [2010]439). We especially thank Professor Zhibin Li for statistical assistance and PD nurse Jianxiong Lin for collecting patient data. We also thank the patients and other personnel involved in the study.
REFERENCES
- 1. Szeto CC, Wong TY, Chow KM, Leung CB, Li PK. Are peritoneal dialysis patients with and without residual renal function equivalent for survival study? Insight from a retrospective review of the cause of death. Nephrol Dial Transplant 2003; 18:977–82. [DOI] [PubMed] [Google Scholar]
- 2. National Kidney Foundation. K/DOQI clinical practice guidelines for chronic kidney disease: evaluation, classification, and stratification. Am J Kidney Dis 2002; 39(Suppl 1):S1–266. [PubMed] [Google Scholar]
- 3. Holmes C, Mujais S. Glucose sparing in peritoneal dialysis: implications and metrics. Kidney Int Suppl 2006; (103):S104–9. [DOI] [PubMed] [Google Scholar]
- 4. Liu J, Rosner MH. Lipid abnormalities associated with end-stage renal disease. Semin Dial 2006; 19:32–40. [DOI] [PubMed] [Google Scholar]
- 5. Rasić S, Hadzović-Dzuvo A, Rebić D, Uncanin S, Hadzić A, Mujaković A, et al. The metabolic syndrome in patients on peritoneal dialysis: prevalence and influence on cardiovascular morbidity. Bosn J Basic Med Sci 2010; 10(Suppl 1):S3–7. [DOI] [PMC free article] [PubMed] [Google Scholar]
- 6. Li PK, Kwan BC, Ko GT, Chow KM, Leung CB, Szeto CC. Treatment of metabolic syndrome in peritoneal dialysis patients. Perit Dial Int 2009; 29(Suppl 2):S149–52. [PubMed] [Google Scholar]
- 7. Wu HY, Hung KY, Huang JW, Chen YM, Tsai TJ, Wu KD. Initial glucose load predicts technique survival in patients on chronic peritoneal dialysis. Am J Nephrol 2008; 28:765–71. [DOI] [PubMed] [Google Scholar]
- 8. Wu HY, Hung KY, Huang TM, Hu FC, Peng YS, Huang JW, et al. Safety issues of long-term glucose load in patients on peritoneal dialysis—a 7-year cohort study. PLoS One 2012; 7:e30337. [DOI] [PMC free article] [PubMed] [Google Scholar]
- 9. Ko GT, Tang J, Chan JC, Sung R, Wu MM, Wai HP, et al. Lower BMI cut-off value to define obesity in Hong Kong Chinese: an analysis based on body fat assessment by bioelectrical impedance. Br J Nutr 2001; 85:239–42. [DOI] [PubMed] [Google Scholar]
- 10. Szeto CC, Chow KM, Kwan BC, Chung KY, Leung CB, Li PK. New-onset hyperglycemia in nondiabetic Chinese patients started on peritoneal dialysis. Am J Kidney Dis 2007; 49:524–32. [DOI] [PubMed] [Google Scholar]
- 11. Wang AY, Wang M, Woo J, Lam CW, Lui SF, Li PK, et al. Inflammation, residual kidney function, and cardiac hypertrophy are interrelated and combine adversely to enhance mortality and cardiovascular death risk of peritoneal dialysis patients. J Am Soc Nephrol 2004; 15:2186–94. [DOI] [PubMed] [Google Scholar]
- 12. Tentori F, Blayney MJ, Albert JM, Gillespie BW, Kerr PG, Bommer J, et al. Mortality risk for dialysis patients with different levels of serum calcium, phosphorus, and PTH: the Dialysis Outcomes and Practice Patterns Study (DOPPS). Am J Kidney Dis 2008; 52:519–30. [DOI] [PubMed] [Google Scholar]
- 13. Echida Y, Ogawa T, Otsuka K, Ando Y, Nitta K. Serum non-high-density lipoprotein cholesterol (non-HDL-C) levels and cardiovascular mortality in chronic hemodialysis patients. Clin Exp Nephrol 2012; 16:767–72. [DOI] [PubMed] [Google Scholar]
- 14. Takahashi R, Ito Y, Takahashi H, Ishii H, Kasuga H, Mizuno M, et al. Combined values of serum albumin, C-reactive protein and body mass index at dialysis initiation accurately predicts long-term mortality. Am J Nephrol 2012; 36:136–43. [DOI] [PubMed] [Google Scholar]
- 15. Isbel NM, Haluska B, Johnson DW, Beller E, Hawley C, Marwick TH. Increased targeting of cardiovascular risk factors in patients with chronic kidney disease does not improve atheroma burden or cardiovascular function. Am Heart J 2006; 151:745–53. [DOI] [PubMed] [Google Scholar]
- 16. Wu HY, Hung KY, Hu FC, Chen YM, Chu TS, Huang JW, et al. Risk factors for high dialysate glucose use in PD patients— a retrospective 5-year cohort study. Perit Dial Int 2010; 30:448–55. [DOI] [PubMed] [Google Scholar]
- 17. Grodstein GP, Blumenkrantz MJ, Kopple JD, Moran JK, Coburn JW. Glucose absorption during continuous ambulatory peritoneal dialysis. Kidney Int 1981; 19:564–7. [DOI] [PubMed] [Google Scholar]
- 18. Kadota A, Hozawa A, Okamura T, Kadowak T, Nakmaura K, Murakami Y, et al. Relationship between metabolic risk factor clustering and cardiovascular mortality stratified by high blood glucose and obesity: NIPPON DATA90, 1990-2000. Diabetes Care 2007; 30:1533–8. [DOI] [PubMed] [Google Scholar]
- 19. le Poole CY, van Ittersum FJ, Weijmer MC, Valentijn RM, ter Wee PM. Clinical effects of a peritoneal dialysis regimen low in glucose in new peritoneal dialysis patients: a randomized crossover study. Adv Perit Dial 2004; 20:170–6. [PubMed] [Google Scholar]
- 20. Kim SG, Kim S, Hwang YH, Kim K, Oh JE, Chung W, et al. Could solutions low in glucose degradation products preserve residual renal function in incident peritoneal dialysis patients? A 1-year multicenter prospective randomized controlled trial (Balnet Study). Perit Dial Int 2008; 28(Suppl 3):S117–22. [PubMed] [Google Scholar]
- 21. Williams JD, Topley N, Craig KJ, Mackenzie RK, Pischetsrieder M, Lage C, et al. The Euro-Balance Trial: the effect of a new biocompatible peritoneal dialysis fluid (Balance) on the peritoneal membrane. Kidney Int 2004; 66:408–18. [DOI] [PubMed] [Google Scholar]
- 22. Ho-dac-Pannekeet MM. PD in the elderly—a challenge for the (pre)dialysis team. Nephrol Dial Transplant 2006; 21(Suppl 2):ii60–2. [DOI] [PubMed] [Google Scholar]
- 23. Chung SH, Heimbürger O, Stenvinkel P, Qureshi AR, Lindholm B. Association between residual function, inflammation and patient survival in new peritoneal dialysis patients. Nephrol Dial Transplant 2003; 18:509–7. [DOI] [PubMed] [Google Scholar]
- 24. Liao CT, Chen YM, Shiao CC, Hu FC, Huang JW, Kao TW, et al. Rate of decline of residual renal function is associated with all-cause mortality and technique in patients on long-term peritoneal dialysis. Nephrol Dial Transplant 2009; 24:2909–14. [DOI] [PubMed] [Google Scholar]
- 25. Brimble KS, Walker M, Margetts PJ, Kundhal KK, Rabbat CG. Meta-analysis: peritoneal membrane transport, mortality, and technique failure in peritoneal dialysis. J Am Soc Nephrol 2006; 17:2591–8. [DOI] [PubMed] [Google Scholar]
- 26. Johnson DW, Mudge DW, Sturtevant JM, Hawley CM, Campbell SB, Isbel NM, et al. Predictors of decline of residual renal function in new peritoneal dialysis patients. Perit Dial Int 2003; 23:276–83. [PubMed] [Google Scholar]
- 27. Watsuda A, Matsumura O, Ogawa T, Tayama Y, Motojima M, Maeda T, et al. Contribution of residual renal function on peritoneal solute transport in dialysis patients. Am J Nephrol 2010; 32:187–93. [DOI] [PubMed] [Google Scholar]
- 28. Davies SJ, Phillips L, Naish PF, Russell GI. Peritoneal glucose exposure and changes in membrane solute transport with time on peritoneal dialysis. J Am Soc Nephrol 2001; 12:1046–51. [DOI] [PubMed] [Google Scholar]
- 29. Hung KY, Huang JW, Tsai TJ, Chen WY. Natural changes in peritoneal equilibration test results in continuous ambulatory peritoneal dialysis patients: a retrospective, seven year cohort survey. Artif Organs 2000; 24:261–4. [DOI] [PubMed] [Google Scholar]
- 30. Gan HB, Chen MH, Lindholm B, Wang T. Volume control in diabetic and nondiabetic peritoneal dialysis patients. Int Urol Nephrol 2005; 37:575–9. [DOI] [PubMed] [Google Scholar]
- 31. Cheng LT, Tang W, Wang T. Strong association between volume status and nutritional status in peritoneal dialysis patients. Am J Kidney Dis 2005; 45:891–902. [DOI] [PubMed] [Google Scholar]
- 32. Davenport A, Willicombe MK. Does diabetes mellitus predispose to increased fluid overload in peritoneal dialysis patients? Nephron Clin Pract 2010; 114:c60–6. [DOI] [PubMed] [Google Scholar]
- 33. Goffin E. Peritoneal membrane structural and functional changes during peritoneal dialysis. Semin Dial 2008; 21:258–65. [DOI] [PubMed] [Google Scholar]