Abstract
Objective:
To investigate the generation, spectral characteristics, and potential clinical significance of brain activity preceding interictal epileptiform spike discharges (IEDs) recorded with intracranial EEG.
Methods:
Seventeen adult patients with drug-resistant temporal lobe epilepsy were implanted with intracranial electrodes as part of their evaluation for epilepsy surgery. IEDs detected on clinical macro- and research microelectrodes were analyzed using time-frequency spectral analysis.
Results:
Gamma frequency oscillations (30–100 Hz) often preceded IEDs in spatially confined brain areas. The gamma-IEDs were consistently observed 35 to 190 milliseconds before the epileptiform spike waveforms on individual macro- and microelectrodes. The gamma oscillations associated with IEDs had longer duration (p < 0.001) and slightly higher frequency (p = 0.045) when recorded on microelectrodes compared with clinical macroelectrodes. Although gamma-IEDs comprised only a subset of IEDs, they were strongly associated with electrodes in the seizure onset zone (SOZ) compared with the surrounding brain regions (p = 0.004), in sharp contrast to IEDs without preceding gamma oscillations that were often also detected outside of the SOZ. Similar to prior studies, isolated pathologic high-frequency oscillations in the gamma (30–100 Hz) and higher (100–600 Hz) frequency range, not associated with an IED, were also found to be associated with SOZ.
Conclusions:
The occurrence of locally generated gamma oscillations preceding IEDs suggests a mechanistic role for gamma in pathologic network activity generating IEDs. The results show a strong association between SOZ and gamma-IEDs. The potential clinical application of gamma-IEDs for mapping pathologic brain regions is intriguing, but will require future prospective studies.
Interictal epileptiform spike discharges (IEDs) manifest as sharp-wave deflections in the local field potential recorded within the “irritative zone” of epileptic brain.1 The irritative zone is distinct from the seizure onset zone (SOZ), where the ictal discharge is first observed. The relationship between the 2 zones or between IEDs and seizures remains unclear (for review, see de Curtis and Avanzini2). In particular, the processes underlying IED generation are not well understood, and on a cellular level, recordings show a heterogeneous profile of increased, decreased, or unchanged neuronal firing during IEDs.3,4 Furthermore, the spatial extent of IEDs and their association with SOZ has long been recognized to be highly variable.2
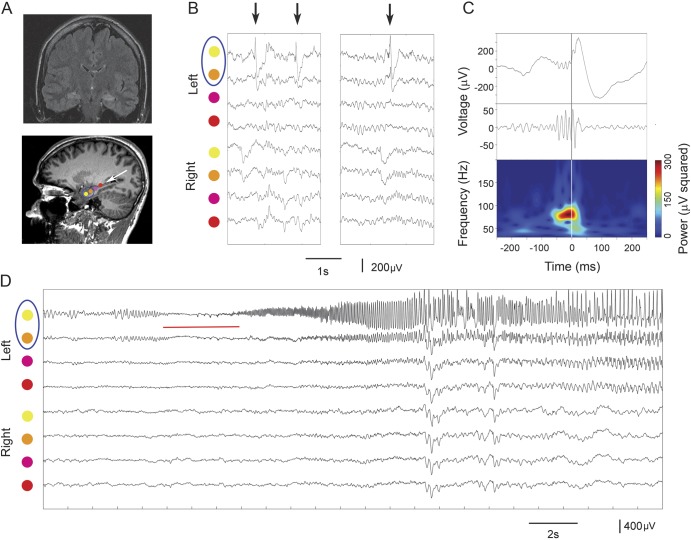
Network local field potential oscillations that can be detected with intracranial EEG (iEEG) provide a powerful window into synchronized activity of neuronal populations. Oscillations in the gamma frequency range (30–100 Hz) were recently implicated in the neuronal network generation of ictal-like discharges in an in vitro model of epilepsy5 (figure 1). Similarly, gamma frequency oscillations have recently been observed to precede IED onset in humans.4 There is increasing evidence from multiple research groups supporting that high-frequency oscillations (HFOs) in the ripple (100–250 Hz) and fast ripple (250–600 Hz) frequencies associated with IEDs are a biomarker of epileptogenic brain,6,7 but little has been reported about the role of gamma oscillations in generation of IEDs and their association with SOZ. In this study, we applied spectral analysis and characterized the gamma-range oscillations preceding IEDs on macro- and microspatial scales (0.1–10 mm) within and outside the SOZ.
Figure 1. Gamma-IEDs recorded in the SOZ.
(A) MRI scans showing location of 3 macroelectrode contacts implanted in the hippocampus of a patient with hippocampal sclerosis and drug-resistant temporal lobe epilepsy (arrow points to electrode trajectory artifacts and a blue circle marks the SOZ). (B) Raw intracranial EEG traces are centered around 3 IED detections (arrows) recorded on 8 color-coded electrodes as in A (SOZ marked in the circle). (C) Upper panel is an amplified view of the third IED from the uppermost channel in B aligned with its gamma-filtered (30–120 Hz) signal and its power spectrogram below (central lines indicate the common IED onset at time 0). The spectral power changes are plotted across 30- to 200-Hz frequency range in the time course of the IED recording above to highlight increased gamma power preceding the IED waveform. (D) Recordings show the onset of ictal discharge (red line), on the 2 uppermost electrodes (circled), which was the location of gamma-IEDs. IED = interictal epileptiform discharge; SOZ = seizure onset zone.
METHODS
Standard protocol approvals, registrations, and patient consents were obtained as part of Mayo Clinic Institutional Review Board (IRB 2248-03) approved study protocol. Consent forms were obtained from all studied patients with permission to publish research results.
Patients and electrophysiological recordings.
Seventeen adult patients (aged 20–58 years) with drug-resistant temporal lobe epilepsy were implanted with depth and subdural grid intracranial electrodes for prolonged iEEG monitoring as part of their evaluation for surgery (table 1). The electrodes comprised standard clinical macro- and research microelectrodes (AdTech, Inc. and PMT Inc., macrocontacts spaced 5–10 mm from each other with microcontacts clustered 1–2.5 mm between adjacent macrocontacts; see figure 2) for local field potential recordings acquired using a Digital Lynx SX recording system (Neuralynx, Inc., Bozeman, MT). The data were filtered (sampled at 32 kHz and bandpass filtered in 1–1,000 Hz), processed, and analyzed offline.
Table 1.
Clinical details of the study patients
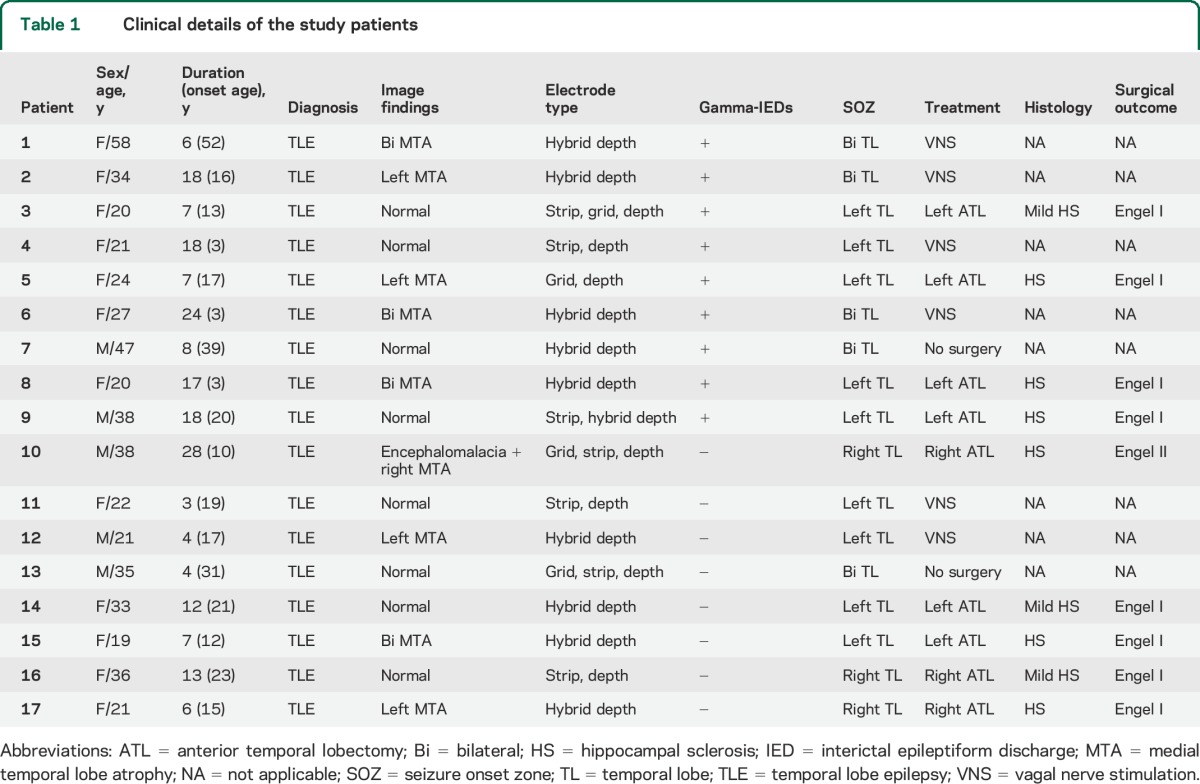
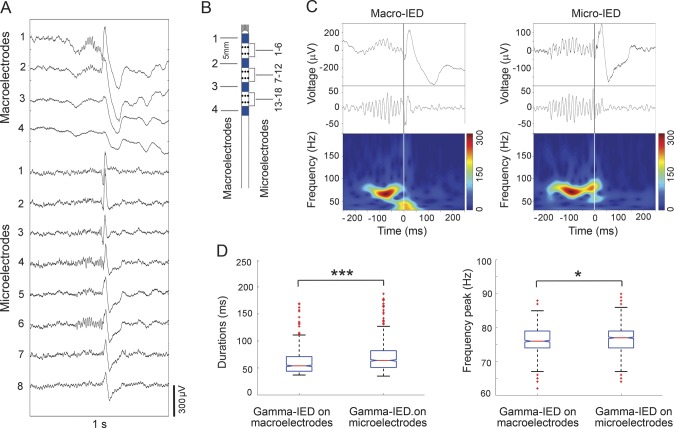
Figure 2. Focally generated gamma oscillations precede IEDs on microelectrodes and clinical macroelectrodes.
(A) Detection of a single IED event on 4 macro- and 8 microcontact hybrid depth electrode recordings, as illustrated on the schematic in B. Note the gamma oscillations preceding IEDs only on selected microcontacts and the adjacent macrocontact, despite wider propagation of the IED spike waveform. (B) Schematic of the hybrid depth electrode containing macro- and microelectrodes. (C) Spectrograms of the first channel macro (left) and the sixth channel micro (right) trace from A are plotted across 30- to 200-Hz frequency range and reveal earlier onset of gamma oscillations in the microelectrode recording (plots are aligned to the common IED onset at time 0 seconds). (D) Bar plot summarizes data from the 9 patients with gamma-IED detections. Analysis of the gamma-IEDs shows that the gamma oscillation component is longer duration (left) with slightly higher peak frequencies (right) on the microelectrodes (***p < 0.001 and *p < 0.05; n = 848 macro-IEDs and 1,154 micro-IEDs). IED = interictal epileptiform discharge.
Data analysis.
All data processing was performed using custom MATLAB codes (MathWorks Inc., Natick, MA). For each patient, all recorded seizures were visually reviewed. Seizure onset time and location were determined by independent visual identification of a clear electrographic seizure discharge in the clinical macroelectrodes, and then reviewing backward in the record to define the earliest definite iEEG change associated with the seizure. The time of the earliest electrographic change and the associated macroelectrode(s) involved were selected as the electrographic seizure onset time and SOZ, respectively.
A previously described semiautomated detection approach was used to identify and then manually verify IEDs and HFOs.7 Raw iEEG signal around each IED detection (±1 second from IED onset) was selected for analysis. The signal was filtered in the gamma band (30–100 Hz; Butterworth filters, third degree). Spectral power around IED detections was determined using continuous wavelet transform, and a threshold for significant gamma oscillations was set at 3 SDs above the mean baseline power (±500 milliseconds [ms] from IED onset). The duration of the IED was identified to avoid confusing ringing artifact associated with the IED voltage deflection as a physiological oscillation, i.e., Gibbs phenomenon.7 Gamma-IEDs were classified based on at least 3 cycles of significantly increased (>3 SDs) continuous gamma power before the rapid deflection characterizing the IED. The duration of significant gamma oscillations was obtained for each IED detection from the time of power threshold crossing to the IED onset. The gamma-IED frequency peak was defined at the maximum power in the gamma spectrum (30–100 Hz). One-hour segments of continuous interictal recording (taken from video-verified period of quiet wakefulness, and separated by at least 1 hour from seizures) were selected for every patient for the detections, after comparing the gamma-IED counts across 15-, 30-, 60-, and 120-minute time windows. Pathologic HFOs in the gamma frequency range (30–100 Hz) and higher (100–600 Hz) were automatically detected7 over extended 2-hour recordings to quantify the occurrence of specific events in the SOZ and non-SOZ. Nonparametric Wilcoxon rank tests were used to compare the gamma oscillation durations, frequencies, and counts of IEDs, HFOs, and gamma-IEDs (figure 3).
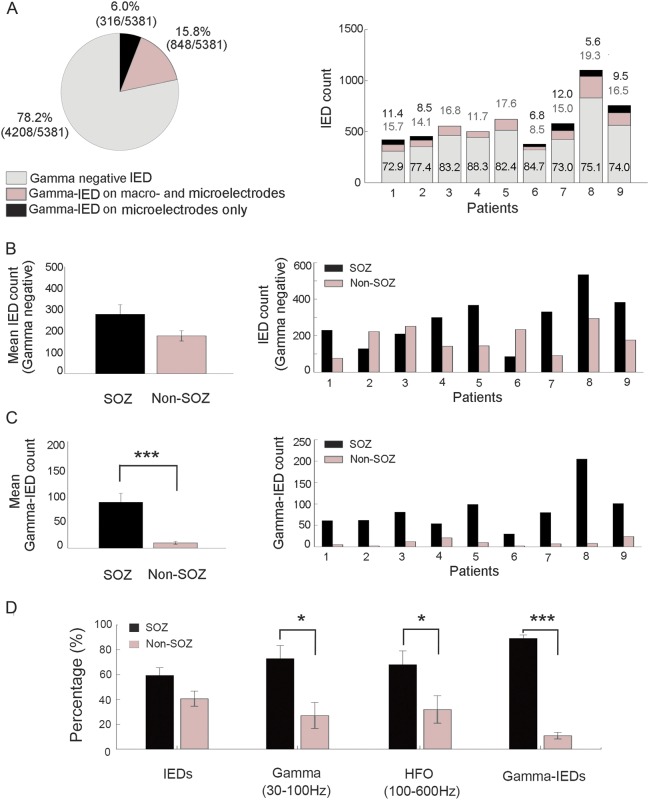
Figure 3. Gamma-IEDs from 9 patients are selectively localized to the SOZ compared with outside the SOZ (non-SOZ).
(A) Chart summarizing the proportion of gamma-IEDs relative to all other IEDs in the 9 patients with gamma-IEDs in the study. These general proportions are broken down into individual patients (right panel) with gamma-IEDs detected and show consistent distributions of macro- and microelectrode recorded events (values over the bars with macro- and microelectrodes [gray] and microelectrode only [black]). Notice that 6.0% of the gamma-IEDs were recorded only on microelectrodes. (B) Bar plot summary shows the localization of the mean IED counts without preceding gamma oscillations relative to the SOZ with no significant difference (p > 0.05, n = 2,570 IEDs inside, and 1,638 outside SOZ). Breakdown into individual patients (right panel) is provided. (C) Analogous summary as in B is plotted for gamma-IEDs showing significantly more gamma-IED detections in the SOZ (***p < 0.001, n = 773 IEDs inside, and 91 outside SOZ). Notice that gamma-IEDs are associated with the SOZ in 100% of patients (9/9) with gamma-IEDs, in contrast to the general IED population. (D) Association of interictal epileptiform spikes (IEDs), pathologic gamma oscillations (30–100 Hz), pathologic HFOs (100–600 Hz), and gamma-IEDs with SOZ (black) and non-SOZ (gray) is examined by aggregating the event counts for each region (*p < 0.05, ***p < 0.001). In summary, gamma (30–100 Hz) and ripple–fast ripple (100–600 Hz) HFOs were increased in SOZ, but gamma-IED complexes showed a stronger association with SOZ. HFO = high-frequency oscillation; IED = interictal epileptiform discharge; SOZ = seizure onset zone.
RESULTS
In total, 1,154 of 5,381 IEDs (21.8%) detected in the study were found to have distinct gamma oscillations, preceding the local field potential spike characterizing IEDs (figure 1). These gamma-IED complexes were identified in 9 of 17 patients (53%) studied (table 1). In the 9 patients with gamma-IEDs, 3 had bilateral hippocampal sclerosis, 2 had unilateral hippocampal sclerosis, and 4 had a normal MRI. The gamma-IEDs constituted between 8.5%–19.3% and 15.3%–27.1% of all macro- and micro-IED detections, respectively.
Gamma-IEDs were most often spatially confined to individual macroelectrodes and the adjacent cluster of microelectrodes (figure 2). The increased gamma power occurred earlier on microelectrodes than on the clinical macroelectrodes, which was reflected in longer durations (68.4 ± 25 ms and 59.2 ± 19 ms, p < 0.001) and slightly higher peak gamma oscillation frequencies (76.6 ± 4.3 Hz and 76.2 ± 4.1 Hz, p = 0.045).
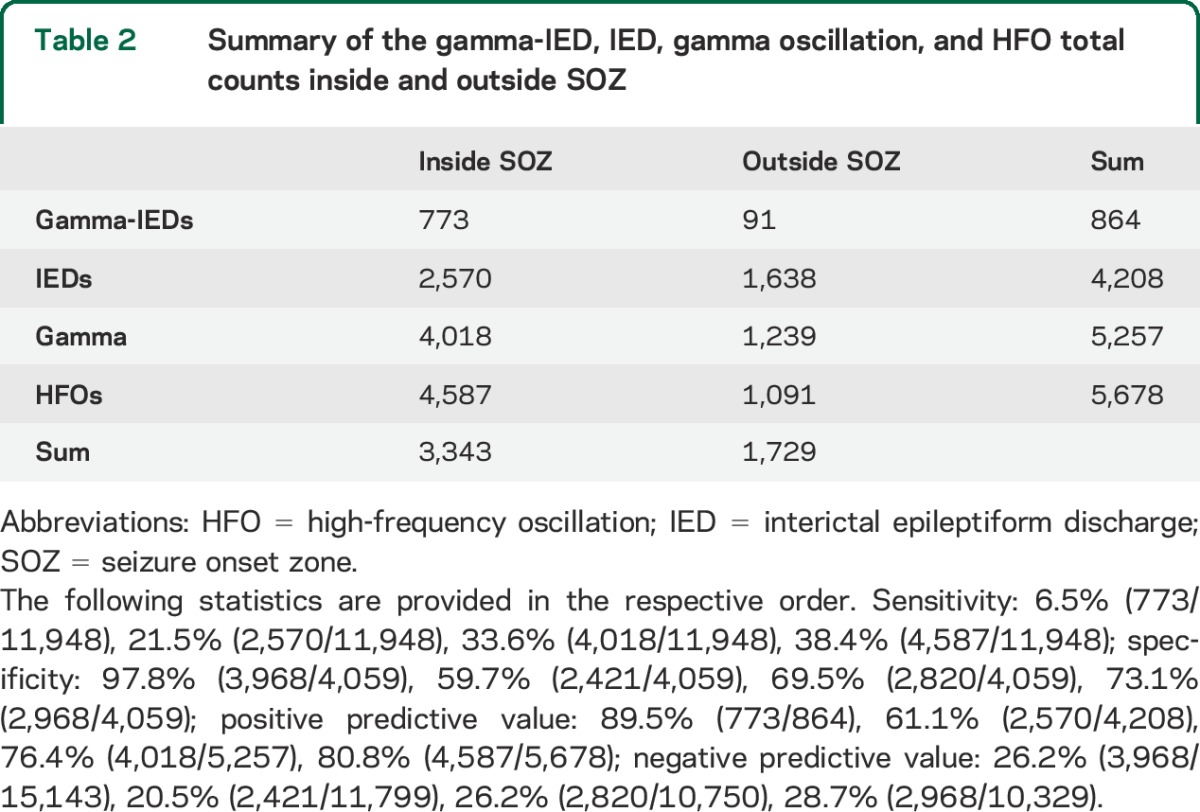
Of note, in 316 (6.0%) IED detections, gamma oscillations were only associated with IEDs recorded on the microelectrodes, in contrast to the remaining 848 (15.8%) with gamma-IEDs detected also on the clinical macroelectrodes (figure 3). This pattern was consistent across all patients and suggests highly local generation of the gamma-IEDs generated by integrated activity of neuronal populations, recorded at the scale of macro- and microelectrode. Finally, the gamma-IED events were predominantly detected on the channels inside the SOZ (91.2% of all detections). There were significantly more gamma-IEDs in the SOZ than non-SOZ (p = 0.004, signed rank test), contrasting with no difference in the localization of IEDs without preceding gamma frequency oscillations (p > 0.05). Similarly, pathologic HFOs in the gamma (30–100 Hz) and higher (100–600 Hz) frequency range were also increased in the SOZ compared with non-SOZ electrodes (figure 3D). In summary, gamma-IEDs had the lowest sensitivity and the highest specificity for SOZ (table 2). All 4 patients with gamma-IEDs who underwent surgical resection of the SOZ had Engel I, seizure-free outcome, compared with 4 of 5 patients (80%) without gamma-IEDs who were seizure-free, which is not a significant difference.
Table 2.
Summary of the gamma-IED, IED, gamma oscillation, and HFO total counts inside and outside SOZ
DISCUSSION
Our results show that gamma oscillations preceding IEDs are not a highly sensitive electrophysiological signature of focal epilepsy, since they were identified in only 9 of 17 patients (53%), but they are strongly associated with macro- and microelectrodes in the SOZ. In addition, when considering patients with gamma-IEDs, we found that IEDs were not associated with SOZ (p > 0.05), whereas isolated pathologic gamma (30–100 Hz) and higher frequency HFOs (100–600 Hz) were associated with SOZ electrodes. This suggests that gamma-IEDs have potential application as a useful adjunct to localize the epileptogenic neural networks. However, given the small number of patients studied here, more research is required to establish the clinical utility of mapping gamma-IEDs.
Gamma oscillations that preceded IEDs were often locally detected on microelectrodes before appearing on the adjacent macroelectrodes (see figure 2), or in case of 6.5% of all IED detections, they were observed only on the microelectrode recordings. These observations suggest the local generation of gamma-IEDs, reminiscent of “microdischarges” that can propagate into widespread epileptiform discharges visible on clinical macroelectrodes.8 The gamma-IEDs could thus mark the IED source, and illuminate the mechanisms underlying IED generation—a hypothesis that will need to be further investigated.
In this study, gamma-IEDs were observed in 9 of 17 patients (53%)—comprising 11.7% to 27.1% of all the detected IEDs, consistent with the prevalence of gamma-IEDs reported previously.4 One possible explanation for the relatively low prevalence of gamma-IEDs is their focal localization compared with IEDs (see above), which given the sparse spatial sampling with current electrophysiological recording methods, would entail a risk of missing the focus altogether in some patients with limited number of implanted electrodes. Alternatively, the 1-hour stretch of recording might not be long enough to detect gamma-IEDs in all patients. Another possibility is that gamma-IEDs could be altogether absent in certain cases or types of epilepsy, which nonetheless would not affect their relevance for patients where those IEDs were detected.
Even though gamma-IEDs were found to occur more frequently in the SOZ, the relationship between IEDs and seizure remains to be explored. Network oscillations, like the spike-preceding gamma, may help elucidate the neuronal processes underlying epileptiform activities, as demonstrated in a recent study using a rat model of epilepsy.5 The relationship between network activity and IEDs has recently been applied to study the effect of cognitively induced oscillations on IED suppression,9 opening a possibility for treating interictal pathophysiology. Further research will show whether the gamma-IEDs, physiological HFOs associated with normal function,10 and seizures share common network processes and thus drive new treatments and therapeutic strategies.
Ultimately, the clinical significance of interictal biomarkers will be determined by their association with seizure-free outcomes. In this study, we did not find a significant difference comparing IED and gamma-IED localization and surgery outcomes. This is most likely because of the small number of patients, and further research is required to determine whether gamma-IEDs can help delineate the spatial extent of epileptogenic brain and be used to guide surgical resection. Compared with pathologic HFOs above 100 Hz, the gamma-IED is likely to be more easily recorded with scalp EEG11 and may open noninvasive clinical applications.
ACKNOWLEDGMENT
The authors thank Cindy Nelson and Karla Crockett for technical and administrative assistance.
GLOSSARY
- HFO
high-frequency oscillation
- IED
interictal epileptiform discharge
- iEEG
intracranial EEG
- SOZ
seizure onset zone
AUTHOR CONTRIBUTIONS
Liankun Ren: drafting/revising the manuscript, study concept or design, analysis or interpretation of data, accepts responsibility for conduct of research and will give final approval. Michal Tomasz Kucewicz: drafting/revising the manuscript, study concept or design, analysis or interpretation of data, accepts responsibility for conduct of research and will give final approval, statistical analysis, study supervision. Jan Cimbalnik: analysis or interpretation of data, accepts responsibility for conduct of research and will give final approval, statistical analysis. Joseph Y. Matsumoto: drafting/revising the manuscript, study concept or design, analysis or interpretation of data, accepts responsibility for conduct of research and will give final approval, study supervision. Benjamin H. Brinkmann: drafting/revising the manuscript, study concept or design, analysis or interpretation of data, accepts responsibility for conduct of research and will give final approval, study supervision. Wei Hu: analysis or interpretation of data, accepts responsibility for conduct of research and will give final approval, acquisition of data. W. Richard Marsh: drafting/revising the manuscript, accepts responsibility for conduct of research and will give final approval, acquisition of data. Fredric B. Meyer: study concept or design, accepts responsibility for conduct of research and will give final approval, acquisition of data. S. Matthew Stead: analysis or interpretation of data, accepts responsibility for conduct of research and will give final approval, acquisition of data. Gregory A. Worrell: drafting/revising the manuscript, study concept or design, analysis or interpretation of data, accepts responsibility for conduct of research and will give final approval.
STUDY FUNDING
NIH R01-NS63039 and U24-63930; National Natural Science Foundation of China 81271447 and 81271448; European Regional Development Fund, Project FNUSA-ICRC CZ.1.05/1.1.00/02.0123.
DISCLOSURE
The authors report no disclosures relevant to the manuscript. Go to Neurology.org for full disclosures.
REFERENCES
- 1.Talairach J, Bancaud J. Lesion, “irritative” zone and epileptogenic focus. Confin Neurol 1966;27:91–94. [DOI] [PubMed] [Google Scholar]
- 2.de Curtis M, Avanzini G. Interictal spikes in focal epileptogenesis. Prog Neurobiol 2001;63:541–567. [DOI] [PubMed] [Google Scholar]
- 3.Keller CJ, Truccolo W, Gale GT, et al. Heterogeneous neuronal firing patterns during interictal epileptiform discharges in the human cortex. Brain 2010;133:1668–1681. [DOI] [PMC free article] [PubMed] [Google Scholar]
- 4.Alvarado-Rojas C, Lehongre K, Bagdasaryan J, et al. Single-unit activities during epileptic discharges in the human hippocampal formation. Front Comput Neurosci 2013;7:140. [DOI] [PMC free article] [PubMed] [Google Scholar]
- 5.Quilichini PP, Le Van Quyen M, Ivanov A, et al. Hub GABA neurons mediate gamma frequency oscillations at ictal-like event onset in the immature hippocampus. Neuron 2012;74:57–64. [DOI] [PMC free article] [PubMed] [Google Scholar]
- 6.Jacobs J, Staba R, Asano E, et al. High frequency oscillations (HFOs) in clinical epilepsy. Prog Neurobiol 2012;98:302–315. [DOI] [PMC free article] [PubMed] [Google Scholar]
- 7.Worrell GA, Jerbi K, Kobayashi K, Lina JM, Zelmann R, Le Van Quyen M. Recording and analysis techniques for high-frequency oscillations. Prog Neurobiol 2012;98:265–278. [DOI] [PMC free article] [PubMed] [Google Scholar]
- 8.Stead SM, Bower MR, Brinkmann BH, et al. Microseizures and the spatiotemporal scales of human partial epilepsy. Brain 2010;133:2789–2797. [DOI] [PMC free article] [PubMed] [Google Scholar]
- 9.Matsumoto JY, Stead SM, Kucewicz MT, et al. Network oscillations modulate interictal epileptiform spike rate during human memory. Brain 2013;136:2444–2456. [DOI] [PMC free article] [PubMed] [Google Scholar]
- 10.Kucewicz MT, Cimbalnik J, Matsumoto JY, et al. High frequency oscillations are associated with cognitive processing in human recognition memory. Brain 2014;137:2231–2244. [DOI] [PMC free article] [PubMed] [Google Scholar]
- 11.Andrade-Valenca LP, Dubeau F, Mari F, Zelmann R, Gotman J. Interictal scalp fast oscillations as a marker of the seizure onset zone. Neurology 2011;77:524–531. [DOI] [PMC free article] [PubMed] [Google Scholar]


