Abstract
Introduction:
We evaluate the diagnostic performance of strain elastography to differentiate renal cell carcinoma (RCC) from angiomyolipoma (AML).
Methods:
Strain elastography was performed in 65 patients (mean age 55.5 years; range: 32–81) who had renal lesions (24 AMLs and 41 RCCs) prospectively. Lesions were classified according to lesion size and histological subtypes. The strain ratios of the RCCs and AMLs were evaluated by a radiologist. The area under the curve and the cut-off point were used to assess diagnostic performance. Sensitivity, specificity, and positive and negative predictive values were obtained.
Results:
In assessing the mean strain ratio, we divided the groups in 3 according to size: (1) <20-mm lesions; (2) 20- to 40-mm lesions; and (3) >40-mm lesions; the respective mean strain ratios were: 1.5 ± 0.5 (range: 0.06–5.92), 2.8 ± 0.4 (range: 0.17–9.92), 2.7 ± 0.3 (range: 0.08–6.15). When RCCs and AMLs were compared, there was a statistically significant difference in the strain ratio among the 3 groups divided per lesion size (p < 0.01). For the strain ratio, the mean ± standard deviation was 1.1 ± 0.1 for AMLs and 3.4 ± 0.3 for RCCs (p < 0.01). When lesion subtypes were compared, there was a statistically significant difference in the strain ratio between the AML and clear cell RCC (p < 0.01).
Conclusions:
For assessing renal lesions, strain elastography and strain ratio values may be useful in differentiating RCCs from AMLs.
Introduction
Ultrasound (US) elastography is a new radiological modality. In conventional B-mode imaging, tissue hardness in real time is represented in colour. Because most malignant tumours are harder than benign tissues, benign and malignant tissues were differentiated significantly by this technique. In the literature, a good correlation between strain elastography and histologic analysis was reported, with high sensitivity and specificity for differentiation between benign and malignant masses in breast tissue.1 We hypothesized that evaluation of tissue elasticity might be useful for renal mass characterization. Tan and colleagues found significant differences between strain ratios for angiomyolipomas (AMLs) and renal cell carcinomas (RCCs) (p < 0.01).2 The aim of our study, therefore, was to prospectively determine the diagnostic efficiency of sonoelastography for differentiating RCCs from AMLs.
Methods
Study population
There were 65 patients in our study population (28 men and 37 women) who underwent US, including elastography of a renal mass, at our institution between March 2012 and February 2013. The mean age of patients was 55.5 ± 12.3 (range: 32–81). The study population had various renal masses, including 41 RCCs and 24 AMLs. The RCCs were diagnosed by resection. The histopathological examination was performed by our pathologists. Histological subtype was clear cell carcinoma in 26 patients, papillary cell carcinoma in 7 patients, chromophobe cell carcinoma in 5 patients, and mix cell carcinoma in 3 patients. The 24 AMLs were diagnosed by presence of bulk fat on computed tomography (CT) and/or magnetic resonance imaging (MRI).3,4 This prospective observational study was approved by the Necmettin Erbakan University, Meram School of Medicine Hospital Institutional Review Board. All patients gave informed consent.
Equipment and scanning
One radiologist (SK) with 9 years of experience in conventional sonography and 2 years in elastography carried out the sonoelastography examinations. Patients experienced both B-mode and elastographic sonography in the supine and lateral decubitus position with a digital sonography scanner (Aplio XG, Toshiba Medical Systems, Tokyo, Japan) supplied with strain elastography software and a convex 2.5–5 MHz multifrequency transducer (Model PVT-375BT, Serial Number: FDA 11Y4472). All assessments were executed while patients’ held their breath after deep inspiration. After recognition of a target lesion on a B-mode US image, strain elastography was executed using the same probe. The probe was manually moved to compress and relax the underlying tissue. Both elastographic and B-mode images were demonstrated at the same time as a two-panel image during the performance of sonoelastography. Only solid portions of the lesions were evaluated when determining the elastographic pattern. The elastogram was exhibited over the B-mode image in a colour scale: red (greatest strain, softest component) and blue (no strain, hardest component) tissue. Green indicated average strain.5 Both renal lesions and normal surrounding tissue were comprised in the elastographic box.
Data analysis
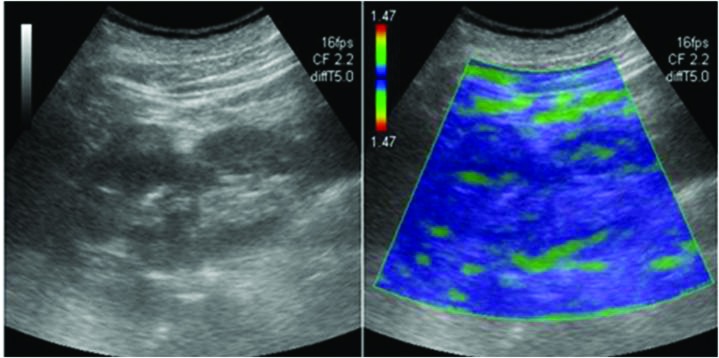
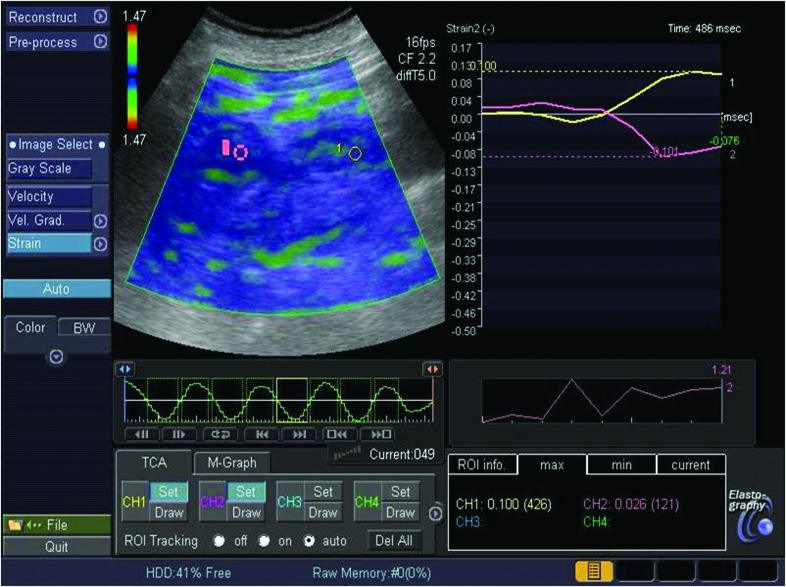
The presence of fluid areas was noted, but only the solid portions of the lesion were evaluated when determining the elastographic pattern.6 One radiologist who was blinded to the pathologic findings or final diagnoses reviewed the static images, except for those of the 23 patients who were previously diagnosed as AML with CT. The strain ratio was measured by comparing the tumour (B) to the renal cortex for all renal lesions. The first region of interest (ROI) was placed in the renal cortex. The second ROI was placed in the renal mass.7 The radiologist noted the elasticity values in the ROI placed over the stiffest areas on the elastography image for renal cortex and renal mass. The strain ratio (A/B), reflecting the stiffness of the lesion, was then automatically calculated on the US machine (Fig. 1, Fig. 2).
Fig. 1.

A 65-year-old man with clear cell carcinoma in B-mode and elastography image.
Fig. 2.
To estimate strain ratio on an elastography image, we placed the first region of interest (ROI) (A) in the renal cortex and the second ROI (B) was drawn in the neoplasm. The strain ratio was calculated automatically as an A/B.
Statistical analysis
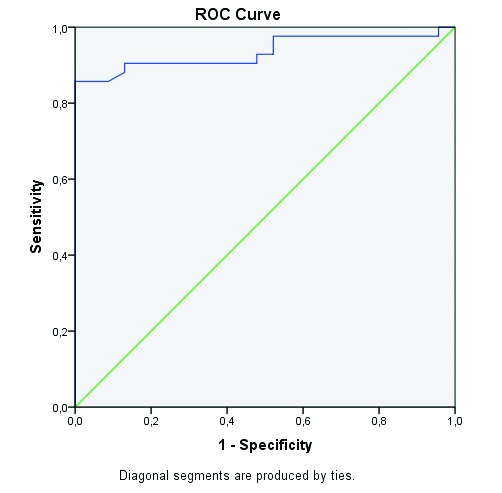
Statistical analysis was performed using SPSS version 20 software (SPSS Inc, Chicago, IL). The numerical variables were declared as either mean ± standard deviation or number (percentage), where appropriate. Subsequently, lesion size was divided into 3 categories: <20 mm, 20–40 mm, or >40 mm to assess the competence of this modality for various lesion sizes.8 We used the Mann–Whitney U test to analyze each lesion size category (for strain ratio and pathology) and strain ratio (for gender). Kruskal–Wallis tests were conducted to compare strain ratio and the ordinal variables among the lesion size categories and lesion subtypes. The Mann–Whitney U test was performed to test the significance of pairwise differences using Bonferroni correction to adjust for multiple comparisons. Two-tailed p values <0.05 were considered statistically significant. We used receiver operating characteristics (ROC) curve analysis to assess diagnostic value of strain ratios for differentiation between RCCs and AMLs. When a significant cut-off value was observed, the sensitivity, specificity, positive predictive value, and negative predictive value were presented (Table 1). While evaluating the area under the curve, a 5% type I error level was used to assess the statistically significant predictive value of the test variables.
Table 1.
Statistical data in differentiating RCCs from AMLs with regard to strain ratios
| Parameter | |
|---|---|
| Optimal cut-off | 1.67 |
| Sensitivity (%) | 91 |
| Specificity (%) | 87 |
| Positive predictive value (%) | 93 |
| Negative predictive value (%) | 83 |
RCC: renal cell carcinoma; AML: angiomyolipoma.
Results
The descriptive data for strain ratios and lesion diameter are shown Table 2. The mean size for AMLs was 29.6 ± 5.3 mm (range: 7–105, 95% confidence interval [CI] 18.51–40.62) and for RCCs was 54.8 ± 3.4 mm (range: 8–109, 95% CI 47.92–61.70). There was a significant difference in tumour size between the RCCs and AMLs (p < 0.01).
Table 2.
The descriptive data for strain ratios and lesion diameter
| Parameter | Mean | Median | Mode | SD | Minimum | Maximum |
|---|---|---|---|---|---|---|
| Strain ratio | 2.55 | 2.18 | 1.95 | 1.82 | 0.06 | 9.92 |
| Lesion diameter | 45.88 | 43 | 43 | 26.19 | 7 | 109 |
SD: standard deviation.
The mean strain ratio for AMLs was 1.1 ± 0.1 (range: 0.06–1.90, 95% CI 0.83–1.38) and for RCCs was 3.4 ± 0.3 (range: 0.08–9.92, 95% CI 2.80–3.90). When RCCs and AMLs were compared, there was a statistically significant difference in the strain ratio between the 2 groups (p < 0.01).
The mean strain ratio for <20-mm lesions was 1.5 ± 0.5 (range: 0.06–5.92, 95% CI 0.24–2.69), for 20–40-mm lesions 2.8 ± 0.4 (range: 0.17–9.92, 95% CI 1.88–3.73), and for >40-mm lesions 2.7 ± 0.3 (range: 0.08–6.15, 95% CI 2.16–3.28). When RCCs and AMLs were compared, there was a statistically significant difference in the strain ratio between the 3 groups (p < 0.01).
When lesion subtypes were compared, there was a statistically significant difference in the strain ratio between the AML and the clear cell RCC (p < 0.01). When lesion size categories were compared, there was a statistically significant difference in strain ratio between <20-mm lesions and 20–40-mm lesions (p = 0.022).
When female and male genders were compared, there was a statistically significant difference in the strain ratio between the groups (p = 0.024). Using ROC analysis, the best cut-off value was 1.67. The area under the ROC curve was 0.935 with a 95% CI of 0.874–0.997 (Fig. 3). The numbers of true positives, true negatives, false positives, and false negative were 38, 20, 4 and 3, respectively.
Fig. 3.

Characteristic curve of strain ratio measurements in differentiating renal cell carcinomas from angiomyolipomas. ROC: receiver operating characteristics.
Discussion
Strain elastography measures the degree of distortion of a tissue under compression and is based on the principle that the softer parts of tissues deform more easily than the harder parts. In recent years this technique has been successfully applied to breast lesions, prostate, pancreas, lymph nodes, thyroid gland, testes, and liver. Evaluation of deep tissues is more feasible, and this approach has been successfully applied in clinical studies to investigate intra-abdominal tissues.9–12
Pallwein and colleagues13 found that strain elastography can help to detect prostate cancer and estimate tumour location and size. Salomon and colleagues14 reported that elastography could detect prostate cancer foci within the prostate with good accuracy and had the potential to increase ultrasound-based prostate cancer detection. Zhang and colleagues15 showed that there was significant difference of strain ratio values between the benign and malignant prostate lesions. Dudea and colleagues16 found that sonoelastography definitely improved the detection of prostate cancer. Onur and colleagues17 showed that strain elastography might help differentiate benign and malignant liver masses. Tan and colleagues2 used strain elastography to evaluate renal tumours. Their results showed that strain elastography might be useful to differentiate AMLs from RCCs, by use of both elasticity patterns and strain ratios.
On the contrary, in our study, we did not use elasticity patterns. We searched whether strain elastography was useful to differentiate benign from malignant renal lesions. We had a larger study population than in Tan’s study (65 vs. 47).2 In our study, strain ratio values suggested a benefit method for differentiating renal benign and malignant lesions, with high sensitivity and specificity. Additionally, we found high numbers of true positives and negatives. We recommend this technique for patients with kidney lesions newly diagnosed on US as an incidental finding that can potentially be used to avoid requiring a follow-up CT or MRI. In addition, sonoelastography may be used in place of CT or MRI to arrive at a diagnosis in patients with iodine-based contrast allergy, renal insufficiency, or urinary tract obstruction, which may be contraindications for contrast-enhanced studies. Grenier and colleagues anticipate that renal elastography is a new radiological method for characterization of renal masses and more experience is essential to differentiate benign from malignant renal lesions.18
Our study has several limitations. First, there were significant differences in size between the benign and malignant renal lesions; the performance of sonoelastography may not have been as high in 2 size-matched groups. Second, our study population was not a large group and not enough of the patients had histological subgroups; the diagnostic performance of elastography may have varied with different histological subgroups of malignant and benign tumours. In addition, elastography itself has certain limitations. Elastography for pure cystic lesions does not give useful information, and the compression of the solid portion may be affected by the lack of strain of the fluid portion. Elastography in terms of the application of pressure to the probe has a relatively greater operator dependency, and strain values may change with different degrees of manual compression, as well as with the composition and structure of tissues.19,20 Furthermore, various factors, such as lesion size, depth, and density can affect the performance of elastography, and it can be difficult to achieve optimal image quality for every case.
Conclusion
Our prospective study showed that strain elastography may be useful to differentiate RCCs and AMLs. Being a noninvasive and low-cost imaging modality, US elastography may improve accuracy in the differential diagnosis of renal tumours.
Acknowledgments
This work was supported by Department of Urology in Necmettin Erbakan University Meram School of Medicine.
Footnotes
Competing interests: Authors declare no competing financial or personal interests.
This paper has been peer-reviewed.
References
- 1.Itoh A, Ueno E, Tohno E, et al. Breast disease: Clinical application of US elastography for diagnosis. Radiology. 2006;239:341–50. doi: 10.1148/radiol.2391041676. [DOI] [PubMed] [Google Scholar]
- 2.Tan S, Özcan MF, Tezcan F, et al. Real-time elastography for distinguishing angiomyolipoma from renal cell carcinoma: Preliminary observations. AJR. 2013;200:369–75. doi: 10.2214/AJR.12.9139. [DOI] [PubMed] [Google Scholar]
- 3.Scialpi M, Di Maggio A, Midiri M, et al. Small renal masses: Assessment of lesion characterization and vascularity on dynamic contrast-enhanced MR imaging with fat suppression. AJR. 2000;175:751–7. doi: 10.2214/ajr.175.3.1750751. [DOI] [PubMed] [Google Scholar]
- 4.Min JH, Kim CK, Park BK, et al. Assessment of renal lesions with blood oxygenation level-dependent MRI at 3 T: Preliminary experience. AJR. 2011;197:489–94. doi: 10.2214/AJR.10.6319. [DOI] [PubMed] [Google Scholar]
- 5.Cho N, Jang M, Lyou CY, et al. Distinguishing benign from malignant masses at breast US: combined US elastography and color Doppler US-influence on radiologist accuracy. Radiology. 2012;262:80–90. doi: 10.1148/radiol.11110886. [DOI] [PubMed] [Google Scholar]
- 6.Dumitriu D, Dudea S, Botar-Jid C, et al. Real-time sonoelastography of major salivary gland tumors. AJR. 2011;197:924–30. doi: 10.2214/AJR.11.6529. [DOI] [PubMed] [Google Scholar]
- 7.Jung HJ, Hahn SY, Choi HY, et al. Breast sonographic elastography using an advanced breast tissue-specific imaging preset: Initial clinical results. J Ultrasound Med. 2012;31:273–80. doi: 10.7863/jum.2012.31.2.273. [DOI] [PubMed] [Google Scholar]
- 8.Kutikov A, Fossett LK, Ramchandani P, et al. Incidence of benign pathologic findings at partial nephrectomy for solitary renal mass presumed to be renal cell carcinoma on preoperative imaging. Urology. 2006;68:737–40. doi: 10.1016/j.urology.2006.04.011. [DOI] [PubMed] [Google Scholar]
- 9.D’Onofrio M, Gallotti A, Mucelli RP. Tissue quantification with acoustic radiation force impulse imaging: Measurement repeatability and normal values in the healthy liver. AJR. 2010;195:132–6. doi: 10.2214/AJR.09.3923. [DOI] [PubMed] [Google Scholar]
- 10.Nightingale K, Soo MS, Nightingale R, et al. Acoustic radiation force impulse imaging: In vivo demonstration of clinical feasibility. Ultrasound Med Biol. 2002;28:227–35. doi: 10.1016/S0301-5629(01)00499-9. [DOI] [PubMed] [Google Scholar]
- 11.Fahey BJ, Nelson RC, Bradway DP, et al. In vivo visualization of abdominal malignancies with acoustic radiation force elastography. Phys Med Biol. 2008;53:279–93. doi: 10.1088/0031-9155/53/1/020. [DOI] [PMC free article] [PubMed] [Google Scholar]
- 12.Rosenkrantz AB, Hindman N, Fitzgerald EF, et al. MRI features of renal oncocytoma and chromophobe renal cell carcinoma. AJR. 2010;195:421–7. doi: 10.2214/AJR.10.4718. [DOI] [PubMed] [Google Scholar]
- 13.Pallwein L, Mitterberger M, Struve P, et al. Real-time elastography for detecting prostate cancer: Preliminary experience. BJU Int. 2007;100:42–6. doi: 10.1111/j.1464-410X.2007.06851.x. [DOI] [PubMed] [Google Scholar]
- 14.Salomon G, Köllerman J, Thederan I, et al. Evaluation of prostate cancer detection with ultrasound real-time elastography: A comparison with step section pathological analysis after radical prostatectomy. Eur Urol. 2008;54:1354–62. doi: 10.1016/j.eururo.2008.02.035. [DOI] [PubMed] [Google Scholar]
- 15.Zhang Y, Tang J, Li YM, et al. Differentiation of prostate cancer from benign lesions using strain index of transrectal real-time tissue elastography. Eur J Radiol. 2012;81:857–62. doi: 10.1016/j.ejrad.2011.02.037. [DOI] [PubMed] [Google Scholar]
- 16.Dudea SM, Giurgiu CR, Dumitriu D, et al. Value of ultrasound elastography in the diagnosis and management of prostate carcinoma. Med Ultrason. 2011;13:45–53. [PubMed] [Google Scholar]
- 17.Onur MR, Poyraz AK, Ucak EE, et al. Semiquantitative strain elastography of liver masses. J Ultrasound Med. 2012;31:1061–7. doi: 10.7863/jum.2012.31.7.1061. [DOI] [PubMed] [Google Scholar]
- 18.Grenier N, Gernisson JL, Cornelis F, et al. Renal ultrasound elastography. Diagn Interv Imaging. 2013;94:545–50. doi: 10.1016/j.diii.2013.02.003. [DOI] [PubMed] [Google Scholar]
- 19.Dumitriu D, Dudea S, Botar-Jid C, et al. Real-time sonoelastography of major salivary gland tumors. AJR. 2011;197:924–30. doi: 10.2214/AJR.11.6529. [DOI] [PubMed] [Google Scholar]
- 20.Moon HJ, Sung JM, Kim EK, et al. Diagnostic performance of grayscale US and elastography in solid thyroid nodules. Radiology. 2012;262:1002–13. doi: 10.1148/radiol.11110839. [DOI] [PubMed] [Google Scholar]


