Abstract
Purpose
Since trauma is the leading cause of death and disability among children, understanding injury patterns may reduce morbidity and mortality through targeted prevention efforts. The purpose of this study was to identify pediatric injury patterns by year of age using a large national database.
Methods
We searched the National Trauma Database (NTDB) Research Data Set 7.0 for patients aged 0–18 years with the following relevant ICD-9 external-cause-of-injury codes (e-codes). We also reviewed our institutional trauma registry data (1999–2009). Data were analyzed using χ2 analysis and ANOVA with significance defined as p < 0.05.
Results
We identified 354,196 pediatric trauma patients. The leading MOI were motor-vehicle collisions (MVC) for ages 10–18 years and falls for ages 0–9 years. Fire was the second leading MOI among 1-year-olds, but not a major MOI in other age groups. Penetrating trauma was the MOI for 21% of injuries among adolescents with public or no insurance (versus 7.5% adolescents with private insurance). Injury severity scores were highest for children < 1 year old and children 14–18 years old. Our review of 1209 patients from our institution yielded additional detail.
Conclusion
MVC and falls remain leading pediatric MOI. In our year-of-age analysis, we found several interesting trends, including a higher-than-expected rate of penetrating trauma. Our findings may support targeted injury prevention efforts.
Keywords: Trauma, Pediatric, Age distribution, Mechanism of injury, Insurance, E-code
The impact of trauma on the health of infants and children cannot be understated. Injury is the leading cause of death and acquired disability to children in the United States and worldwide. After the first year of life, trauma is the major cause of death in children with more deaths related to trauma than the next four causes of death combined [1,2]. The direct medical costs associated with trauma have been estimated at greater than 100 billion dollars annually (10% of medical expenditures), not including the societal costs related to disability and long-term rehab [1–6].
The importance of better understanding pediatric injury patterns and the management of pediatric trauma patients has been widely recognized, leading to a “call to action” by the APSA committee on trauma in 2010 [1]. Classic studies of pediatric injury patterns have analyzed aggregate data for a broad age ranges of children, prompting the development of standard age groupings for pediatric injury research based on developmental changes and life. The standard age groupings most widely adopted are those developed by the National Institute of Health and Human Development Conference: > 1, 1–4, 5–9, 10–14, and 15–18 years. Although widely used in most recent studies of patterns of pediatric trauma, these standard age groupings may mask injury trends which the boundaries of the age group or affect only a narrow age range within the group [7]. Understanding patterns of pediatric injury is crucial for developing and targeting effective prevention programs.
The purpose of our study was to understand current trends in pediatric trauma using a large national database. Although there have been recent national assessments of pediatric trauma using hospital discharge information or the National Trauma Database, these studies have relied on traditional age groupings. Analysis of trauma patterns by year of age has been limited to state or institutional data. Since there has been no recent analysis of causes of pediatric injury by year of age using a large national database, we performed a retrospective review of the National Trauma Database (Research Data Set 7.0) as well as our institutional data to better understand patterns of pediatric injury.
1. Methods
Following institutional IRB approval, we searched the National Trauma Database Research Data Set 7.0 (2002–2006) for patients aged 0–18 years seen at more than 900 US trauma centers with the following ICD-9 external-cause-of-injury codes (e-codes): E800-869, E880-929, and E950-999. We also reviewed our institutional trauma registry data for Duke Medical Center (2006–2009) for children aged 0–18 years using the principle e-codes listed above. E-codes were classified into mechanisms of injury using the CDC recommended framework of E-code groupings for presenting injury. We combined the categories “cut/pierce” and “firearms” into the category of “penetrating injury.” We performed a further analysis comparing mechanisms of injury by year of age among children with private insurance versus children with public or no insurance. Children whose insurance status was unknown were excluded from this subgroup analysis.
Our statistical analysis included χ2 analysis to compare differing rates of the various mechanisms of injury, with statistical significance defined as p < 0.05. ANOVA was used to define significant differences in mean ISS among the various groups. Statistical calculations were performed using Stata Version 10 (Stata Corp., College Station, TX), with statistical significance defined as p < 0.05.
2. Results
We identified a total of 354,196 patients aged 0–18 years who met inclusion criteria. As in prior studies, we found that leading mechanisms of injury for all age groups were motor vehicle collisions and falls. In our year-of-age analysis, falls were the leading mechanism of injury for children ages 0–9 (n = 89,368, 25.2%; Table 1). MVC was the leading mechanism of injury for children aged 10–18 years (n = 127,356, 35.9%). The second most common mechanism of injury was MVC for children aged 0–9 with the exception of 1-year-olds. In this age group (age 1), fire was a more frequent mechanism of injury than MVC (n = 3291 vs n = 2022). This trend within the 1-year-old group might have been missed by analyzing injury patterns using traditional age groupings (for example, combining ages 1–4 years) instead of analyzing by year of age. Fire was the fourth most frequent mechanism of injury for children ages 0, 2, and 3 years, but a much less significant mechanism of injury for older children. Pedestrian accidents were the third most frequent mechanism of injury for children aged 3–6 years, while bicycle accidents were third for those ages 7–10 years (Fig. 1).
Fig. 1.
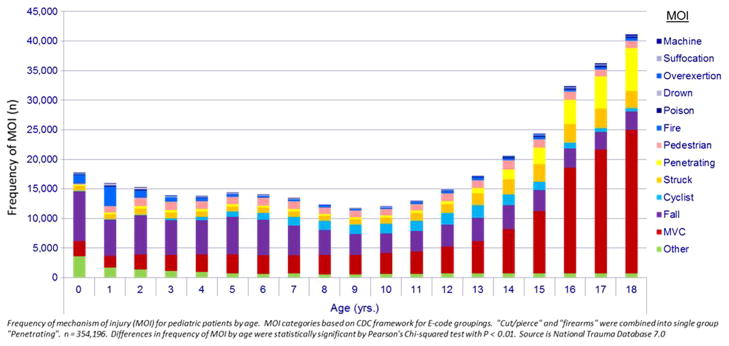
Frequency of injury by mechanism and year of age, 2002–2006.
Although blunt injury accounts for the majority of injuries in children, we found that penetrating injury was the mechanism of injury for 7.5% of children aged 0–18 years and 12.7% of children aged 13–18 years. While the frequency of penetrating trauma is low for younger age groups, it rises sharply after age 13 years, becoming one of the top most frequent five mechanisms of injury for children. In fact, penetrating trauma, not falls, was the second most frequent mechanism of injury for adolescents aged 16–18 years (Figs. 2 and 3).
Fig. 2.
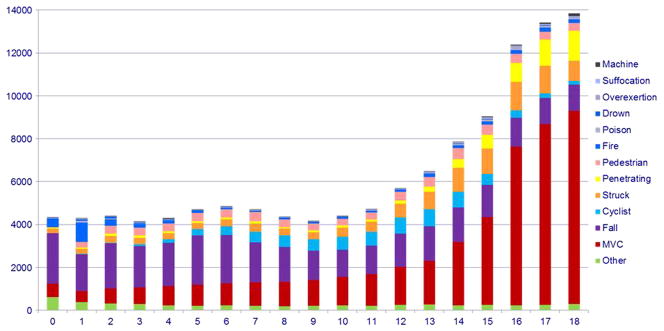
Frequency of injury by mechanism and year of age in children aged 0–18 years with private insurance, 2002–2006.
Fig. 3.
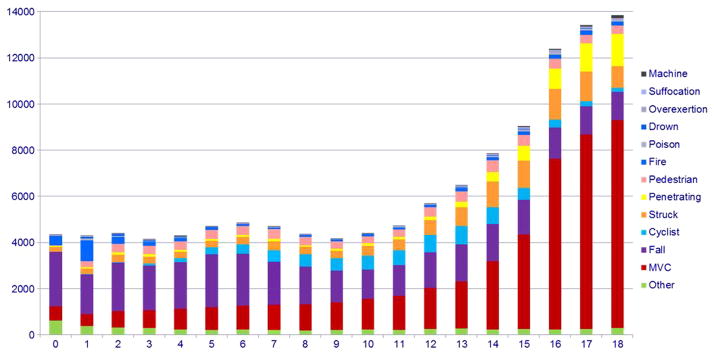
Frequency of injury by mechanism and year of age in children aged 0–18 years with public or no insurance, 2002–2006.
To understand this trend, we compared injury patterns among children with private insurance to those of children with either public (Medicaid or state-sponsored program) or no insurance. Children whose insurance status was unknown were not included in this analysis. We found that the frequency of penetrating injury was significantly higher for the children with public or no insurance. Penetrating trauma was the mechanism for 21.6% of injuries (n = 9535) in children aged 13–18 years in this group versus 7.5% of injuries for those with private insurance (n = 4787, p < 0.001, Fig. 4). In fact, penetrating trauma was the second most frequent mechanism of injury for 15–18-year-olds with public or no insurance.
Fig. 4.
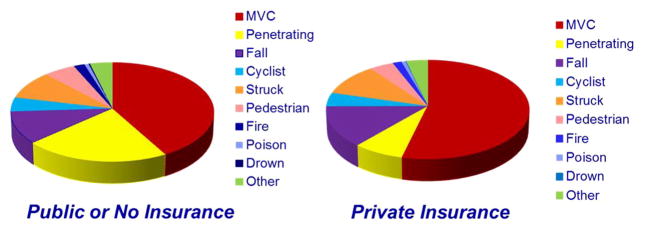
Mechanisms of injury in children aged 13–18 years by insurance status.
Although we found that while MVC was the leading mechanism of injury among adolescents, we observed interesting variation by year of age. The frequency of MVC as a mechanism of injury for adolescents who had reached driving age (17 years) was more than double that of younger teenagers (15 years) (n = 20,271 vs. n = 10,602). Not surprisingly, adolescents with private insurance status had a significantly higher frequency of injury from MVC than those with no or public insurance, perhaps due to the availability of personal vehicles. MVC accounted for nearly 60% of all injuries among children age 13–18 years with private insurance compared with 45% of injuries among those with public or no insurance (n = 28,914 versus n = 15,635, p < 0.001, Fig. 4).
Our review of 1209 pediatric trauma patients from our institution yielded similar trends in injury patterns as well as additional detail, allowing for a more robust analysis. For example, although falls were the most common mechanism of injury for children aged 0–9 years, the type of fall varied based on year of age. For children aged 0–2 years, falls from furniture, beds, and parents arms were most common, while for children aged 3–9 years, falls from playground equipment were most frequent (Fig. 5).
Fig. 5.
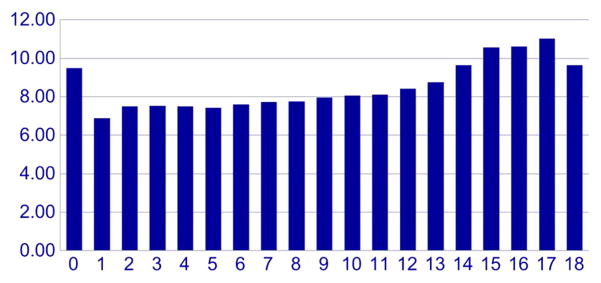
Injury severity scores by year of age.
Injury severity scores were highest for at the extremes of age. By year of age, children < 1 year and children aged 14–18 years had the highest ISS, with a peak around ages 16–17 years (ISS 10.02 ± 11, 11.62 ± 11, Fig. 6). Penetrating trauma was associated with higher ISS, with gunshot wounds having the highest ISS of any mechanism for children aged 0–18 years (ISS 11.69 ± 13). The four mechanisms of injury associated with highest ISS were MVC (11.24 ± 11), penetrating (9.03 ± 11), pedestrian (10.77 ± 11), and cyclist (8.61 ± 11).
Fig. 6.
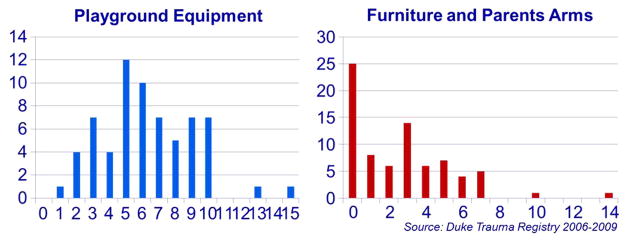
Analysis of frequency of falls by year of age.
3. Discussion
In our retrospective review of the National Trauma Database, we found that although falls and MVC remain the major mechanisms of pediatric injury, there is considerable variation in rates of injury by year of age. We were surprised by certain trends identified in our year-of-age analysis, such as the high rates of injury from fire/burns among 1 year-olds, which could be masked by analyzing only aggregate data on mechanisms of injury for the 1–4-year age group. Similarly, we saw a striking difference in the frequency of MVC as a mechanism of injury for 15 year-olds compared with 16–17-year-olds, although these ages are often combined into the 15–18-year age grouping. These findings support the assertion of Argan et al. [7] that conventional age groupings often fail to identify high risk mechanisms of injury which transected these age groups. Although there have been several recent national assessments of pediatric trauma, we do not know of another recent analysis of a large national trauma database by year of age.
Our finding that penetrating trauma is an important mechanism of injury in children, especially among adolescents aged 13–18 years, supports the conclusions of other recent studies. These studies have reported penetrating trauma as the mechanism of injury for 10% of admissions at pediatric trauma centers and 20% of traumatic deaths in children younger than 19 years [8]. We also found that penetrating trauma disproportionately affected adolescents with public or no insurance when we analyzed children and adolescents by insurance status. Penetrating trauma was the second leading mechanism of injury for 15–18-year-olds with public or no insurance. We suspect that insurance status functioned as a proxy for socioeconomic status in this analysis. However, we were limited in our ability to analyze the data by family income, household structure, or zip code by data available from the NTDB. Even if this data were available, we recognize the limitations of single demographic variables such as income, insurance status, race, household structure in capturing the complex interplay of socioeconomic status, culture, and community on penetrating injury patterns. This area merits further investigation.
Other limitations of our study include the retrospective design and the limitations of using generic data from E-codes to understand patterns of injury. Although we identified trends in pediatric injury by year of age, we lacked additional detail on the circumstances of the mechanism of injury. For example, in our analysis of our institutional data, we found that although falls were the major mechanism of injury for children aged 0–9 years, the circumstances of the fall were different depending on age. Children aged 0–2 years were most likely to fall from furniture, beds, or parents arms while older children were more likely to fall from playground equipment. This finding is certainly not surprising based on developmental changes of children at these ages. However, understanding these different injury patterns may better inform prevention efforts targeted at these age groups.
In summary, we found that the major mechanisms of injury in pediatric trauma remain falls (0–9-year-olds) and MVC (10–18-year-olds) with variations among other mechanisms of injury based on year of age. Penetrating injury is an important mechanism of injury among adolescents, especially those with public or no insurance. Mechanisms with more severe ISS scores included penetrating trauma and transportation-related mechanisms (MVC, cyclist, pedestrian). We noted that the most severe ISS scores were associated with injuries in infants and adolescents aged 16–17 years. Although we identified some important trends in pediatric injury patterns by year of age, there are many areas for further inquiry, including a more detailed understanding of the major mechanisms of trauma. It is also critical to understand the relationship between these mechanisms of pediatric injury and developmental changes, socioeconomic determinants, and community. Better understanding these patterns of pediatric injury is crucial to better direct prevention efforts, interventions, and anticipatory guidance.
References
- 1.Upperman JS, Burd R, Cox C, et al. Pediatric applied trauma network: a call to action. J Trauma. 2010;69(5):1304–7. doi: 10.1097/TA.0b013e3181fa4858. [DOI] [PubMed] [Google Scholar]
- 2.World Health Organization. World report on childhood injury prevention. 2008 http://www.who.int/violence_injury_prevention/child/injury/world_report/en/
- 3.Guice KS, Cassidy LD, Oldham KT. Traumatic injury and children: a national assessment. J Trauma. 2007;63(6):568–80. doi: 10.1097/TA.0b013e31815acbb6. [DOI] [PubMed] [Google Scholar]
- 4.Tepas JJ. The National Pediatric Trauma Registry: a legacy of commitment to control of childhood injury. Semin Pediatr Surg. 2004;13(2):126–32. doi: 10.1053/j.sempedsurg.2004.01.009. [DOI] [PubMed] [Google Scholar]
- 5.Tepas JJ, Frykberg ER, Schinco MA, Pieper P, DiScala C. Pediatric Trauma is Very Much a Surgical Disease. 2003;237(6):775–781. doi: 10.1097/01.SLA.0000068118.01520.86. [DOI] [PMC free article] [PubMed] [Google Scholar]
- 6.Rogers SC, Campbell BT, Saleheen h, et al. Using trauma registry data to guide prevention programs. J Trauma. 2010;69(4):S209–13. doi: 10.1097/TA.0b013e3181f1e9fe. [DOI] [PubMed] [Google Scholar]
- 7.Argan PF, Winn D, Anderson C, et al. Rates of Pediatric and Adolescent Injuries by Year of Age. Pediatrics. 2001;108(3):45–56. doi: 10.1542/peds.108.3.e45. [DOI] [PubMed] [Google Scholar]
- 8.Cotton BA, Nance ML. Penetrating trauma in children. Semin Pediatr Surg. 2004;13(2):87–97. doi: 10.1053/j.sempedsurg.2004.01.004. [DOI] [PubMed] [Google Scholar]


