Abstract
Repetitive behaviors are diagnostic for autism spectrum disorders, common in related neurodevelopmental disorders, and normative in typical development. In order to identify factors that mediate repetitive behavior development, it is necessary to characterize the expression of these behaviors from an early age. Extending previous findings, we characterized further the ontogeny of stereotyped motor behavior both in terms of frequency and temporal organization in deer mice. A three group trajectory model provided a good fit to the frequencies of stereotyped behavior across eight developmental time points. Group based trajectory analysis using a measure of temporal organization of stereotyped behavior also resulted in a three group solution. Additionally, as the frequency of stereotyped behavior increased with age, the temporal distribution of stereotyped responses became increasingly regular or organized indicating a strong association between these measures. Classification tree and principal components analysis showed that accurate classification of trajectory group could be done with fewer observations. This ability to identify trajectory group membership earlier in development allows for examination of a wide range of variables, both experiential and biological, to determine their impact on altering the expected trajectory of repetitive behavior across development. Such studies would have important implications for treatment efforts in neurodevelopmental disorders such as autism.
Keywords: neurodevelopmental disorders, autism, deer mice, stereotypy, developmental trajectory, group trajectory modeling, clustering
INTRODUCTION
Stereotyped motor behaviors are defined as repetitive, often rhythmic, movements that are topographically alike and that serve no obvious purpose or function (Lewis & Bodfish, 1998). Repetitive behaviors are diagnostic for autism spectrum disorders and common in related neurodevelopmental disorders such as intellectual disability (Bodfish et al., 2000). A number of other clinical disorders also have aberrant repetitive behaviors as a significant feature of their presentation, including obsessive compulsive disorder, tic disorders, dementias, particularly of the fronto-temporal type, and psychostimulant drug abuse (Frith & Done, 1990). Moreover, early experiential deprivation, including congenital blindness and highly impoverished environments (e.g., orphanages), have been shown to induce repetitive behaviors (Fazzi et al., 1999; Rutter et al., 1999). In addition, motor stereotypies that persist beyond what would be considered developmentally age appropriate have been reported in children that do not meet diagnostic criteria for neurodevelopmental or neurological disorders (Singer, 2009).
Although associated with neuropathological conditions, stereotyped behaviors are ubiquitous in normative development with varying forms of repetitive behavior (stereotypies, compulsions, rituals) being expressed as part of typical child maturation. The earliest of these behaviors to emerge are stereotyped motor behaviors in infants including leg kicks, arm waves, and finger flexion characterized by cyclic “burst-pause” patterns. Later in development (beginning at about age 2 years), more complex repetitive behaviors (e.g., compulsions, rituals) emerge that have a clear cognitive component (e.g., set of invariant rules for a particular activity). Relatively little is known about developmentally normative repetitive behavior, however. For example, the developmental time course of these behaviors in typically developing children has received scant attention (Thelen, 1979; Leonard et al., 1990; Evans et al., 1997). Less attention has been paid to the functional role of these motor acts in brain and behavior development, although such behaviors may aid in transitioning between stages of motor development (Thelen, 1979). Additionally, the relationship between normative and atypical trajectories of repetitive behavior is unclear, although comparisons between infants and toddlers with autism and those that are typically developing have shown similar topographies of repetitive behavior but increased frequency or intensity in children with autism as young as 9-12 months of age (Wolff et al., 2014). The developmental timing of the transition from normative to pathological repetitive behavior has received almost no attention (Pietrefesa & Evans, 2007; Zohar & Bruno, 1997). In addition, we know almost nothing about the neurobiological mechanisms that influence the developmental progression of repetitive behaviors. A noteworthy exception to this is a recent study demonstrating an increased growth rate of the striatum in individuals with autism compared to typically developing controls. This faster striatal growth rate was correlated with greater severity of restricted, repetitive behavior (Langen et al., 2013).
Stereotyped motor behaviors can also be seen in animals under a variety of conditions. Such behavior can be induced as a consequence of CNS insult (e.g., genetic mutations), drug administration (e.g., amphetamine), and environmental restriction (e.g., zoos, farms), as well as being observed in specific inbred mouse strains (e.g., C58) (see recent review by Bechard & Lewis, 2012). Relevant animal models, particularly rodents, are useful for the study of neurobehavioral trajectories given their abbreviated developmental period. Moreover, they provide the opportunity to identify neurobiological changes that mediate the development of abnormal repetitive behavior (Tanimura et al., 2011).
In order to identify key neurobiological changes that mediate repetitive behavior development, it is necessary to characterize the expression of these behaviors from an early age. We have provided an initial characterization of the development of repetitive behavior in Peromyscus maniculatus (deer mice) in an earlier report (Tanimura et al., 2010). Deer mice exhibit high levels of stereotyped motor behavior (vertical jumping, backward somersaulting) as a consequence of being reared in standard laboratory cages (Powell et al., 2000; Presti & Lewis, 2005; Turner et al., 2002; 2003; Turner & Lewis, 2003). In Tanimura et al. (2010), we employed a group-based trajectory modeling procedure (Proc Traj; Jones & Nagin, 2007) to characterize the development of repetitive behavior as a function of age. This analysis yielded three distinct trajectory groups. The first group (Traj 1) consisted of a small group of mice (12% of sample) that expressed uniformly low levels of stereotypy across development. The second group (Traj 2; 44%), though indistinguishable from Traj 1 mice at one week post-weaning exhibited a monotonic increase in the frequency of stereotypy with an asymptote at six weeks post-weaning. The last group (Traj 3; 44%) exhibited high levels of stereotypy starting one week post-weaning with relatively little increase observed subsequently, as stereotypy rates were normalized using a log transform (Tanimura et al., 2010).
In a second study in the same report, we presented a novel method for determining how temporal dynamics of repetitive behavior might change with development. We found that plotting the successive differences between intervals of consecutive individual stereotyped responses emitted during a single dark cycle provided a useful depiction of the organization or regularity of the repetitive behavior. The more closely the plot approximated the letter “Y”, the more highly regular the individual stereotyped responses and bouts of responses. We then presented a novel statistical model to analyze these data based on measuring deviations of scores from the closest of the three axes of the Y (the less variation the lower the Y-score). We also attempted a first approximation of examining the relationship between temporal dynamics and development of stereotypy. To do this we constituted three different groups of mice by evaluating stereotypic responses at 1, 3.5, and 6 weeks post-weaning. We categorized them by cluster analysis as likely reflecting the three trajectory groups. The stereotypy of mice resembling Traj 2 mice exhibited increased regularity across development. The stereotypy of mice resembling Traj 1 and 3 mice showed little change in temporal organization across development.
The present study sought to extend Tanimura et al. (2010) in several key ways. First, we initiated assessment of stereotypy at an earlier point in development, one day after weaning (postnatal day [PND] 22). In our previous work, high levels of stereotypy were observed in many animals by week one post-weaning. Second, we assessed a much larger number of mice, at more developmental time points, and with many fewer missing data. A relatively small number of mice were used in Tanimura et al. (2010) to establish trajectory groups and there were missing data at a number of developmental time points. Additionally, in this study we sought to assess directly the relationship of temporal organization to development and developmental trajectory. In Tanimura et al. (2010) temporal organization was not assessed in those animals for which developmental trajectories were constructed. Instead Y-scores were generated for groups of additional mice at three developmental time points based on cluster analysis. We also sought to extend our earlier work by employing a second method, hierarchical clustering, to provide confirmation of the results of the group based trajectory modeling method (Proc Traj). Finally, we wished to explore the question of prediction of trajectory group membership. Specifically, we sought to explore whether use of classification and regression tree (CART) based methods could be used to identify trajectory groups using a subset of earlier developmental time points.
The ability to predict trajectory group relatively early in development would allow us to pursue a number of future studies designed to look at relevant developmental brain changes and experiential and pharmacological interventions designed to alter the developmental trajectory of repetitive behavior. Such efforts and the their translational value depend on addressing fundamental questions about individual differences in behavior, the stability of those differences across time for different individuals and whether development of aberrant behaviors is usefully characterized by discrete clusters of individuals rather than a general quantitative measure of individual variation.
METHODS
Subjects
All deer mice (Peromyscus maniculatus) were obtained from the breeding colony maintained in our laboratory, and kept on a 16:8-h light/dark cycle with lights off at 10:00 AM. Rodent chow and water were available ad libitum. The room was maintained at 20-25°C and 50-70% humidity. Mice sharing the same weaning date were group-caged (5-6 mice/cage) at weaning (PND 21) in standard rodent cages (48 × 27 × 15 cm) and they remained in the same cage group throughout the experiment. All procedures were performed in accordance with the guidelines set forth in the NIH Guide for the Care and Use of Laboratory Animals and were approved by the University of Florida Institutional Animal Care and Use Committee.
Stereotypy Assessment
Rates of spontaneous stereotypy (hindlimb vertical jumping or backward somersaulting) were assessed using a modified automated photocell detection apparatus (Columbus Instruments) (Tanimura et al., 2010). Photocells were placed around test chambers such that vertical activity (jumping and somersaulting) resulted in beam breaks whereas rearing did not. Each beam break was registered with a real time value using Labview (National Instruments) which allowed us to construct a time series of the intervals between individual consecutive stereotyped responses. The test session consisted of the eight hours of the dark cycle. Mice were individually placed in testing cages (22 × 28 × 25 cm) made of Plexiglas and habituated for at least one hour prior to the beginning of the dark cycle. Food and water were provided. All sessions were digitally video-recorded for identification of behavioral topographies and accuracy of the automated counters.
Developmental trajectories of spontaneous stereotypy
Ninety one mice (female: n=48; male: n=43) were selected from the colony and tested for their rates of stereotypy as described previously (Tanimura et al., 2010; 2011). The frequency of stereotypy for one complete dark cycle was measured at PND 22, 25, 28, 35, 42, 49, 56 and 63. Our previous findings have indicated that levels of stereotypy reach asymptote by six weeks post-weaning.
In order to determine qualitatively different developmental trajectories of repetitive behavior, we employed the same group-based trajectory modeling procedure (Proc Traj) as in Tanimura et al. (2010) (Jones & Nagin, 2007; Jones, Nagin, & Roeder, 2001). Proc Traj is a specialized mixture model that estimates the trajectories of multiple groups within the population as opposed to regression or growth curve procedures that model only one mean within the population. We employed a separate quadratic temporal trend for each trajectory group; its adequacy was validated using semiparametric regression (Wood, 2006). Proc Traj calculated the probability of membership in each discrete trajectory group for each mouse. The number of discrete developmental trajectories that best accounted for individual data was selected by considering hierarchical clustering, the results of our previous work, and the values of the Bayesian Information Criterion (BIC) scores between different models. Trajectories were calculated using the log of a mouse's total stereotypy counts during a single dark cycle. A log transformation was used owing to the non-homogeneity of variance of data related to developmental changes in stereotypy frequency.
Temporal organization of spontaneous stereotypy across development
Temporal organization of behavior was evaluated using the same data set as was used to conduct group based developmental trajectory analysis. That is, all stereotypic responses from each mouse counted during a single dark cycle at all eight developmental time points were used.
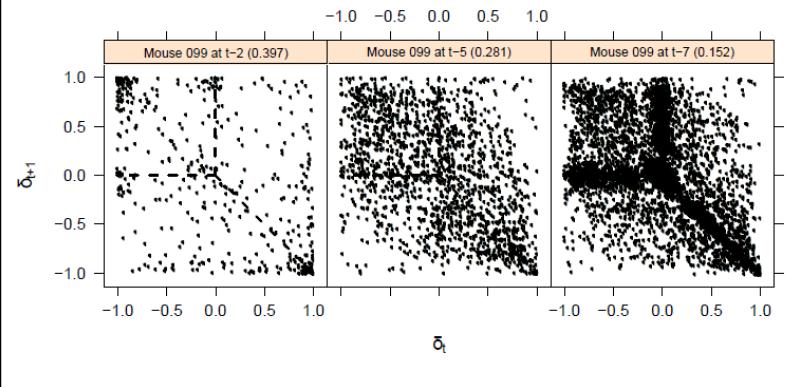
As in Tanimura et al. (2010), we generated successive difference plots using the difference between consecutive inter-response intervals. As the difference between adjacent inter-response intervals was affected by the relative duration of the time between stereotyped responses, we normalized the difference by the magnitude of the durations of xt and xt-1. Also as in Tanimura et al. (2010), we derived a regularity score (Y-score) by aggregating the Euclidean distances from the points in the cloud to the nearest arm of the Y pattern. Low Y-scores reflect a temporal structure in which individual stereotyped responses within each bout of stereotypy are highly regular. Fig. 1 illustrates successive difference score plots showing increasingly temporally organized (decreasing Y-scores) across three developmental time points for the same mouse. As was done with stereotypy frequency scores, Y-scores were also subjected to the group-based trajectory analysis.
Fig. 1.
Successive difference score plots showing increasingly temporally organized repeitive behavior (decreasing Y-scores) across three developmental time points for the same mouse.
Additional Data Analyses
Hierarchical clustering, classification trees (CART), and principal component analysis (PCA) techniques (Hastie et al., 2009) provided further insight into the changes in stereotypy across development and early identification of trajectory group membership. Hierarchical clustering of stereotypy frequencies using Ward's minimum variance method (Johnson & Wichern, 2002) was used to provide an independent assessment of the number of trajectory groups found with Proc Traj model. CART techniques were used to separate the mice into optimally homogenous groups using frequency cutoffs at different time points. CART analysis was used to assess the relative importance of observations at individual developmental time points in classifying individual mice by developmental trajectory. This allows for prediction of trajectory group membership using only data from the early developmental time points, which will be key for various developmental neurobiology studies. The predictive accuracy of our classification trees was assessed using cross validation. Finally, PCA provided some additional insight into how mice may be classified after data dimension reduction. PCA allows one to identify the primary directions of variation among subjects. PCA creates orthogonal combinations of observed variables (called principal component scores) which explain observed variation parsimoniously. We used open-source language and environment R to implement data analysis procedures.
RESULTS
Frequency Trajectories
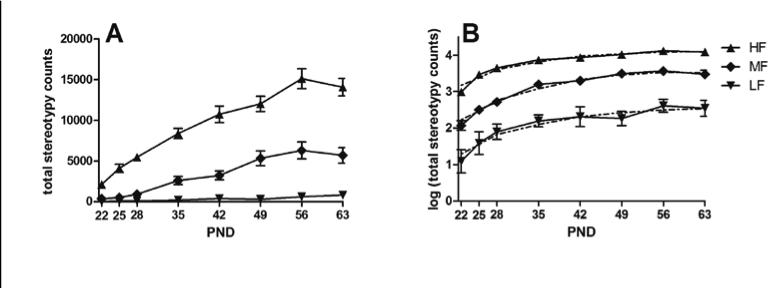
Subjecting total stereotypy counts to Proc Traj yielded a three trajectory group model as a parsimonious solution. The three group solution was independently supported by hierarchical clustering. Figures 2a and 2b provide curves for each trajectory group. Figure 2a depicts the mean stereotypy score for each trajectory group at each developmental time point. Figure 2b depicts the mean log transformed stereotypy score from the estimated mean and one from the fitted quadratic as provided by Proc Traj. The trajectory group exhibiting the lowest frequency of stereotypy (designated LF) across development (bottom curve) included 9 mice (4 males, 5 females; 10% of subjects). This group shows the flattest trajectory of untransformed scores of any group (Fig. 2a). The trajectory group exhibiting medium frequencies (MF) of stereotypy across development (34 mice: 22 males, 12 females, or 37%, middle curve) showed a sizeable increment in stereotypy across development despite exhibiting substantially higher stereotypy counts than the LF mice by PND 35 (Fig. 2a). The third group (top curve; 48 mice: 17 males, 31 females or 53%) exhibited the highest frequency (HF) of stereotypy on the first day following weaning. The developmental trajectory for this group continued to increase monotonically after the first week post-weaning. A chi-square analysis showed a significant relationship between sex and trajectory group (p=0.03) with females overrepresented in the HF group.
Figure 2.
a: Mean stereotypy counts at each of eight developmental time points for each of three trajectory groups. Figure 2b: Mean log transformed stereotypy counts from the estimated mean (solid line) and one from the fitted quadratic (dashed line) for three trajectory groups as provided by Proc Traj. Error bars are ± SEM.
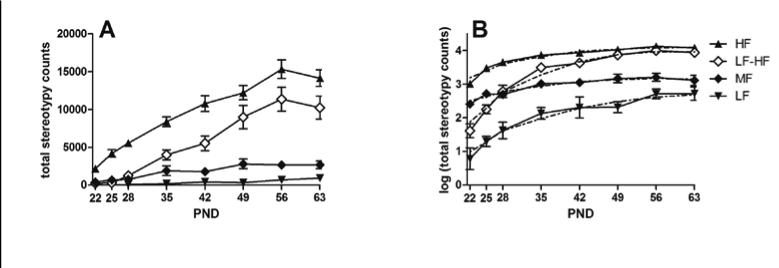
Although a three trajectory group model appeared to be a good fit, we also explored a four trajectory group solution (Fig. 3). The four-group solution effectively split the MF group into mice with medium levels of stereotypy throughout the development but identified a group (n=14) that exhibited the greatest change in level of stereotypy across development. This group (LF-HF) started off almost as low as the LF and at the last developmental time point assessed was almost as high as the HF group. The cross-classification of the mice relative to three- and four-group solutions is given in Table 1.
Figure 3.
a: Mean stereotypy counts at each of eight developmental time points for each of four trajectory groups. Figure 3b: Mean log transformed stereotypy counts from the estimated mean (solid line) and one from the fitted quadratic (dashed line) for four trajectory groups as provided by Proc Traj. Error bars are ± SEM.
Table 1.
Cross-classification of group membership of mice according to a three and four trajectory group solution based on frequency scores.
| 4 Freq Groups | |||||
|---|---|---|---|---|---|
| 3 Freq Groups | Low | ML | MH | High | Total |
| High | 0 | 0 | 1 | 47 | 48 |
| Mid | 0 | 21 | 13 | 0 | 34 |
| Low | 8 | 1 | 0 | 0 | 9 |
| Total | 8 | 22 | 14 | 47 | 91 |
Y-Score Trajectories
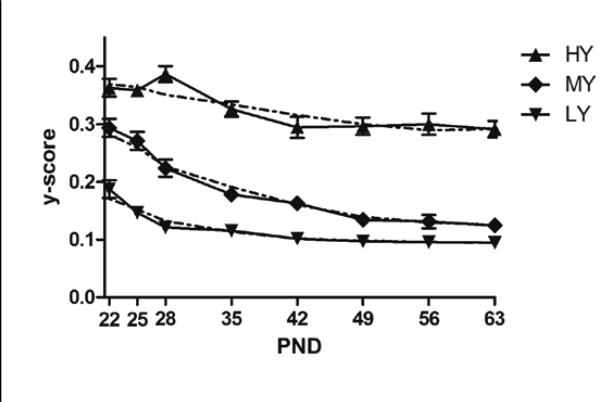
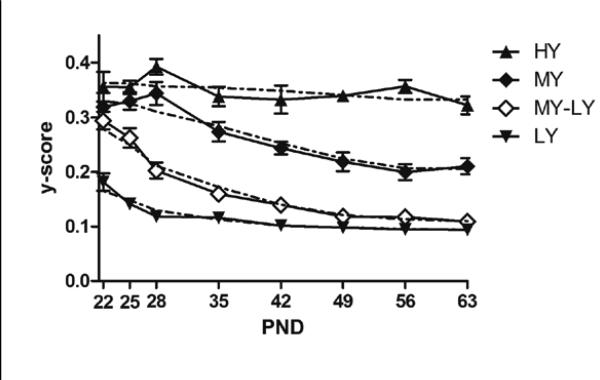
The group based trajectory modeling used the untransformed Y-scores averaged over each individual eight hour dark cycle, with the exception of those dark cycles containing fewer than 100 stereotypy counts (58 sessions involving 32 mice). The cutoff of 100 was chosen to ensure that the standard error is no more than 10 percent of the estimated mean for each individual Y-score. As can be seen in Figure 4, we evaluated a three trajectory group solution. Three trajectory groups were considered a parsimonious solution based on the BIC. The stereotypy of mice depicted in the top curve (23 mice or 25%) was the least organized or regular of the trajectory groups reflected in high Y-scores (HY) and largely remained that way across development. The stereotypy of mice depicted in the middle curve (36 mice or 40%) reflected an initially lower temporal organization (medium Y-scores or MY) as the HY mice but showed a marked change across development becoming increasingly organized or regular. Mice depicted by the bottom curve (32 mice or 35%) exhibited low Y-scores (LY) at the outset. Nonetheless, mice in this trajectory group exhibited a further increase across development in the regularity of their stereotypy.
Figure 4.
Mean Y-scores (solid line) and fitted quadratic (dashed line) at each of eight developmental time points for each of three trajectory groups. Error bars are ± SEM.
Although a three trajectory group model appeared to be a parsimonious fit according to the BIC, we also provided a four trajectory group solution for Y-scores (Fig. 5). Allowing an additional trajectory group identified a group of mice (n=32) that exhibited the greatest change in behavior across development, starting with nearly random repetitive responding and ending virtually even with the most structured group MY-LY. The identification of this group caused a reshaping of two of the other groups. A similar group was constituted which also began with nearly random stereotyped behavior but had a much less dramatic trajectory (n=16) and finished with semi-structured stereotyped responding. Finally, 14 mice were put into a top group which showed almost no developmental change, staying near random throughout the observation period.
Figure 5.
Mean Y-scores (solid line) and fitted quadratic (dashed line) at each of eight developmental time points for each of four trajectory groups. Error bars are ± SEM.
Association between Y-Scores and Frequency
The generation of a three trajectory group solution for both frequency and Y-scores, as well as the general increase in frequency and decrease in Y-scores across development raised the question of the similarity or potential redundancy of these measures. Examination of the correlations between frequency scores and Y-scores indicated these to be negative at each developmental time point. Thus, the greater the frequency of stereotyped responses, the more highly organized the distribution of such responses across time happened to be. Indeed, the variance in Y-scores accounted for by the log frequency scores ranged from 74 to 82% depending on the developmental time point. This relationship is exemplified by the 9 mice that constitute the low frequency trajectory as these same mice fall into the high Y-score trajectory group. Thus, the Y-scores and frequencies are not independent. The concordance between trajectory group membership and Y-score group membership in the 4 group solution is depicted in Table 3.
Table 3.
Cross-classification of membership of mice in discrete trajectory groups based on frequency scores and Y-scores
| 4 Y-score Groups | |||||
|---|---|---|---|---|---|
| 4 Freq Groups | Low | ML | MH | High | Total |
| High | 29 | 18 | 0 | 0 | 47 |
| MH | 0 | 10 | 3 | 1 | 14 |
| ML | 0 | 4 | 12 | 6 | 22 |
| Low | 0 | 0 | 1 | 7 | 8 |
| 29 | 32 | 16 | 14 | 91 | |
Hierarchical Clustering
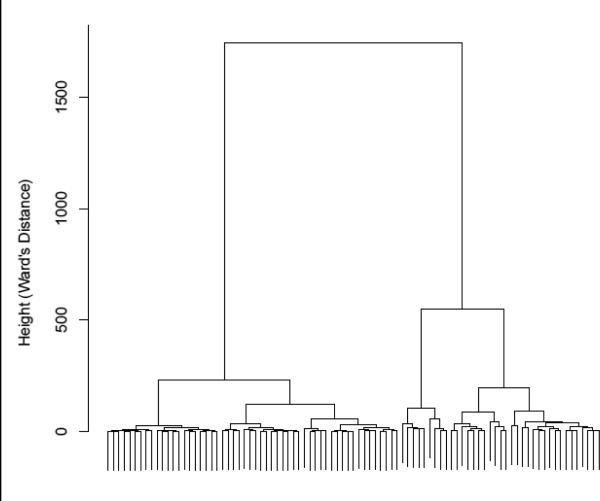
Hierarchical clustering of stereotyped responses reinforced the validity of our findings concerning the trajectory clusters. The clustering dendrogram in Figure 6 indicated that three groups is a stable clustering point suggesting strong overlap between this method and group based trajectory modeling. This overlap extends to individual classifications as depicted in Table 4. The trajectory groups based on log-frequencies are mirrored by the clusters found through hierarchical clustering.
Figure 6.
Hierarchical clustering dendogram based on log-frequencies of stereotypy counts for each time point. The dendrogram shows cluster formation using Ward's distance. Larger vertical distances between mergers indicate that the groups being combined are more dissimilar.
Table 4.
Cross-classification of group membership of mice based on trajectory of frequency scores compared to cluster group membership using log-frequency scores
| Frequency trajectory | |||
|---|---|---|---|
| Cluster | LF | MF | HF |
| 1 | 0 | 6 | 48 |
| 2 | 0 | 28 | 0 |
| 3 | 7 | 0 | 0 |
Classification Trees (CART)
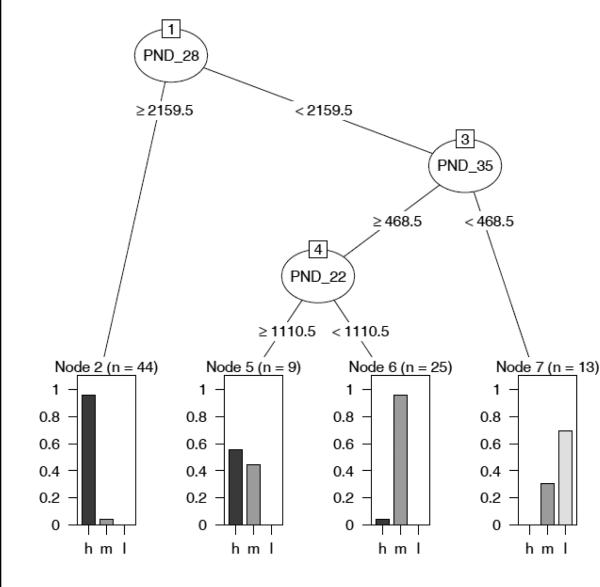
CART methods were used to determine the time points that were most informative for determining into which trajectory group a particular mouse can be classified. CART is a decision tree algorithm that searches for binary splits in the features (i.e., observations at different developmental time points) in order to reduce classification error. The CART results shown in Figure 7 suggest that stereotypy frequencies recorded at PND 22, 28, and 35 were important in predicting frequency trajectories. The CART analysis found that if mice were split into two groups at PND 28, a group exhibiting 2,160 or greater stereotyped responses were homogeneous with 42 of 44 (95.4%) being high trajectory mice (from Proc Traj), so CART considered these animals an end node (see Fig. 7; n=44, left panel). Thus, using PND 28 data, CART was able to identify 42 of the 48 mice that were classified in the HF group by Proc Traj. The CART algorithm then looked at the less homogenous group (the mice which exhibited fewer than 2,160 stereotyped responses at PND 28) and attempted to divide them into more homogeneous groups using frequency splits at other time points. Stereotypy frequencies at PND 35 were used for this purpose and for those mice exhibiting fewer than 468 stereotyped responses at this developmental time point, 13 were constituted as an end node (n=13, right panel, Fig. 7). This split identified nine LF mice (69%) and four (31%) MF mice as grouped by Proc Traj. For those mice exhibiting 468 or greater stereotyped responses at PND 35, data from PND 22 was used to identify two remaining end nodes. Of the mice that emitted fewer than 1110 stereotyped responses at PND 22 (n=25, mid-right panel), 96% were classified in the MF trajectory. Of the mice that emitted greater than 1110 stereotyped responses at PND 22 (n=9, mid-left panel), 56% were classified in the HF trajectory whereas 44% were classified as MF by Proc Traj. We combined the results of 1,000 runs of five-fold cross validation with random splits and computed average misclassification rate. This cross-validation showed that the CART tree was able to predict the trajectory groups for individual mice with 75.8% accuracy (sem=0.1%).
Figure 7.
A classification tree based on stereotypy counts at each of eight developmental time points and predicted trajectory. The tree represents binary splits (nodes) that separate the mice into final groupings (end nodes) which are optimally homogenous in regards to predicted trajectory. Restrictions are put on the splits to prevent overly small end nodes and guard against overfitting. The tree shows that time points PND 28, PND 35, and PND 22 were most informative in determining mouse trajectories (h, m, l or high frequency, mid frequency, low frequency).
Principal component analysis (PCA)
The first principal component, which accounted for 61.65% of variation, loaded nearly evenly from each developmental time point (though it did load somewhat more heavily from PND 28 and 35). This suggests that the raw average of the log frequencies of stereotyped responses across all time periods was the primary determinant of trajectory group membership.
DISCUSSION
In the present paper, we sought to characterize further the ontogeny of stereotyped behavior in the deer mouse model both in terms of frequency and temporal organization. We examined developmental trajectories using measures of stereotypy collected starting at PND 22. Importantly, we examined the temporal organization of stereotypy within the context of different trajectories of development. The interaction between temporal structure and developmental trajectory was only examined preliminarily in our earlier work, so further characterization of the interplay between these fundamental behavioral processes was needed. We also assessed the relationship between frequency of stereotypy and the temporal structure of stereotypy. Finally, we used hierarchical clustering to validate the group based trajectory modeling and used CART to determine if we could predict trajectory group membership based on fewer (earlier) developmental time points.
Consistent with our earlier findings, deer mice developed adult levels of repetitive behavior by about 6 weeks post-weaning. Despite adding earlier developmental time points, using 6 weeks post-weaning rather than 8 weeks as our last developmental time point, and using a different and larger sample of animals, we still found that a three group trajectory model provided a good fit to the data available. Interestingly, HF mice showed elevated levels of stereotypy even at one day after weaning and continued to exhibit increases across development. MF mice showed intermediate levels of stereotypy and, consistent with our previous findings, an increase across development in stereotypy although less pronounced than seen previously. Here, the utility of a four group resolution is useful in that MF mice can be sub-grouped with one of the sub-groups showing a much more dramatic upward trajectory. LF mice exhibited the lowest levels of stereotypy at PND 22 and their overall trajectory was largely flat, an outcome also consistent with our previous findings. These LF mice do not exhibit alternative forms of repetitive behavior nor have we noted any other behavioral characteristics that differentiate them although we have not systematically evaluated this issue.
In our earlier work, we initiated data collection at PND 28 to insure that the repetitive behavior would be of sufficient amplitude and form to be measured reliably. In the present study, stereotyped behavior expressed even one day after weaning was similar in form and amplitude to that observed at PND 28 and later. Our automated measures successfully recorded repetitive behavior even at the earliest time point as validated by coding accompanying video. Thus, one important future direction for this line of research is to map the trajectories of stereotyped behavior in pre-weaning mice.
Group based trajectory analysis using temporal organization (Y-scores) as opposed to frequency was also evaluated with a three group solution. HY mice exhibited a distribution of their stereotyped responses over 8 hours at PND 22 that approximated random. Their stereotyped behavior became only slightly more organized across development. MY mice were somewhat more organized in the temporal pattern of their stereotypy at PND 22 compared to HY mice. More importantly, they exhibited an increasingly more organized or regular temporal pattern of stereotypy across the remaining developmental periods. LY mice showed the most highly organized temporal structure of stereotypy at PND 22 that nevertheless became more organized until it reached an asymptote at week 3 post-weaning. As with the frequency analysis, a four trajectory group resolution was useful as it depicted a sub-group that started out exhibiting largely unorganized stereotypy but showed a dramatic decrease in Y scores or increase in regularity across development.
The design of the present study allowed us to address more fully the question of the relationship between frequency and temporal organization. Based on a relatively small number of subjects assessed at only one developmental time point, our earlier work suggested that these measures might be largely independent. The assessment of both variables in a much larger number of animals at each of the eight developmental time points suggested otherwise. Our findings indicate that as frequency increases, the distribution of stereotyped responses over the eight hour dark cycle became increasingly regular or organized. Cross-classification of mice in frequency trajectory groups compared to Y-score trajectory groups suggest that these measures are not the same and that animals belonging to a specific frequency trajectory group do not all aggregate in a single Y-score trajectory group.
Establishing the reproducibility of specific developmental trajectory groups allows for investigation of variables that predict trajectory membership. Such variables can include both time independent (e.g., sex, litter) and time dependent (e.g., environmental or experiential variables) covariates. In relation to one such time independent variable, we found female mice were significantly more likely to be in the HF trajectory group. This is comparable to the mouse repetitive behavior literature that finds females show increased repetitive behavior upon certain challenges, including gene knockout (El-Kordi, Winkler, Hammerschmidt, Kastner, Krueger, Ronnenberg, Ritter, Jatho, Radyushkin, Bourgeron, Fischer, Brose, & Ehrenreich, 2013), decreased maternal resources (Bechard, Nicholson, & Mason, 2012), or in response to novelty or psychostimulant administration (Van Swearingen, Walker, & Kuhn, 2013). The neurobiological cause for this sex difference has not been identified and is in contrast to the human ASD literature, which demonstrates lower repetitive behavior subscores for ASD females when compared to ASD males (Szatmari, Liu, Goldber, Zwaigenbaum, Paterson, Woodbury-Smith, Georgiades, Duku, & Thompson, 2012; Mandy, Chilvers, Chowdhury, Salter, Seigal, & Skuse, 2012; Hartley & Sikora, 2009). Additionally, although comprising a relatively small number of mice, it would seem to be very instructive to identify potential mechanisms that protect LF mice from developing high levels of repetitive behavior despite being reared in standard cages. Although we have done some preliminary work in this area (Tanimura et al., 2011) a great deal more work needs to be done to identify neurobiological mechanisms that mediate the differential timing of the expression of stereotypy.
Additional data analysis provided support for the existence of trajectory groups and offers paths for future investigations and data collection refinements. Hierarchical clustering analysis supported our trajectory modeling results and provided additional evidence of separate, defined developmental paths which can be identified through multiple methods. CART and PCA showed that although each observation assisted in determining group membership, accurate classification could be done with fewer observations (developmental time points). This finding is of considerable importance for future work. A wide range of variables, both experiential and biological, can now be examined to determine their impact on altering the expected trajectory of repetitive behavior across development. The ability to determine trajectory group membership relatively early in development will allow us to conduct neurobiological studies to assess developmental brain changes that mediate the expression of repetitive behavior. In addition, early prediction of trajectory group membership will allow us to conduct a range of studies examining the effects of various early interventions (e.g., pharmacological, experiential) designed to alter the developmental trajectory of repetitive behavior.
Such studies would have important implications for neurodevelopmental disorders such as autism. There is evidence for discrete trajectory groups when analyzing changes in repetitive behavior in children with autism over development (Richler, Huerta, Bishop, & Lord, 2010). Interestingly, this study found three sub-groups with qualitatively distinct developmental trajectories of repetitive behavior using the same group-based trajectory modeling procedure as used in the present study. The design of effective early intervention efforts will need this fundamental information about individual differences and stability and change in the development of behavior.
Table 2.
Cross-classification of group membership of mice according to a three and four trajectory group solution based on Y-scores.
| 4 Yscore Groups | |||||
|---|---|---|---|---|---|
| 3 Yscore Groups | Low | ML | MH | High | Total |
| High | 0 | 0 | 9 | 14 | 23 |
| Mid | 0 | 29 | 7 | 0 | 36 |
| Low | 29 | 3 | 0 | 0 | 32 |
| Total | 29 | 32 | 16 | 14 | 91 |
ACKNOWLEDGEMENTS
We gratefully acknowledge the assistance of Vik Gopal and Ruoxuan Xiang and the support provided by NIMH grant #MH080055 as well as the NIH/NCATS CTSA grant UL1 TR000064 (KL2 TR000065).
REFERENCES
- Bechard A, Lewis MH. Modeling restricted repetitive behavior in animals. Autism: Open Access. 2012;S1:006. [Google Scholar]
- Bechard A, Nicholson A, Mason G. Litter size predicts adult stereotypic behavior in female laboratory mice. Journal of the American Association for Laboratory Animal Science. 2012;51(4):407–411. [PMC free article] [PubMed] [Google Scholar]
- Bodfish JW, Symons FJ, Parker DE, Lewis MH. Varieties of repetitive behavior in autism: comparisons to mental retardation. Journal of Autism and Developmental Disorders. 2000;30(3):237–43. doi: 10.1023/a:1005596502855. [DOI] [PubMed] [Google Scholar]
- El-Kordi A, Winkler D, Hammerschmidt K, Kastner A, Krueger D, Ronnenberg A, Ritter C, Jatho J, Radyushkin K, Bourgeron T, Fischer J, Brose N, Ehrenreich H. Development of an autism severity score for mice using Nlgn4 null mutants as a construct-valid model of heritable monogenic autism. Behavioural Brain Research. 2013;251:41–49. doi: 10.1016/j.bbr.2012.11.016. [DOI] [PubMed] [Google Scholar]
- Evans DW, Leckman JF, Carter A, Reznick JS, Henshaw D, King RA, et al. Ritual, habit, and perfectionism: the prevalence and development of compulsive-like behavior in normal young children. Child Development. 1997;68(1):58–68. [PubMed] [Google Scholar]
- Fazzi E, Lanners J, Danova S, Ferrarri-Ginevra O, Gheza C, Luparia A, Balottin U, Lanzi G. Stereotyped behaviours in blind children. Brain & Development. 1999;21:522–28. doi: 10.1016/s0387-7604(99)00059-5. [DOI] [PubMed] [Google Scholar]
- Frith CD, Done DJ. Stereotyped behaviour in madness and in health. Clarendon Press; Oxford: 1990. [Google Scholar]
- Harltey SL, Sikora DM. Sex differences in autism spectrum disorder: an examination of developmental functioning, autistic symptoms, and coexisting behavior problems in toddlers. Journal of Autism and Developmental Disorders. 2009;39:1715–1722. doi: 10.1007/s10803-009-0810-8. [DOI] [PMC free article] [PubMed] [Google Scholar]
- Hastie T, Tibshirani R, Friedman J. Elements of Statistical Learning. Springer; New York: 2009. [Google Scholar]
- Johnson RA, Wichern DW. Applied Multivariate Statistical Analysis. 5th ed. Prentice Hall; NJ: 2002. [Google Scholar]
- Jones B, Nagin D. Advances in group-based trajectory modeling and a SAS procedure for estimating them. Sociological Methods and Research. 2007;35(4):542–571. [Google Scholar]
- Jones B, Nagin D, Roeder K. A SAS procedure based on mixture models for estimating developmental trajectories. Sociological Methods and Research. 2001;29:374–393. [Google Scholar]
- Langen M, Bos D, Noordermeer S, Nederveen H, van Engeland H, Durston S. Changes in the development of striatum are involved in repetitive behavior. Biological Psychiatry. 2013 doi: 10.1016/j.biopsych.2013.08.013. in press. [DOI] [PubMed] [Google Scholar]
- Leonard H, Goldberger E, Rapoport J, Cheslow B, Swedo S. Childhood rituals: Normal development or obsessive-compulsive symptoms? Journal of the American Academy of Child and Adolescent Psychology and Psychiatry. 1990;29:17–23. doi: 10.1097/00004583-199001000-00004. [DOI] [PubMed] [Google Scholar]
- Lewis MH, Bodfish JW. Repetitive behavior disorders in autism. Mental Retardation and Developmental Disabilities Research Reviews. 1998;4:80–89. [Google Scholar]
- Mandy W, Chilvers R, Chowdhury U, Salter G, Seigal A, Skuse D. Sex differences in autism spectrum disorder: evidence from a large sample of children and adolescents. Journal of Autism and Developmental Disorders. 2012;42(7):1304–1313. doi: 10.1007/s10803-011-1356-0. [DOI] [PubMed] [Google Scholar]
- Pietrefesa A, Evans D. Affective and neuropsychological correlates of children's rituals and compulsive-like behaviors: Continuities and discontinuities with obsessive–compulsive disorder. Brain and Cognition. 2007;65:36–46. doi: 10.1016/j.bandc.2006.02.007. [DOI] [PubMed] [Google Scholar]
- Powell SB, Newman HA, McDonald TA, Bugenhagen P, Lewis MH. Development of spontaneous stereotyped behavior in deer mice: Effects of early and late exposure to a more complex environment. Developmental Psychobiology. 2000;37:100–8. [PubMed] [Google Scholar]
- Presti MF, Lewis MH. Striatal opioid peptide content in an animal model of spontaneous stereotypic behavior. Behavioural Brain Research. 2005;157:363–8. doi: 10.1016/j.bbr.2004.08.003. [DOI] [PubMed] [Google Scholar]
- R Development Core Team . R: A language and environment for statistical computing. R Foundation for Statistical Computing; Vienna, Austria: 2008. ISBN 3-900051-07-0, URL http://www.R-project.org) [Google Scholar]
- Rutter M, Andersen-Wood L, Beckett C, Bredenkamp D, Castle J, Groothues C, Kreppner J, Keaveney L, Lord C, O'Connor TG, the English and Romanian Adoptees (ERA) Study Team Quasi-autistic patterns following severe early global privation. Journal of Child Psychology and Psychiatry and Allied Disciplines. 1999;40:537–49. [PubMed] [Google Scholar]
- Singer HS. Motor stereotypies. Seminars in Pediatric Neurology. 2009;16(2):77–81. doi: 10.1016/j.spen.2009.03.008. [DOI] [PubMed] [Google Scholar]
- Szatmari P, Liu XQ, Goldberg J, Zwaigenbaum L, Paterson AD, Woodbury-Smith M, Georgiades S, Duku E, Thompson A. Sex differences in repetitive stereotyped behaviors in autism: Implications for genetic liability. American Journal of Medical Genetics Part B. 2012;159B:5–12. doi: 10.1002/ajmg.b.31238. [DOI] [PubMed] [Google Scholar]
- Tanimura Y, King MA, Williams DK, Lewis MH. Development of repetitive behavior in a mouse model: Roles of indirect and striosomal basal ganglia pathways. International Journal of Developmental Neuroscience. 2011;29:461–7. doi: 10.1016/j.ijdevneu.2011.02.004. [DOI] [PMC free article] [PubMed] [Google Scholar]
- Tanimura Y, Yang MC, Ottens AK, Lewis MH. Development and temporal organization of repetitive behavior in an animal model. Developmental Psychobiology. 2010;52(8):813–24. doi: 10.1002/dev.20477. [DOI] [PMC free article] [PubMed] [Google Scholar]
- Thelen E. Rhythmical stereotypies in normal human infants. Animal Behavior. 1979;27(Pt 3):699–715. doi: 10.1016/0003-3472(79)90006-x. [DOI] [PubMed] [Google Scholar]
- Thelen E. Determinants of stereotyped behaviour in normal human infants. Ethology and Sociobiology. 1980;1:141–150. [Google Scholar]
- Turner CA, Lewis MH, King MA. Environmental enrichment: Effects on stereotyped behavior and dendritic morphology. Developmental Psychobiology. 2003;43:20–7. doi: 10.1002/dev.10116. [DOI] [PubMed] [Google Scholar]
- Turner CA, Lewis MH. Environmental enrichment: effects on stereotyped behavior and neurotrophin levels. Physiology & Behavior. 2003;80:259–66. doi: 10.1016/j.physbeh.2003.07.008. [DOI] [PubMed] [Google Scholar]
- Turner CA, Yang MC, Lewis MH. Environmental enrichment: effects on stereotyped behavior and regional neuronal metabolic activity. Brain Research. 2002;938:15–21. doi: 10.1016/s0006-8993(02)02472-1. [DOI] [PubMed] [Google Scholar]
- Van Swearingen AED, Walker QD, Kuhn CM. Sex differences in novelty- and psychostimulant-induced behaviors of C57Bl/6 mice. Psychopharmacology. 2013;255:707–718. doi: 10.1007/s00213-012-2860-4. [DOI] [PMC free article] [PubMed] [Google Scholar]
- Wolff JJ, Botteron KN, Dager SR, Elison JT, Estes AM, Gu H, Hazlett HC, Pandey J, Paterson SJ, Schultz RT, Zwaigenbaum L, Piven J, IBIS Network Longitudinal patterns of repetitive behavior in toddlers with autism. Journal of Child Psychology and Psychiatry. 2014;55(8):945–53. doi: 10.1111/jcpp.12207. [DOI] [PMC free article] [PubMed] [Google Scholar]
- Wood S. Generalized Additive Models: An Introduction with R. Chapman & Hall/CRC.; 2006. [Google Scholar]
- Zohar AH, Bruno R. Normative and pathological obsessive-compulsive behavior and ideation in childhood: a question of timing. Journal of Child Psychology and Psychiatry. 1997;38(8):993–9. doi: 10.1111/j.1469-7610.1997.tb01616.x. [DOI] [PubMed] [Google Scholar]


