Summary
Contusive spinal cord injury (SCI) leads to a variety of disabilities due to limited neuronal regeneration and functional plasticity. It is well established that an upregulation of glial derived chondroitin sulfate proteoglycans (CSPGs) within the glial scar and perineuronal net (PNN) creates a barrier to axonal regrowth and sprouting1–5.
Protein Tyrosine Phosphatase σ (PTPσ), along with its sister phosphatase Leukocyte common Antigen-Related (LAR), and the Nogo Receptors 1 and 3 (NgR) have recently been identified as receptors for the inhibitory glycosylated side chains of CSPGs6–8. We found that PTPσ plays a critical role in converting growth cones into a dystrophic state by tightly stabilizing them within CSPG-rich substrates. We generated a membrane-permeable peptide mimetic of the PTPσ wedge domain that binds to PTPσ and relieves CSPG-mediated inhibition. Systemic delivery of this peptide over weeks restored substantial serotonergic innervation to the spinal cord below the level of injury and facilitated functional recovery of both locomotor and urinary systems. Our results add a new layer of understanding to the critical role of PTPσ in mediating the growth-inhibited state of neurons due to CSPGs within the injured adult spinal cord.
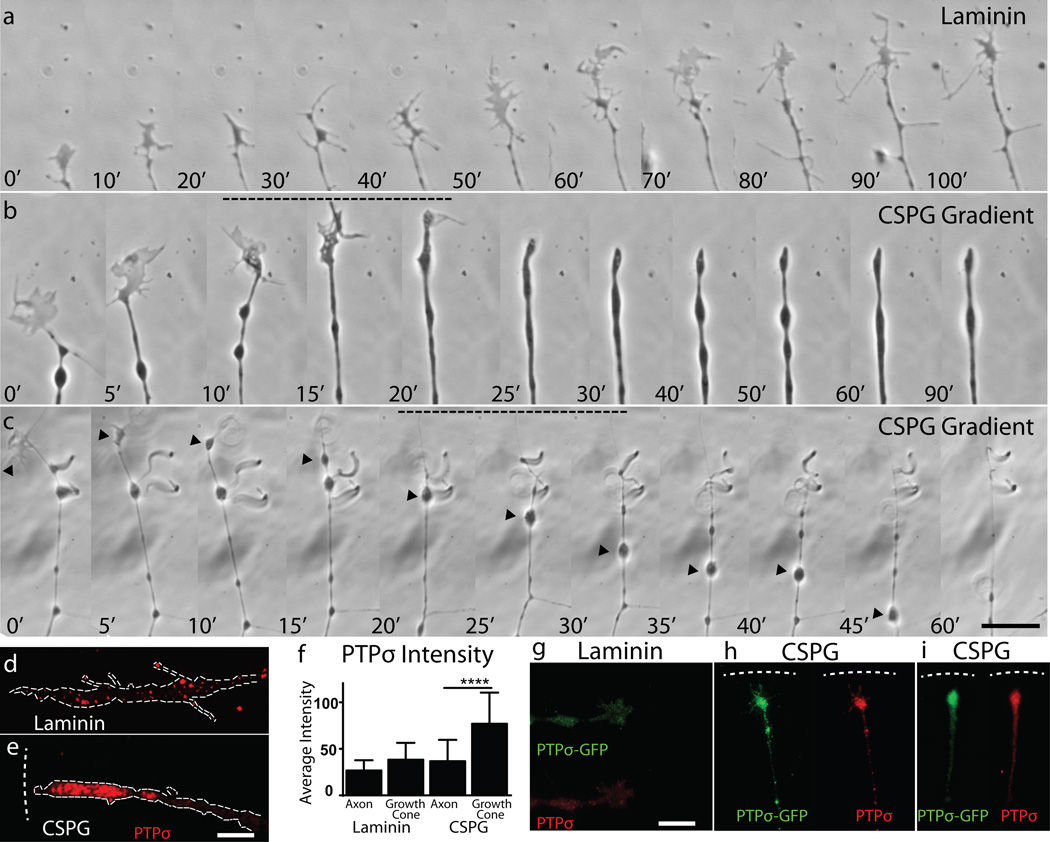
Our laboratory has developed an in vitro model of the inhibitory extracellular matrix that forms following SCI, wherein adult sensory neurons form dystrophic endballs as they attempt to traverse an increasing gradient of CSPG9. Our previous studies focused on dystrophic growth cones stalled within the CSPG gradient that remained active as they recycled membrane9, 10. We now report that chronic exposure to CSPG can induce the development of a distinct over-adhered morphology with no forward motility (Fig. 1a-c, Supplementary Videos 1–3). Any newly formed growth cones rapidly involute into large blebs, resulting in a beaded axon with one tip or multiple side branches all terminating in small punctate adhesive contacts (Fig. 1c, Supplementary Video 3). This morphology is remarkably similar to that in the chronically injured cat spinal cord described by Ramon y Cajal in the early 20th century11.
Figure 1. Immobilization of growth cones within gradients of CSPG.
A-C: Time-lapse imaging in which the growth cones of adult sensory neurons are either (A) motile upon a uniform substrate of laminin or (B-C) stabilizing within the gradient of proteoglycan. Arrowhead= absorbed growth cone. (Supplementary. Videos 1–3). Timestamp=minutes. Scale bar 20µm, D-J: PTPσ staining in motile or stabilized growth cones. n=16 Laminin, 26 CSPG for both treatments, error bars=SEM, One way ANOVA, Tukey’s post hoc test, *** P<0.001, F=19.9. G-I: Adult sensory neurons expressing a PTPσ-GFP plasmid. Dashed line=CSPG gradient.
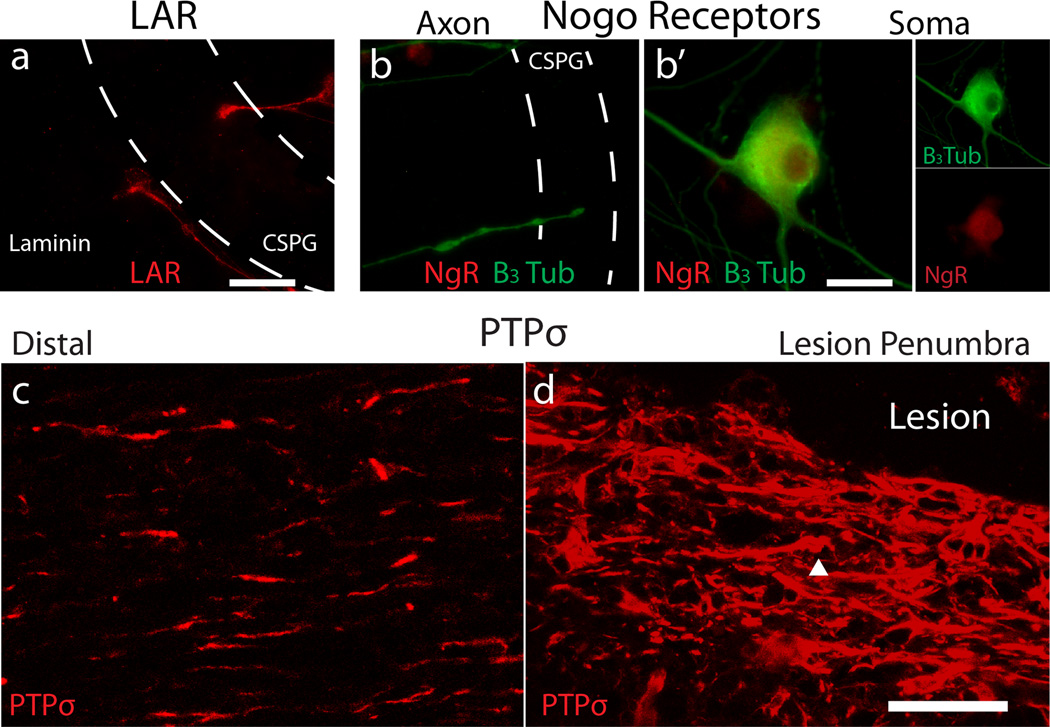
Interestingly, while PTPσ is evenly distributed in a punctate pattern within motile axons and growth cones, it becomes concentrated in dystrophic stabilized growth cones (Fig. 1d-i). We found similar elevations of LAR, but not NgRs (Supp. Fig. 1a-b). In addition, we observed a large concentration of PTPσ in the lesion penumbra following SCI (Extended Data Fig. 1c-d). As PTPσ co-localizes with adhesion plaques and focal adhesions12, 13, we hypothesized that it played a critical role in growth cone immobilization and progression into a dystrophic state. Therefore, we sought to target PTPσ to relieve CSPG-mediated inhibition.
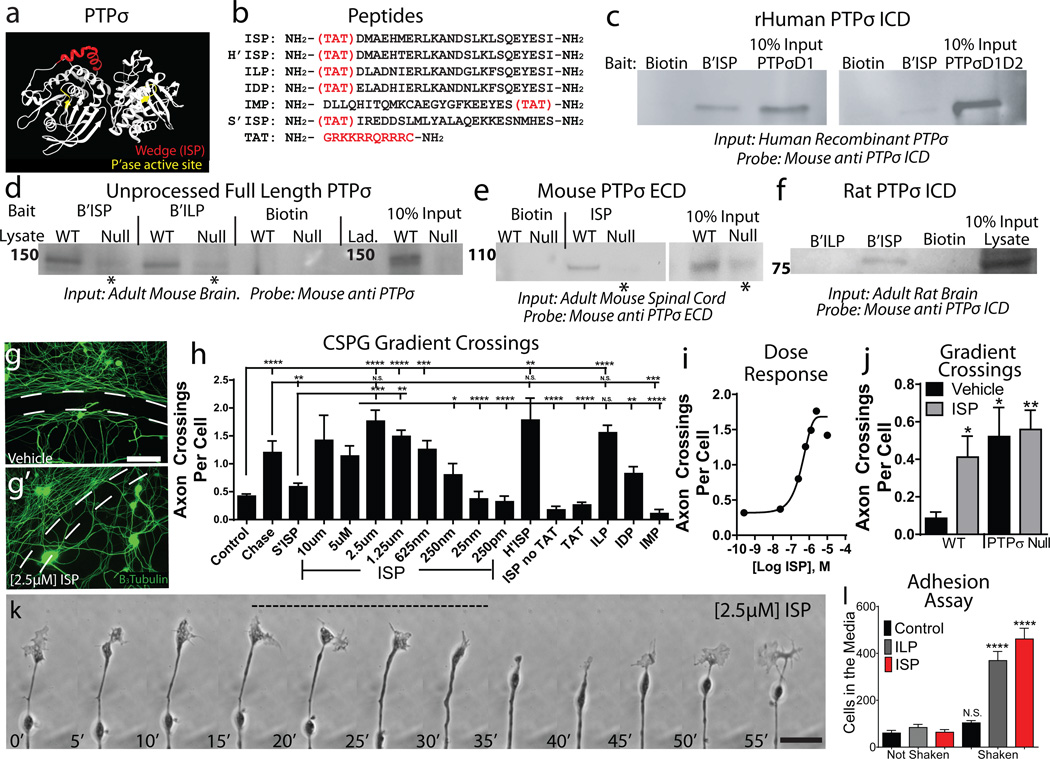
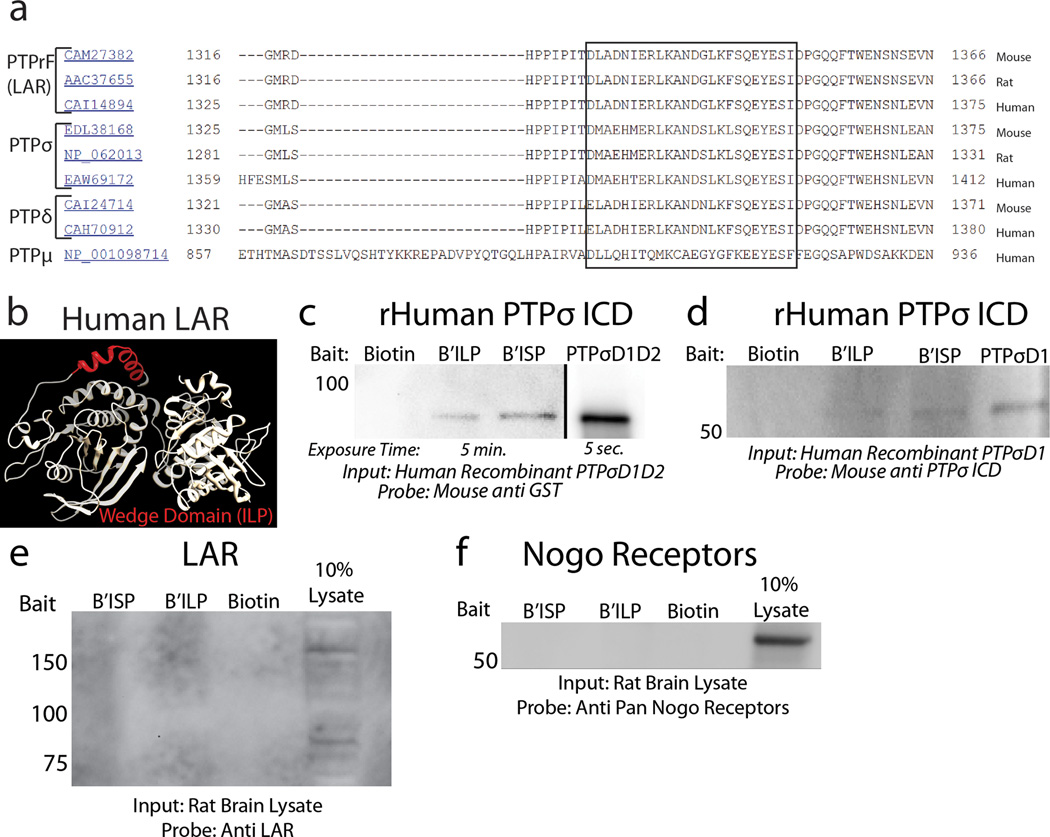
Upon analyzing the structure of PTPσ and related phosphatases, we identified a highly conserved 24 amino acid intracellular wedge domain (Fig. 2a, Extended Data Fig. 2a-b). As wedge domains are known to regulate downstream signaling through a variety of mechanisms7, 14–16, we designed Intracellular Sigma Peptide (ISP), a novel peptide-mimetic of the PTPσ wedge with a Tat domain to facilitate membrane-penetration (Fig. 2b).
Figure 2. Identification and characterization of ISP.
A: PTPσ structure and wedge domain (red). B: Peptide Sequences. C-F: Pulldown of human, rat and mouse PTPσ with biotinylated ISP. *Nonspecific recognition of PTPδ. G-I: CSPG gradient crossing assay. Dashed Lines=CSPG gradient, scale Bar 50µm, n>16 gradients/group. J: ISP treatment on PTPσ null neurons (n=12/group). K: Time-lapse imaging of an adult sensory neuron growth cone following 2.5µM ISP treatment (Supplementary Video 4).Time-stamp=minutes. Scale bar 20µM. L: The number of neurons released from a CSPG-rich substrate following agitation (n=28 vehicle/ILP, 16 ISP wells/group). Scale bar 50µm. Error bars=SEM, One way ANOVA, Tukey’s post hoc test, *p<.05, **p<0.01, *** p<0.001, *** p<0.0001. Additional sample size information in methods.
ISP was able to bind to recombinant human PTPσ (Fig. 2c). In rodent brain and spinal cord lysates, ISP pulled down both immature full length PTPσ and the mature functional complex (Fig. 2d-f)12. In PTPσ null mice, only a very minor signal was detected which may reflect nonspecific binding to PTPδ, the third LAR family member (Fig 2d-e)17. No detectable binding was observed between ISP and other CSPG receptors such as LAR and NgRs (Extended Data Fig. 2e-f). Interestingly, a LAR wedge-domain Peptide (ILP)14 was also capable of binding PTPσ, but less efficiently than ISP (Fig. 2d,f; Extended Data Fig 2c-d).
We next asked whether ISP could release CSPG-mediated axonal inhibition in vitro. ISP treatment allowed adult sensory neurons to extend axons through a CSPG gradient in a dose dependent manner to the same extent as pre-treatment with Chondroitinase ABC (Ch’ABC), which cleaves the glycosylated CSPG side chains and removes the PTPσ ligand (Fig. 2g-i)6. Time-lapse microscopy revealed that while growth cones treated with ISP were still transiently collapsed by CSPG, they continued to reform growth cones, allowing them to eventually cross the gradient (Fig. 2k, Supplementary Video 4). Additionally, both ISP and ChABC treatments were sufficient to convert already stabilized dystrophic growth cones into a motile state (data not shown). Interestingly, human ISP (H’ISP) and the wedge domain peptides of PTPδ and LAR (IDP and ILP) demonstrated some efficacy, suggesting functional redundancy among LAR family wedge domains. The wedge domain of PTPµ (IMP), scrambled ISP, Tat alone, or ISP without Tat were ineffective (Fig. 2h).
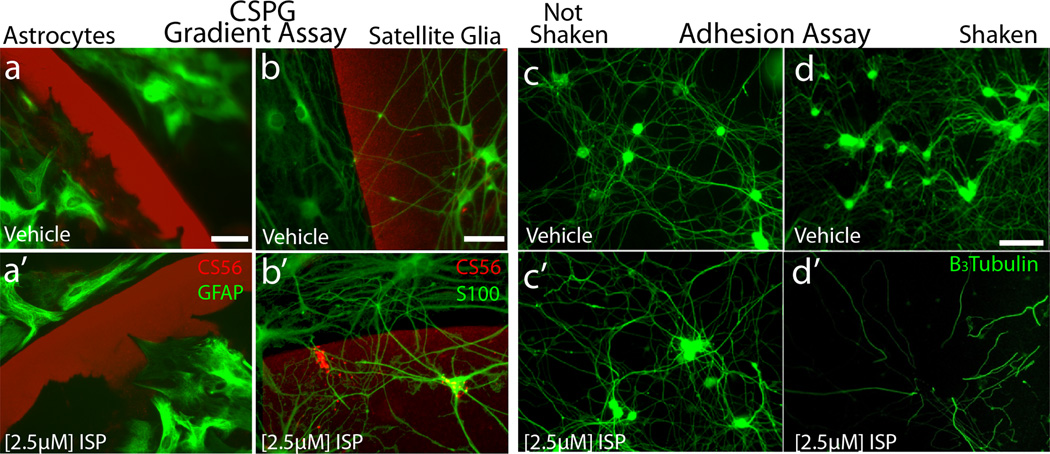
Importantly, treatment of adult PTPσ null sensory neurons with ISP did not further increase crossings (Fig 2j)6. In addition, mature astrocytes, which have immunocytochemically undetectable PTPσ18, were unable to traverse the CSPG gradient after ISP treatment (Extended Data Fig 3a). However, PTPσ-expressing satellite glia were induced to cross successfully (Extended Data Fig.3b). These results suggest specificity of ISP interactions through PTPσ.
ISP concentrations above the optimal dose for gradient crossing greatly reduced neuronal cell attachment, suggesting a reversal of the over-adhered phenotype. ISP treatment decreased interactions between the CSPG-rich substrate and PTPσ, allowing cells to detach in response to agitation (Fig. 2l, Extended Data Fig 3c-d). This suggests that appropriate levels of adhesion are critical for regeneration across increasing concentrations of innately inhibitory CSPGs19.
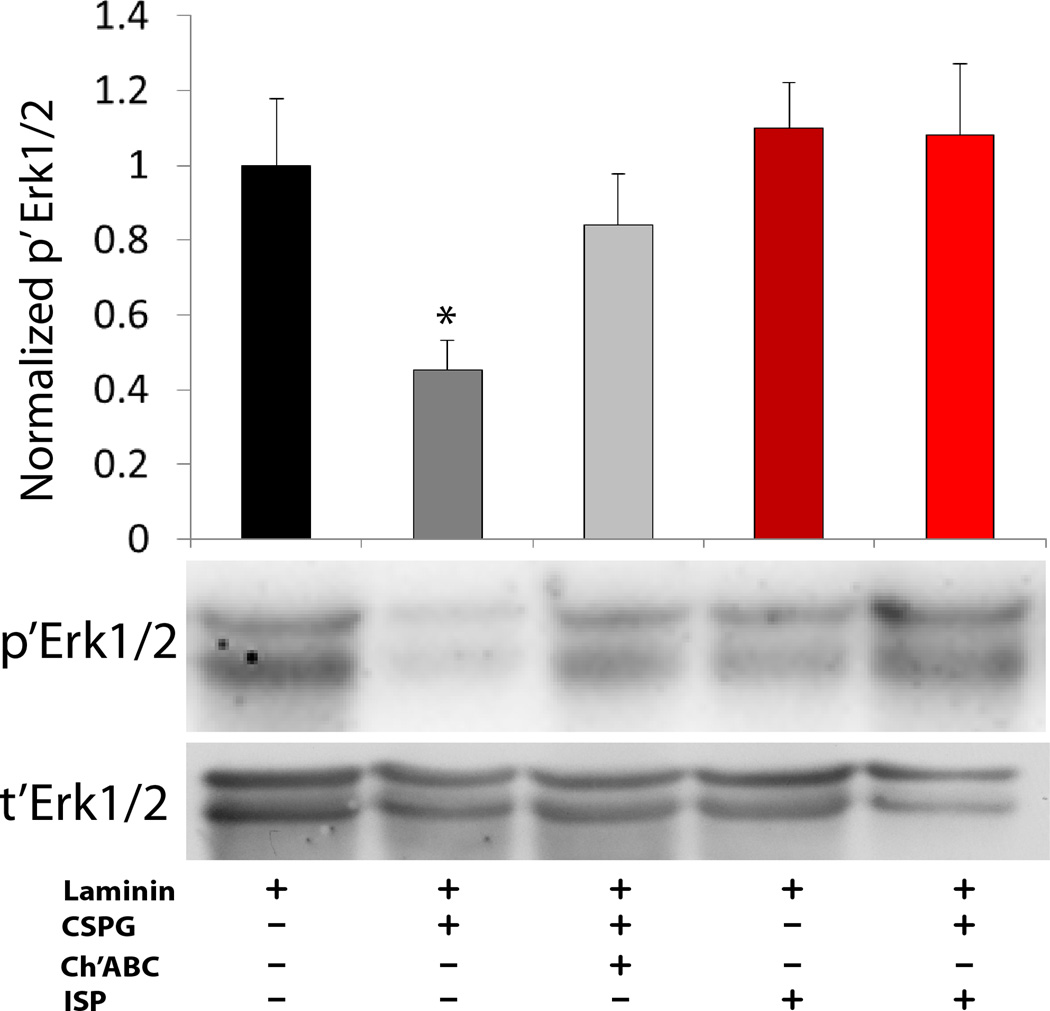
The extracellular signal-regulated kinase 1/2 (ERK1/2) cascade regulates a variety of processes, including neuronal growth20. ERK1/2 phosphorylation was decreased in neuronal cells grown on a CSPG-rich substrate and both ISP and Ch’ABC were able to restore the phosphorylation state of ERK1/2 to levels comparable to that on laminin-only substrates (Extended Data Fig. 4)21.
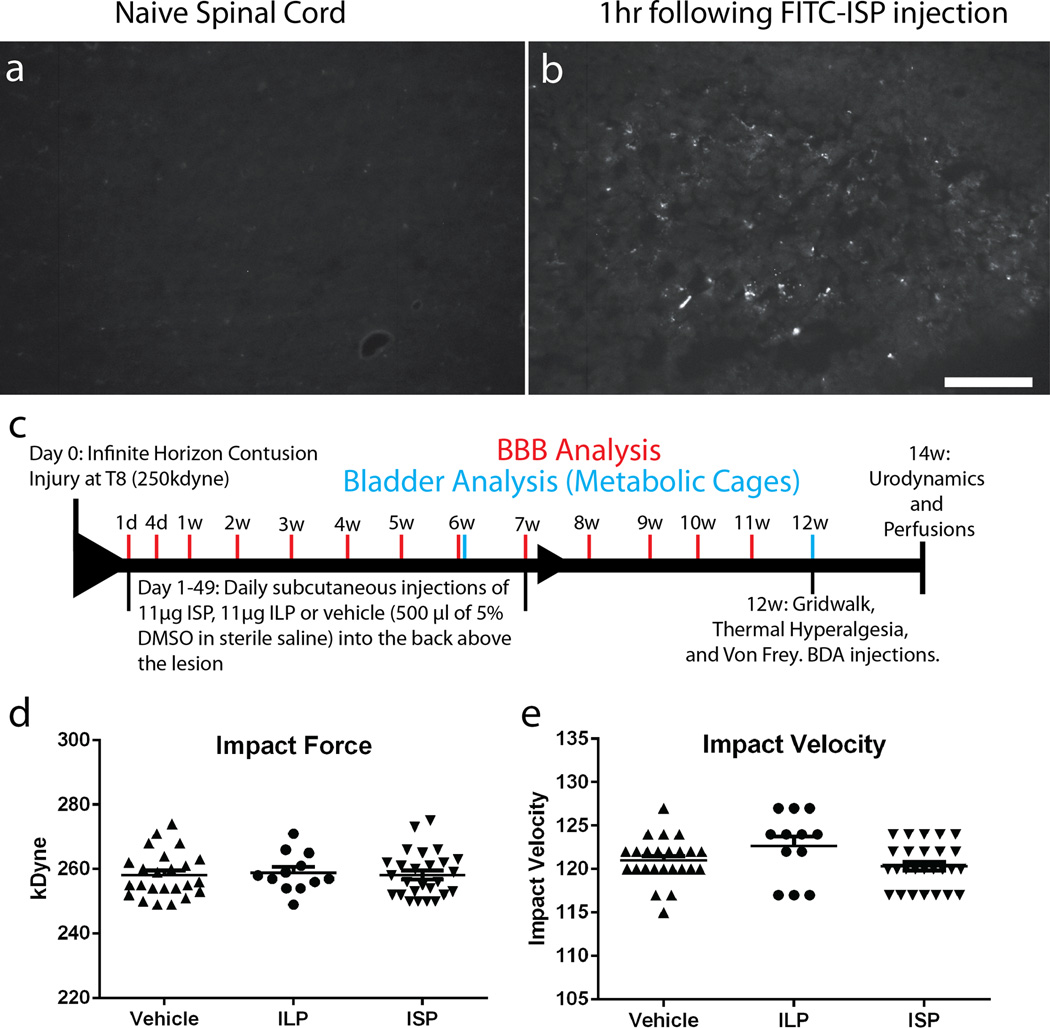
Tat-conjugated peptides are known to cross biological membranes including the blood brain barrier22. One hour following a single sub-cutaneous injection of FITC-ISP, we were able to visualize it in the intact nervous system (Extended Data Fig. 5a-b). Therefore, we chose a non-invasive systemic treatment paradigm using daily subcutaneous injections, avoiding complications associated with intraparenchymal delivery23. Beginning one day following contusive spinal cord injury, animals were treated with ISP (11µg/d), ILP (11µg/d) or vehicle once daily for 7 consecutive weeks (Extended Data Fig. 5c-e).
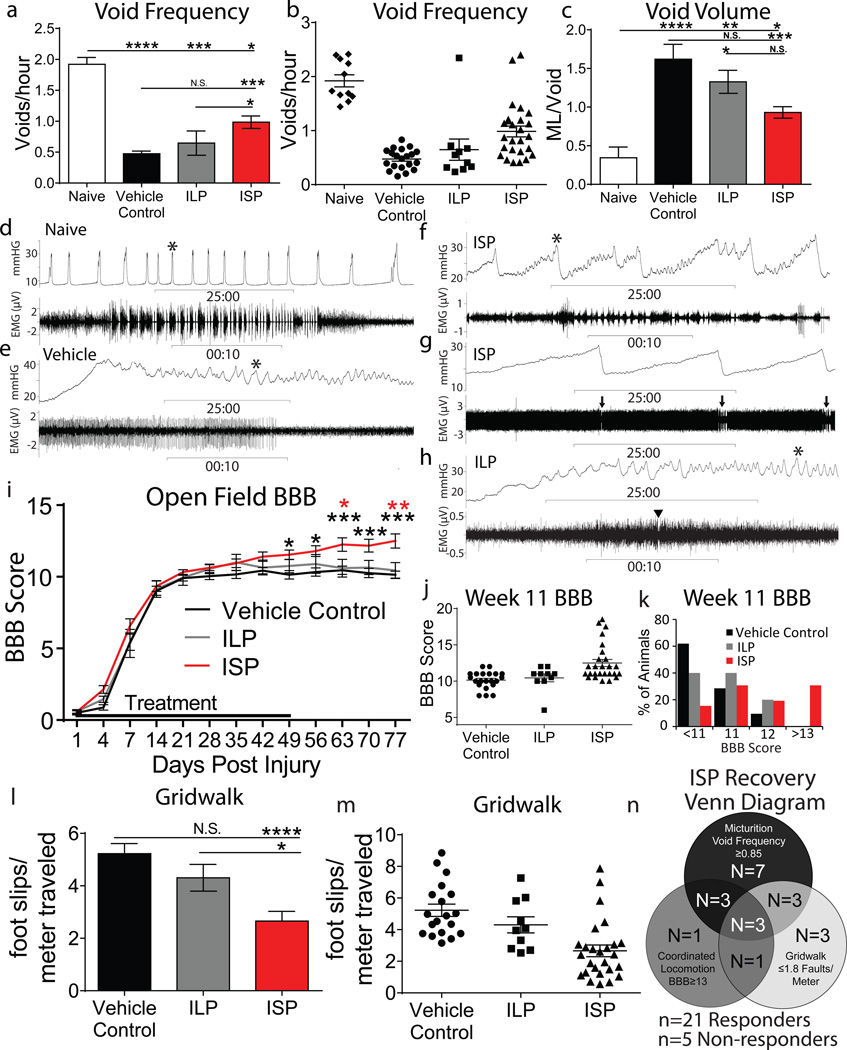
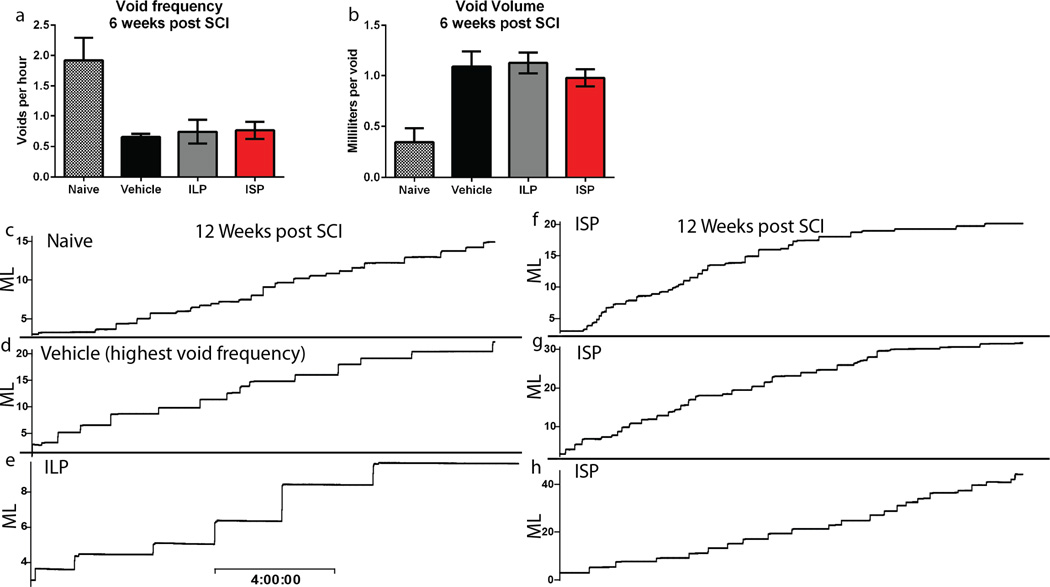
SCI disrupts connections between the bladder and brainstem micturition control center, leading to reduced void frequency and an accompanying increase in void volume (Extended Data Fig. 6a-b)24. Twelve weeks post injury, ISP promoted a significant 2 fold increase in void frequency versus controls along with a significant decrease in void volume (Fig. 3a-c, Extended Data Fig. 6c-h). We utilized urodynamics to assess whether this improvement was a result of physiologically normal bladder activity. Rats urinate by contracting the detrusor muscle, resulting in a rapid increase in bladder pressure while the external urethral sphincter (EUS) bursts phasically, expelling urine (Fig. 3d)25. No vehicle or ILP treated animals displayed multiple coordinated bursts of the EUS during a void. (Fig. 3e, h). Although the detrusor was still hyperactive, 10 of the 15 analyzed ISP treated animals recovered coordination between bladder contractions and EUS phasic bursting, suggesting reconnection of a functional circuit (Fig. 3f-g)26.
Figure 3. Functional recovery following ISP treatment.
A-C: Void frequency and average void volume at 12 weeks post SCI. D-H: Representative urodynamic recordings of detrusor activity (bladder pressure, top trace) and EUS activity (bottom trace, expanded at *). G: Full trace of EUS activity. Arrow=synchronized phasic bursting. Arrowhead=single burst. I-K: Locomotor recovery (BBB score) following SCI. L-M: Gridwalk test at 12 weeks post SCI. N: ISP functional recovery Venn diagram (21/26 ISP, 0/ 21 vehicle, 1/10 ILP). Error bars=SEM, Repeated measures two-way ANOVA, Tukey’s post hoc test (BBB); one way ANOVA, Kruskal Wallis post hoc test (gridwalk and micturition), *p<0.05, **p<0.01, ***p<0.001, ****p<0.0001, Black: ISP vs Control, Red: ISP vs. ILP.
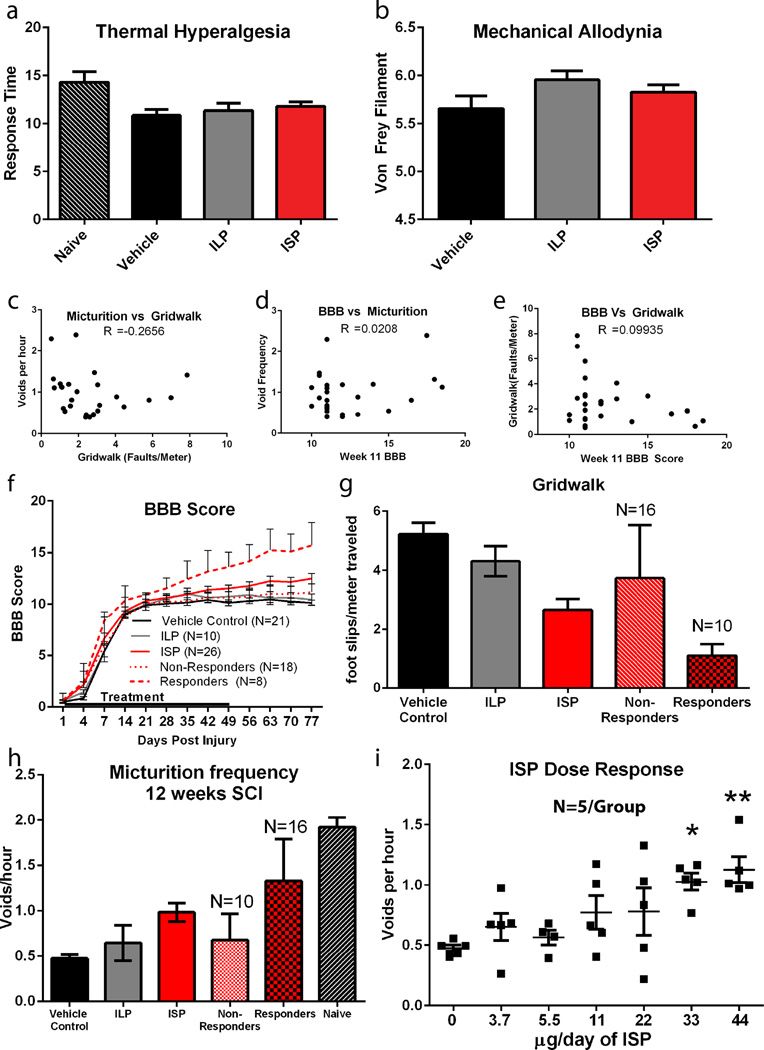
We measured locomotor recovery using the Basso, Beattie and Bresnahan (BBB) scale and a gridwalk test27. Following SCI, vehicle and ILP treated animals recovered from hindlimb paralysis at day 1 to, on average, occasional weight bearing stepping at week 11 (Fig. 3i). ISP treatment resulted in a significant progressive recovery of locomotion, which began several weeks after injury (Fig. 3i). Thirty percent of ISP treated animals (versus zero Vehicle/ILP treated) demonstrated, at least, frequent coordinated stepping (BBB≥13) with three animals achieving BBB scores ≥17.5 (Fig 3j-k). Furthermore, ISP treated animals made on average 58% fewer foot faults than control animals on the gridwalk test (Fig. 3l-m), suggesting recovery of sensorimotor coordination and balance. Importantly, aside from minor irritation at the injection site following multiple weeks of treatment, ISP did not induce neuropathic pain (Extended Data Fig 7a-b).
Interestingly, no correlation between ISP-induced recovered behaviors was observed (Extended Data Fig 7c-e). Utilizing stringent threshold analyses, we determined that 21 of 26 ISP treated animals recovered at least one behavior, with 3 animals recovering all three (Fig. 3n). Further analyses demonstrated the degree to which responding animals benefited from treatment (Extended Data Fig. 7f-h). Taken together, this suggests that the re-acquisition of each motor behavior is modular and not coincident, and may reflect anatomical differences in the pattern of axon re-innervation.
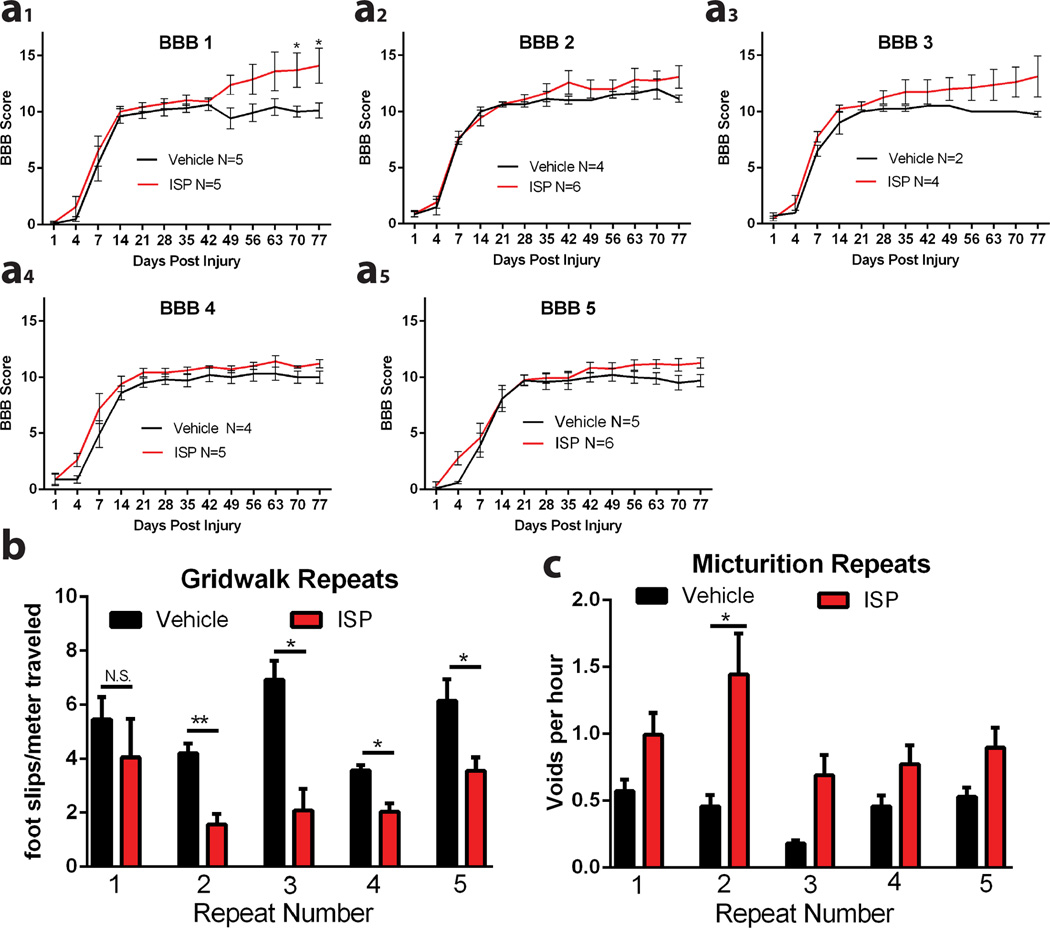
The behavioral results represent the average of 5 repetitions, each performed with newly synthesized peptide, blinded behavioral testers and a separate blinded treatment administrator. Although variability existed, ISP increased functional recovery of each behavior in all cohorts (Extended Data Fig 8). In a final group of animals, urinary, but not locomotor behaviors, responded to increasing concentrations of ISP, with our maximum (44µg/d) dose improving urination markedly in all animals (Extended Data Fig 7g). Therefore, further optimization of the dose or administrative route of ISP may lead to additional functional improvements.
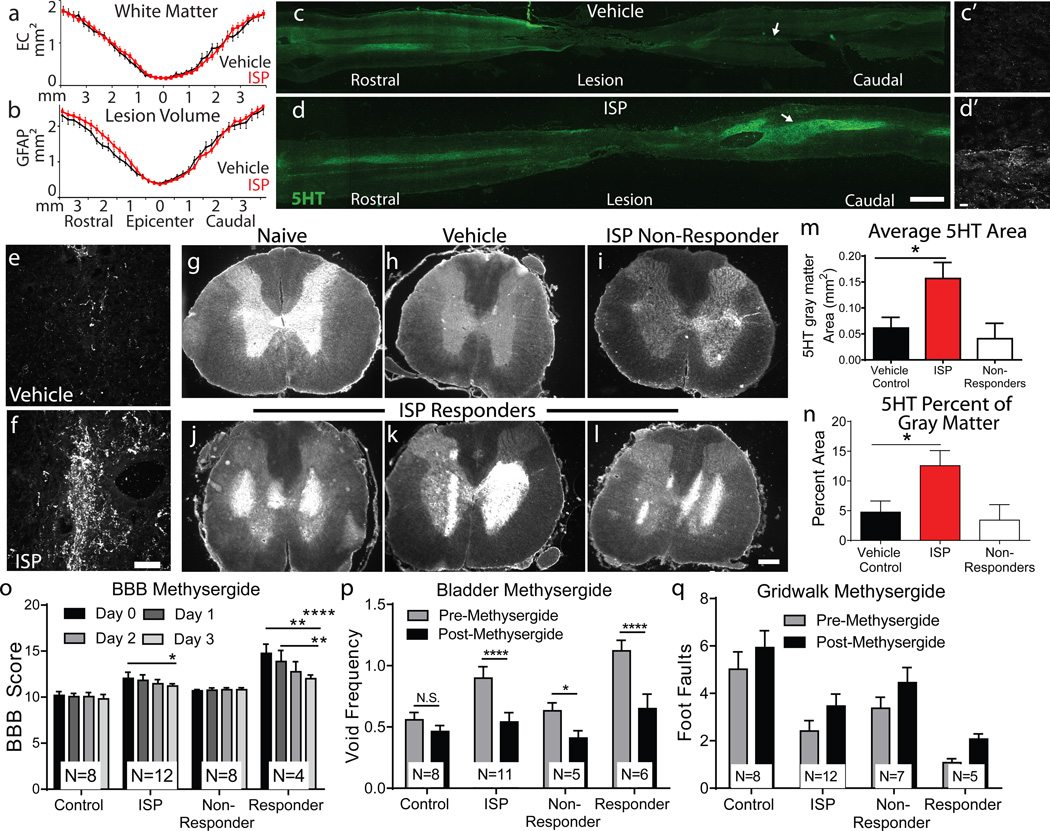
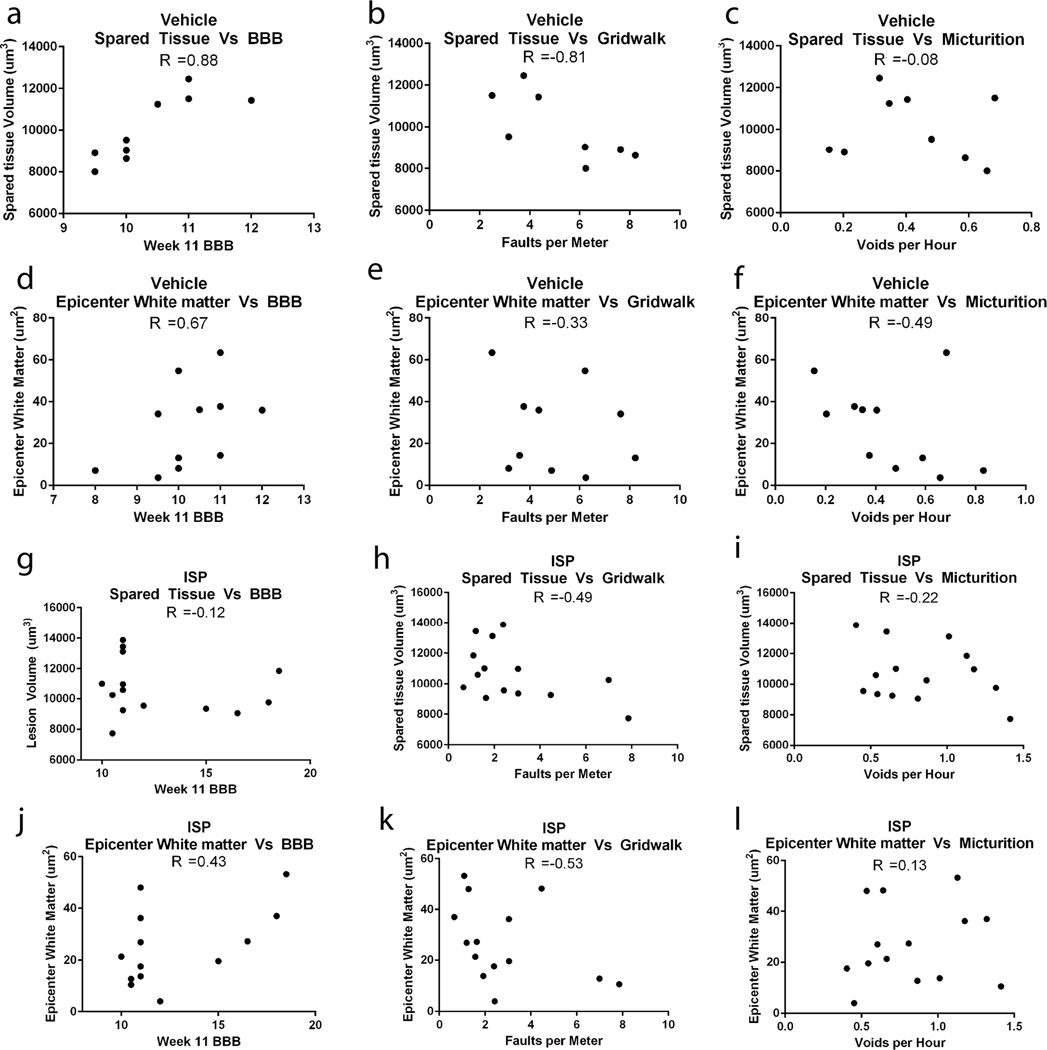
ISP treatment was not neuroprotective, as it did not lead to differences in lesion size or spared white matter (Fig. 4a-b). At the individual animal level, the variability in spared tissue correlated with functional recovery in vehicle, but not ISP treated animals (Extended Data Fig 9).
Figure 4. Anatomical changes following ISP treatment.
A-B: Average lesion size (GFAP) and spared white matter (EC) post SCI. n= 9–10 vehicle, 14 ISP. C-D: 5HT intensity in representative longitudinal spinal cord sections. Insets reveal fiber density. Scale bar 2mm, inset 20µm. E-F: Representative confocal projections of caudal 5HT fibers at L1-L3. Scale bar 20µm. G-L: 5HT intensity across lumbar coronal sections. Scale bar 500µm. M-N: Average area and percent coverage of 5HT. n= 13 vehicle, 18 ISP, t-test (two tailed), p<0.05. O-Q: Behavioral response to methysergide at 14 weeks post SCI. Responder=animal demonstrating functional recovery in each behavior. n=8 Vehicle, 11–12 ISP. Error bars=SEM. Two way repeated measures ANOVA, Tukey’s post hoc test (BBB); One way ANOVA, Kruskal Wallis post hoc test (gridwalk and void frequency), *p<0.05, **p<.01, ***p<0.001.
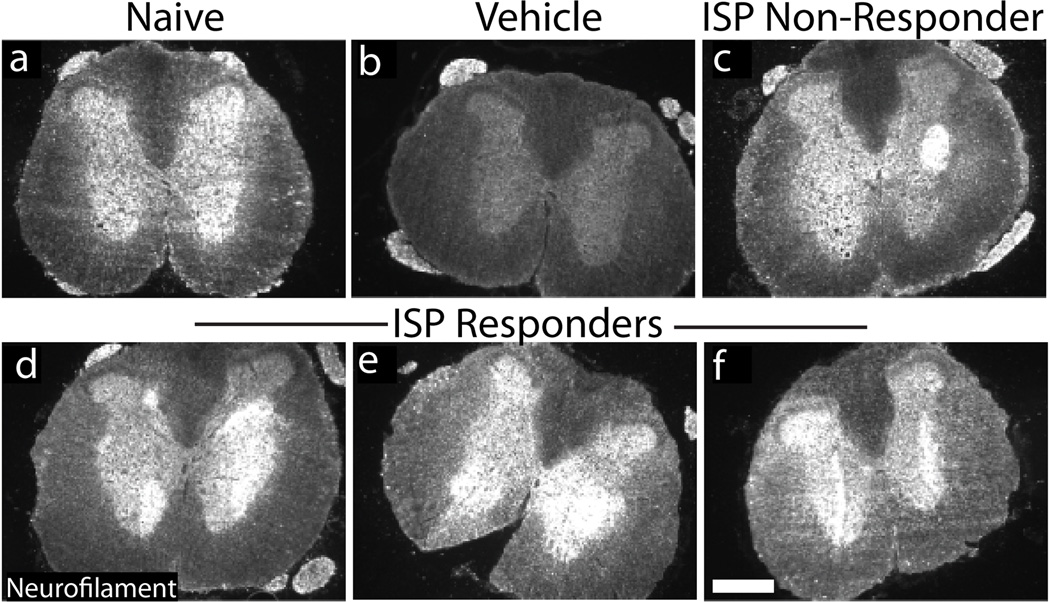
Although regenerative pathways are difficult to examine following contusive SCI28, we did not observe any lengthy regenerating BDA labeled cortico-spinal tract fibers (data not shown). We focused further analysis on the serotonergic system (5HT), neurons which express LAR family receptors and contribute to proper neuromodulatory tone in locomotion and micturition circuitry7, 26, 29, 30. Contusive SCI led to a marked decrease in descending 5HT positive fibers caudal to the lesion (Fig. 4c, e, h). In animals exhibiting functional recovery after ISP treatment, we observed unusually shaped, densely sprouted territories of 5HT below the level of the lesion (Fig. 4d, f, i-n). These patterns corresponded in part with neurofilament staining (Extended Data Fig. 10), but were not present in sections stained for GFAP, ED1, or DAPI, ensuring that the sharp edges of staining were not due to tissue folds. We speculate that physical constraints of the PNN may confine fibers in these patterns. Their spatial variability, in conjunction with differences in tract sparing from animal to animal after contusion, could partially account for the disparity in behavioral recovery between animals.
Treatment with the 5HT receptor antagonist methysergide at 14 weeks post SCI significantly reduced locomotor and urinary function in ISP treated, but not vehicle treated animals (Fig 4o-p)26, 29. This was most evident in ISP responders, animals that regained function beyond recovery thresholds. However, behavioral improvements were not fully reverted to vehicle levels and gridwalk scores were only minimally affected (Fig 4q), suggesting plasticity of other pathways outside the serotonergic system.
While CSPGs have largely been thought to act as repulsive components of the ECM, our results suggest that regenerating adult growth cones can become permanently immobilized by CSPG gradients. These observations highlight an initial cellular mechanism regulated by PTPσ that leads to the development of axonal dystrophy and the prevention of chronic regeneration and plasticity in vivo. Systemic modulation of PTPσ opens a new therapeutic avenue in non-invasive treatments for enhancing functional recovery following a variety of injuries in which proteoglycans foil the attempt of axons to regenerate or sprout.
Methods
In Vitro DRG Culture
DRG and Satellite Glia Dissociation and Culture
DRGs were harvested as previously described9. Briefly, DRGs were dissected from adult female Sprague-Dawley rats (Harlan) and incubated in a solution of collagenase II (200 U/ml, Worthington Biochemical Corporation, Lakewood, NJ) and dispase II (2.5 U/ml, Roche Diagnostics) in Ca2+/Mg2+ free Hank’s Balanced Salt Solution (HBSS-CMF, Invitrogen, Carlsbad, CA). Cells were centrifuged at 1000–2000 RPM, washed and gently triturated in HBSS-CMF three times. Dissociated DRGs were then resuspended in Neurobasal-A media supplemented with B-27, Glutamax, and penicillin/streptomycin (Invitrogen). DRGs were plated in Delta-T dishes (Fisher, Pittsburgh, PA) at a density of 800 cells/cm2 or on coverslips at a density of 1,000 cells/cm2.
Dish Preparation and Time-lapse Microscopy
Delta-T cell culture dishes were prepared as previously described31. Culture dishes were rinsed with sterile water and then coated with poly-l-lysine (0.1 mg/ml, Sigma-Aldrich, St. Louis, MO) overnight at room temperature, rinsed with sterile water, and allowed to dry. Aggrecan spot gradients were formed by allowing 2µl of aggrecan solution (2 mg/ml in HBSS-CMF, Sigma-Aldrich) to dry onto the culture surface. The surface of the dish was bathed in laminin solution (10µg/ml in HBSS-CMF, Invitrogen) for 3hr at 37°C. The laminin bath was subsequently removed and cells were plated without allowing the surface of the dish to dry. For conditions with laminin alone, the aggrecan spots were excluded from the protocol.
Prior to time-lapse imaging, adult neurons were incubated at 37°C for 4–6 d in Neurobasal-A media with either vehicle (water) or 2.5µM peptide. Neurobasal-A media with HEPES (50µM, Sigma-Aldrich) and either vehicle or 2.5µM peptide was added to the cultures prior to imaging in a heated stage apparatus. Time-lapse images were acquired every 30 s for at least 1.5hr with a Zeiss Axiovert 405M microscope using a heated 100x oil-immersion objective. Growth cones that extended normal to the spot rim were chosen for analysis. We tracked and charted the behavior of growth cones in our in vitro assay with Metamorph software. n=19 laminin, 24 control,24 ISP, 26 ISP. For delayed treatment, n=14 ISP and Ch’ase.
PTPσ concentration quantification
High magnification images of PTPσ expression (R&D Systems, 1:100) in growth cones, either motile on uniform substrates of laminin (5µg/ml) or dystrophic within the CSPG gradient were analyzed with ImageJ. Both the growth cone and axon were manually traced and the mean pixel intensity was calculated. All images were taken using identical settings.
CSPG Gradient Crossing Assay
CSPG gradients were prepared as described previously9. Glass coverslips (1.6 mm, Fisher Sci, Pittsburgh, PA) coated with poly-l-lysine and nitrocellulose were spotted with a 2µl solution of aggrecan (0.7mg/ml) and laminin (5µg/ml) in HBSS-CMF (4 spots/coverslip). After the spots were allowed to dry, the coverslips were incubated with laminin (5µg/ml) in HBSS-CMF at 37°C for 3 h. Dissociated DRG neurons were plated at a density of 1,000 cells/cm2 in Neurobasal-A supplemented with B27, Glutamax and penicillin/streptomycin and incubated for 5 d at 37°C. For peptide experiments, appropriate concentrations of peptide were added to the media at the time of plating. For ChABC experiments, 0.1 U/ml ChABC (Seikagaku, Tokyo, Japan) was added to coverslips for 2h after the laminin bath prior to cell plating.
At 5 d, cultures were fixed in 4% paraformaldehyde in PBS for 30 min. After several rinses in PBS, the coverslips were incubated in blocking solution (5% normal goat serum or normal donkey serum, 0.1% BSA, and with or without 0.1% Triton X-100 in PBS) for 1 h at room temperature and then incubated overnight at 4°C in primary antibody. Anti-βIII-tubulin (1:500; Sigma-Aldrich), anti-CS56 (1:500; Sigma-Aldrich), anti-PTPσ (1:100, R&D systems, Minneapolis, MN), anti-GFP (1:500, Invitrogen), anti-S100 (1:1000, Sigma-Aldrich), anti-GFAP (1:5000, DAKO, Carpinteria, CA), anti-Nogo Receptor (1:100, Millipore, Billerica, MA) and anti-LAR (1:100, Santa Cruz, Santa Cruz, CA) were used as primary antibodies. Coverslips were rinsed several times in PBS and then incubated in the appropriate secondary antibody (Molecular Probes, Eugene, OR) overnight at 4°C. Coverslips were rinsed with PBS again, and mounted on glass slides in Citifluor (Ted Pella) mounting medium. Specimens were examined using a Leitz Orthoplan 2 fluorescence microscope.
Wedge Identification
The intracellular domains of rat PTPσ (PDB-2FH7) and human LAR (PDB-1RPM) were visualized using UCSF Chimera 1.6.1. The wedge domains of human, rat and mouse PTPσ and PTPδ were identified by BLAST alignment with the known wedge domain of LAR14.
Peptide Preparation
Peptides were synthesized commercially with C-terminal amidation (Genscript, Piscataway, NJ), and purity was assessed as >98% by mass spectrometry. Lyophilized peptides were dissolved in sterile water and stored at −80°C until use. Peptide sequences are as follows:
-
ISP- NH2-GRKKRRQRRRCDMAEHMERLKANDSLKLSQEYESI-NH2,
H’ISP- NH2-GRKKRRQRRRCDMAEHTERLKANDSLKLSQEYESI-NH2
ISP-no-TAT- NH2-DMAEHMERLKANDSLKLSQEYESI-NH2,
ILP- NH2-GRKKRRQRRRCDLADNIERLKANDGLKFSQEYESI-NH2,
IDP- NH2-GRKKRRQRRRCELADHIERLKANDNLKFSQEYESI-NH2
IMP- NH2-DLLQHITQMKCAEGYGFKEEYESGRKKRRQRRRC-NH2
Scrambled ISP- NH2-GRKKRRQRRRCIREDDSLMLYALAQEKKESNMHES-NH2
TAT- NH2-GRKKRRQRRRC-NH2
Quantification
All quantification was done blind. The number of βIII-tubulin positive axons crossing the CSPG gradient (visualized using the CS56 antigen) was counted and divided by the total number of neuronal cell bodies contained within each gradient. Each gradient was counted as an individual data point. n=112 control, 43 Ch’ase, 20 S’ISP, 57 ILP, 18 H’ISP, 18 IDP, 16 IMP, 16 ISP no TAT, 16 TAT. For ISP, n [µm]= 16 [10], 16 [5]. 34 [2.5]. 49 [1.25], 27 [0.625, 0.25, 0.025, 0.0025].
For analysis of PTPσ concentration, PTPσ stained neuronal growth cones and axons either entering the gradient or growing on uniform laminin were manually traced using ImageJ and the average pixel intensity was calculated.
Astrocyte Preparation
Astrocytes were harvested from postnatal day 0/1 (P0/1) rat cortex as previously described31. Cortices were finely minced and treated with 0.5% trypsin in EDTA. Cells were plated in DMEM/F12 (Invitrogen) with 10% FBS (Sigma-Aldrich) and 2mM Glutamax on T75 flasks coated with poly-l-lysine and shaken to remove non-adherent cells. Astrocytes were allowed to mature in culture for at least 4 w, and used within 2 w of maturity. Astrocytes were harvested with trypsin and plated at a density of 12,500 cells/cm2.
Adhesion Assay
Poly-l-lysine coated glass coverslips were uniformly coated with a mixture of aggrecan (25µg/ml) and laminin (1µg/ml) for 3h at 37°C. DRG neurons were plated on coverslips (as described above) and incubated for 5d at 37°C. Cultures were then removed from the incubator and placed on a rotary shaker for 15 min at 80 rpm. Control coverslips were removed from the incubator, but not placed on the shaker. After shaking, the supernatants were immediately collected, centrifuged, re-suspended in 20µl Neurobasal-A media, and placed on ice. The number of neurons released from each coverslip was counted with a hemocytometer. Coverslips were carefully fixed with 4% paraformaldehyde and stained for βIII-tubulin to visualize remaining neurons and axons (as described above). n= 28 Control and ILP, 16 ISP.
DNA Constructs and Electroporation
mPTPσ in pECFP-N1 was a kind gift from Dr. Ann Marie Craig (University of British Columbia, Vancouver, British Columbia). Full length mouse PTPσ with four fibronectin domains (BC052462) was subcloned into pEF1α-AcGFP1-N1 (Clontech) between NheI and HindIII. pEF1α-mPTPsigma-AcGFP1-N1 was electroporated into adult DRG neurons with the Amaxa Rat Neuron Nucleofector Kit (Lonza) using manufacturer’s instructions.
PTPσ Pulldown
Biotinylated Peptide Pulldown
For pulldown experiments, we used the Pierce Pull-Down Biotinylated Protein:Protein Interaction Kit (Thermo Scientific 21115). 100µg/ml of biotinylated-peptide (Genscript) was incubated overnight on an orbital shaker at 4°C with streptavidin beads. Following incubation, extra biotin was added and allowed to incubate overnight to ensure the binding of all streptavidin. After three washes with TBS, either recombinant GST tagged-PTPσ ICD (D1/D2-500ng, Sigma, D1 500ng, Abcam), spinal cord lysate from either wild type or PTPσ null mice, or brain lysate from an adult female Sprague Dawley rat. Neural tissue was quickly extracted and flash frozen with liquid nitrogen. The tissue was homogenized in Tissue Homogenization Buffer (20mM Tris, 0.5mM EDTA, 0.5mM EGTA and 8% Sucrose, pH 7.4) and 1:500 Protease inhibitor cocktail (Abcam) on ice. The lysate was centrifuged at 13,000 rpm for 20 min before addition to the beads. 150µl of each lysate was added to the beads and allowed to incubate overnight at 4°C. Following three washes, beads were incubated with elution buffer for 10 minutes at room temperature. Beads were then centrifuged at 12,000 rpm to collect eluted lysate.
SDS Page and Western Blot
30 µl of the pulldown material with 4x Laemmli Buffer was boiled for 10 min at 100°C and loaded into 7.5% TBX Mini-Protean Gels (Bio-Rad 456-1029) with Bio-Rad Precision Plus Protein Standard (Bio Rad 161-0374). The gel was run for about 1.5 h at 100V in 1x Tris Glycine SDS Buffer. Gels were stained with Sypro Ruby Red (Sigma-Aldrich) to visualize proteins within the gel. Transfer occurred overnight at 15 V using a PVDF membrane. We blocked at least 2 h in 5% Milk powder, 0.1% Tween-20 before overnight incubation with an antibody against GST (Cell Signaling, Danvers, MA), PTPσ ICD (1:100 Abnova, Taiwan ) PTPσ ECD (1:1,000 Abcam) anti Nogo Receptor (1:500, Millipore) or anti LAR (1:1,000 R&D Systems). We washed 5×5 minutes in 1× PBS-0.1% Tween-20 before blocking overnight with an HRP-conjugated secondary (1:1,000). The blot was developed using a chemiluminescence substrate (Thermo Sci) following 5×5 1× PBS – 0.1% Tween-20 washes. All experiments were repeated >3 times.
CSPG Signaling
Plating SH-SY5Y cells on laminin and CSPG substrates
The SH-SY5Y neuronal cell line (ATCC) was grown in Hyclone Dulbecco’s modified Eagle’s high glucose media (GE Healthcare Life Sciences, SH-30081.02) supplemented with 4mM L-glutamine, 1mM sodium pyruvate, 1% penicillin/streptomycin/neomycin (PSN) and 10% heat-inactivated fetal bovine serum (Invitrogen). SH-SY5Y cells were plated at an initial density of 12,000 cells/cm2 onto tissue culture surfaces for four days under different conditions including 1) Laminin, 2) Laminin + CSPG, 3) Laminin + CSPGs pretreated with chondroitinase ABC (ChABC), 4) Laminin + ISP in the media, 5) Laminin + CSPG + ISP in the media. Tissue culture dishes were coated with laminin (2µg/ml, Sigma, L2020) and/or CSPG (15µg/ml, Millipore, cc117) for 3 hours at room temperature. Of note, CSPGs used in this study contained a mixture of neurocan, phosphacan, versican, and aggrecan. Where appropriate, ChABC (0.1 U/ml Sigma, C3667-10UN) was added with laminin + CSPG mixture to tissue culture surfaces for 1h and incubated at 37°C during coating and prior to cell plating. In ISP condition, cells were pretreated with ISP (2.5µM) for 30 min.
Immunoblotting
Cells were harvested from culture plates 4 days following cell plating and homogenized in RIPA buffer (Thermo Fisher) containing SigmaFast Protease Inhibitor (Sigma). A total of 30–50µg protein was loaded into the gel and then transferred to a nitrocellulose membrane (Bio-Rad). The membranes were then blocked in 5% non-fat milk in Tween Tris Buffered Saline (TBST) for 1h and incubated overnight at 4°C with P-p44/42 MAPK (Cell Signaling, Rabbit 1:500) diluted in the blocking solution. The membranes were washed and incubated with HRP-conjugated goat anti-rabbit antibodies (1:4000, Biorad). Membranes were then incubated in ECL plus immunoblotting detection reagents (Thermo Scientific Pierce) according to the manufacturer's specifications. Blots were then stripped of their primary and secondary antibodies for 30 min in 0.2M NaOH and re-probed with primary antibody p44/42 MAPK (Erk1/2) (Cell Signaling, Rabbit 1:1000) overnight followed by incubation with secondary antibody and ECL.
Quantification
Immunoreactive bands were quantified using AlphaEaseFC (FluorChem, 8900). The ratio of phosphorylated p-Erk1/2 to t-Erk1/2 for each condition was calculated. Data are reported as means ± SEM, and p ≤ 0.05 was considered significant. Statistical analyses of intensity measurements were tested by one-way ANOVA comparing conditions followed by post hoc pairwise multiple-comparison testing by the Holm–Sidak method.
Animals and Contusive Spinal Cord Injury
Animals
Adult female Sprague-Dawley rats (225–250g) were obtained from Harlan. All procedures were approved by the Institutional Animal Care and Use Committees. PTPσ null mice were a generous gift of Dr. Michael Tremblay (McGill University, Montreal, Quebec). All PTPσ null experiments were performed in collaboration with Dr. Yingjie Shen (The Ohio State University, Columbus, OH).
Contusive Spinal Cord Injury
Briefly, adult female Sprague Dawley rats (230–250g) were obtained from Harlan and acclimated to the animal resource center, behavior analysis chambers, and handlers. Rats were injected intraperitoneally with ketamine (60 mg/kg) and xylazine (10 mg/kg). The musculature was cut from T7-T9 and the dorsal surface of T8 was exposed by laminectomy. The vertebral column was stabilized by clamping the T7 and T9 vertebral bodies with forceps fixed to the base of an Infinite Horizon Impact Device. The animals were situated on the platform, and the 2.5mm stainless steel impactor tip was positioned over the midpoint of T8 and impacted with 250 kDyne force. The overlying musculature was closed using suture, the skin was closed using wound clips and the animals were treated with Marcaine at the incision site. The force/displacement graph was used to monitor impact consistency and any animals that exhibited an abnormal impact graph or greater than 10% deviation from 250 kDyne were immediately excluded from the study.
Following surgery, pain was monitored and animals were treated with intramuscular Buprenorphine at signs of discomfort. In addition, manual bladder expression was performed 2–3 times daily for two-three weeks until a voiding reflex returned and animals could leak urine. 5 vehicle animals and two ILP animals were removed from the study and euthanized due to bladder infections and other serious ailments. One ISP treated animal was removed due to a bladder stone.
Dorsal Column Crush Injury
Dorsal column crush was performed similar to methods performed previously31. Rats were anesthetized with inhaled isoflurane gas (2%) for all surgical procedures. A T1 laminectomy was performed to expose the dorsal aspect of the C8 spinal cord segment. Durotomies were made bilaterally 0.75mm from midline with a 30 gauge needle. A dorsal column crush lesion was then made by inserting Dumont no. 3 jeweler’s forceps into the dorsal spinal cord at C8 to a depth of 1.0mm and squeezing the forceps, holding pressure for 10s and repeating two additional times. The muscle layers were sutured with 4–0 nylon suture, and the skin was closed with surgical staples. Animals were perfused at 14d post injury.
Systemic Peptide Treatment
All randomization and peptide treatments were prepared by a blinded lab member not associated with behavioral analyses. First, a vehicle solution of 1.25ml DMSO in 23.75ml sterile saline was prepared for each animal. Next, appropriate peptide was added to each of the vehicle solutions where applicable so that the final peptide concentration of each solution was 5µM. Each drug solution was then aliquotted into 50 individual 1.5 ml Eppendorf tubes, each corresponding to a single animal’s daily dose, and frozen at −20°C. All peptides were randomized and blinded to both the animal treatment administrator and separate behavioral analyzer. At 24 h post SCI and each morning thereafter for 49 consecutive days, animals were given a 500µl sub-cutaneous injection of the appropriate blinded treatment into the back above the lesion (n = 21 vehicle, n = 26 ISP, n = 10 ILP) This experiment was carried out with 5 different cohorts of animals, with freshly synthesized peptide validated in vitro using the CSPG gradient assay and prepared for each cohort of animals. ILP treatments were only performed in the first and last cohort because we did not observe behavioral improvement with ILP treatment.
For the dose response, additional injured animals (N=5/group, cohort 4) were injected with 1/3× ISP (3.6µg/day), 1/2× ISP (5.5µg/day), 2× ISP (22µg/day) 3× ISP (33µg/day) or 4× ISP (44µg/day).
FITC-ISP Peptide Tracking
FITC-ISP was synthesized by Genscript with FITC conjugated to the N-terminus TAT domain. A single 500µl injection of either 10µM FITC-ISP in 5% DMSO+Saline or vehicle was given to animals subcutaneously into the back. At 1 h post-injection, spinal cords were immediately removed and snap frozen. 20µm thick coronal sections of unfixed spinal cord tissue was collected on a cryostat and immediately imaged on a Leitz Orthoplan 2 fluorescence microscope.
Methysergide
A subset of ISP and vehicle treated animals were injected with methysergide (5 mg/kg, Sigma-Aldrich) intraperitoneal once a day for 3 d at 14 w post SCI (n = 8 vehicle, n = 12 ISP). Gridwalk and metabolic cage analyses were performed on days 0 and day 3, while BBB scoring was conducted daily. In addition to the full population, the animals whose behavior started above or below a threshold level of two standard deviations above vehicle mean (see Fig. 4F) were plotted separately as responding and non-responding.
Behavioral analysis
Open Field BBB
All behavior analyses were conducted by two blinded observers separate from the researcher performing the daily dosing. Each animal was tested on days 1, 4, 7 and weekly thereafter through week 11. Animals were allowed to freely roam on an open field while being observed by two Ohio State Spinal Cord Injury course expertly trained observers and scored according to the BBB guidelines27. Any animal with a BBB score of greater than 1 at day 1 was removed from the study. Data was quantified as the average of the two hind limbs, compiled, and graphed.
Gridwalk
The gridwalk test was performed at 12w post SCI. Animals were allowed to freely roam on a 75cm×40cm raised grid (2.5mm thick wires, 2cm gaps between wires) for 5 min while their progress was tracked with an overhead camera and quantified as total distance traveled (Ethovision). Foot faults were counted manually by a blinded observer and quantified as total number of hindlimb faults/meter.
Thermal Hyperalgesia
Hyperalgesia analysis was performed at 12 w post injury by a blinded observer as published previously32. Animals were given 30 min to acclimate to the plexiglass cage prior to testing (Ugo Basile. Comerio VA – Italy). The IR source (Intensity = 58) was carefully placed under each hindpaw. Time to withdrawal was recorded as an average of 5 trials on each paw, with the longest and shortest time removed.
Mechanical Allodynia
The Von Frey hair protocol for the hind paw was adapted from the Ohio State University Spinal Cord Injury Program. Briefly, animals satisfying the weight-bearing criteria were acclimated to the Von Frey testing boxes for at least 15 min. A total of 10 trials were performed starting with the 5.18 monofilament while animals were distracted with a treat. The monofilament was tested on the plantar surface of the center of the paw between the foot pads. A positive response was recorded if an animal withdrew its paw when the monofilament was presented. At least 30 seconds elapsed between each trial for the same hind paw. Positive responses led us to test with progressively smaller monofilaments. Conversely, negative responses led us to test with progressively larger monofilaments until monofilament 6.10. The threshold value was defined as the lowest monofilament level at which 50% or more of the trials resulted in a positive withdrawal.
Metabolic Cage Micturition Analysis
At 6w and 12w after SCI, animals were placed in a metabolic cage (Braintree Scientific, Braintree, MA) for measurement of voiding patterns. The voided urine was measured continuously via a force transducer/strain gauge (Grass Technologies, Warwick, RI) and plotted in Spike2 (Cambridge Electrical Design, sampled at 20Hz). Animals were kept in this cage for 16h with ample water and food during the period of urine collection and measurement. The criteria for the micturition pattern analysis included void frequency (voids / hr) and the void volume (ml / void). The total volume of expelled urine was not included because of variations in water intake between individual animals. n=11 naïve.
Urodynamics
Terminal urodynamic recordings were performed similar to Cheng et al, 200433. Briefly, rats were anaesthetized at 14 w post SCI with 0.8 g/kg urethane delivered subcutaneously. A polyethylene-50 catheter was carefully inserted through the urethra into the bladder for delivery of saline. Fine wire electrodes (0.003” diameter Teflon-insulated silver wire, A-M Systems) were inserted percutaneously via the vagina on both sides of the urethra to monitor the EUS electromyography (EMG) activity. The electrodes were connected to a preamplifier (HZP; Grass-Technologies), which was connected to an amplifier (Grass-Technologies) with low and high-pass frequency filters at 30Hz and 3kHz respectively, and signal was sampled at a rate of 10 kHz (Power 1401, Spike2; Cambridge Electronic Design). Continuous cystometrograms (CMGs) were collected using constant infusion (6 ml/h) of room temperature saline (Aladdin-1000 single syringe infusion pump; World Precision Instruments) through the catheter into the bladder to elicit repetitive voids. The bladder pressure was recorded via the same catheter used for saline infusion, using a pressure transducer (GrassTechnologies) connected to the recording system and sampled at a frequency of 2kHz. Animals that received methysergide did not receive urodynamic analysis. n=11 vehicle, 15 ISP, 6 ILP.
Immunocytochemistry and Tracing
Perfusion and Sectioning
To obtain spinal cord sections, rats were transcardially perfused with ice-cold 4% paraformaldehyde in PBS, and the spinal cords were dissected out. After the tissue was postfixed in 4% paraformaldehyde overnight at 4°C and cryoprotected with 30% sucrose, spinal cords were frozen in OCT mounting media and sectioned on a Hacker cryostat at a thickness of 20µm.
Immunocytochemistry
Mounted sections were washed three times with PBS followed by blocking in 5% normal goat serum (NGS) and 0.1% bovine serum albumin (BSA) in PBS. 0.1% Triton X-100 was added to the blocking buffer depending on the antigen used. Following blocking, sections were incubated in primary antibody diluted in blocking buffer overnight at 4° C. Primary antibodies used were mouse anti-NeuN (1:100, Chemicon), anti-GFAP (1:1,000, Dako), mouse anti-ED1 (Chemicon, 1:100) rabbit anti-5-HT (1:500, Immunostar, Hudson, WI), and anti-Neurofilment (1:500, Sigma-Aldrich). For in vivo PTPσ staining, sagittal 20µM sections encompassing both rostral and caudal to the lesion were probed with anti-PTPσ antibody (1:500, Abnova). The next day, the sections were washed extensively with PBS and incubated in the appropriate secondary antibody or avidin substrate conjugated to Alexafluor 488, 594, or 633 (1:500, Molecular Probes) overnight. After extensive washing, the sections were stained with DAPI (1:1,500 in PBS, Sigma-Aldrich), washed, coverslipped, and viewed with a confocal microscope (Zeiss, Germany). Pixel intensity was measured on images taken on a standard fluorescent microscope (Leica, Germany) with a uniform exposure setting and analyzed using ImageJ.
White Matter Analysis
Spared white matter analysis was conducted by Eriochrome cyanine (EC) staining as previously published34. Briefly, room temperature 20µm sections were placed in fresh acetone for 10 min, removed and allowed to dry for 30 min. Sections were stained with freshly filtered EC solution (Sigma-Aldrich) for 30 min and washed in running tap water for 5 min. The stain was differentiated in 5% ferric ammonium sulfate (Sigma-Aldrich) for 15 min and again washed with running tap water for 5 min. The differentiation was completed with borax-ferricyanide solution (Sigma-Aldrich) for 10 min, briefly washed with running tap water and allowed to dry. Slides were dehydrated in 70%, 95%, and 100% ethanol for 2 min each followed by xylene for 2 min. Slides were coverslipped with a VectaMount Permanent Mounting Medium (Vector Laboratories). n=10 vehicle, 14 ISP.
Lesion Volume
Spinal cord sections stained with GFAP were analyzed for lesion volume. After staining, sections were digitalized with a Leica SCN 400 Slide Scanner. Fifteen 20µm coronal sections (one of every 10 serial sections was stained, 200µm between sections) both rostral and caudal of lesion epicenter were analyzed for a total of 6mm of spinal tissue. Sections were traced in ImageJ for volume calculation. n=9 vehicle, 14 ISP.
5HT Analyses
Coronal sections of lumbar spinal cord were analyzed for 5HT intensity. The staining and imaging settings were uniform for all images. High exposure settings were used to maximize the signal to noise ratio, allowing for large patterns of 5HT expression to be visualized. ImageJ threshold analysis was utilized to eliminate all background from each section, leaving only the patterns of 5HT expression. The area of innervation and percent coverage of the gray matter was identified by analyzing all particles in the gray matter at threshold intensity. Eight 20µm sections, (corresponding to 1.6mm of lumbar tissue) were analyzed in ImageJ and averaged, with the highest and lowest intensity removed. n=13 vehicle, 18 ISP.
Tracing
Cortical spinal tract labeling was performed as published previously35. 10% Biotinylated Dextran Amine (BDA, Molecular Probes) was injected into 16 locations in the rat motor cortex at 12w post injury. Animals were sacrificed 2 w after labeling. BDA labeling was visualized using an avidin–biotin peroxidase incubation followed by diaminobenzidine and H2O2 (Vector Labs).
Statistical Analysis
All statistical analyses were performed using Graphpad Prism. All results are presented as mean + SEM. Sample sizes were initially determined using statistical software to calculate the minimum total required number of animals or assays. All reported groups are above the minimum calculated sample size.
In Vitro
For PTPσ intensity measurements, gradient crossings, and adhesion assays, all statistical analysis was performed via one way ANOVA between all groups in each individual experiment.
In Vivo
For void frequency, void volume and gridwalk data sets, D’Agostino-Pearson and Shapiro-Wilk tests were first performed to determine if any individual data set abided to a normal, Gaussian distribution. Naïve, vehicle control and ILP all passed the normality test, while ISP failed in all. Next, we performed ROUT analysis to identify outliers. No values were excluded from analysis, although a single ILP void frequency data point was identified as an outlier. Statistical analysis on these behaviors was performed with a one way ANOVA and post hoc Kruskal-Wallis test.
For BBB, we performed a repeated measures two way ANOVA to compare Vehicle, ILP, and ISP. No normality tests were performed because BBB is a non-linear scale. Post hoc analysis at individual time point was performed with Tukey’s test (black=ISP vs Vehicle, red=ISP vs ILP).
Following methysergide treatment, BBB analysis was performed via repeated measures two way ANOVA. For both gridwalk and void frequency, we compared pre-methysergide to post-methysergide with a two-way ANOVA. The analysis between responding and non-responding animals was performed separately.
Anatomy
5HT area and percent gray matter coverage, the average value over the 8 lumbar sections of ISP and vehicle control were compared with a T-Test.
Regression Analysis
Regression analysis was performed by creation of matrix of behavioral and anatomical scores for each animal. A separate matrix was created for Vehicle and ISP treatment. Regression values (R=) were identified by comparing two individual variables. The Pearson or Spearman coefficients were identified for parametric and non-parametric data sets, respectively.
Extended Data
Extended Data Figure 1. CSPG receptors in vitro and PTPσ in vivo LAR and Nogo receptors in growth cones.
A: LAR expression in motile (left, on laminin) and immobilized (right, within CSPG gradient) growth cones. B: Nogo receptors in a soma and axons. Scale Bars= 20µm. C-D: PTPσ expression in the spinal cord 14 days following dorsal column crush injury. The arrowhead represents a labeled structure with dystrophic morphology. Scale Bar=50µm.
Extended Data Figure 2. LAR structure, sequence alignment and pulldown analysis.
A: BLAST alignment of the known sequences of mouse, rat and human LAR, PTPσ, PTPδ and PTPµ. The wedge domain of each protein is aligned within the box. B: The tandem intracellular phosphatase domains of human LAR with the previously characterized wedge domain (red)14. C-D: Pulldown of recombinant PTPσ with biotinylated ISP or ILP. E-F: Eluted lysate following pulldown was probed with antibodies against either LAR or pan-Nogo receptors. Input is 10% lysate control.
Extended Data Figure 3. Astrocyte and satellite cell response to ISP and the adhesion assay.
A: Purified GFAP positive mature astrocytes (green) did not respond to ISP. B: S100 positive satellite glia were able to cross the gradient of CSPG after ISP treatment. Scale bar = 50µm. C-D: Response of neurons and axons upon a CSPG rich substrate to agitation following ISP treatment. Scale bar= 50µm.
Extended Data Figure 4. CSPG and ISP regulation of Erk1/2.
Western blot analysis revealed a significant decrease in the phosphorylation ratio of Erk1/2 in SH-SY5Y cells plated on laminin (2µg/ml) + CSPGs (15µg/ml) compared to laminin only substrates which was reversed by either pre-treatment with ChABC (0.1 U/ml) or 4d ISP treatment (2.5µM). Data normalized to laminin control. N= 4 independent experiments. One way ANOVA, Tukey’s post hoc test, * <0.05 vs all other conditions.
Extended Data Figure 5. FITC-ISP in vivo and Infinite Horizon Impaction.
A-B: Spinal cord 1hr following subcutaneous injections of FITC ISP or vehicle. Scale Bar=100uM. C: Experimental design and timeline for in vivo experiment. D-E: The force and impaction velocity of all animals that received an Infinite Horizon contusive injury. All impactions are within 10% from the target force of 250 kDyne, with an average force of 258.2 for both ISP and Vehicle.
Extended Data Figure 6. Metabolic cage analysis at 6 w post injury.
A-B: Void frequency and average void volume at 6w post injury. n = 11 naïve, 21 vehicle, 10 ILP and 26 ISP. C-H: Representative smoothed metabolic cage traces of a normal animal (C) and 5 treated animals (D-vehicle, E-ILP and F-H, ISP) 12 w post injury. Void volume is plotted (in ml) as a function of time, scale bar = 4h.
Extended Data Figure 7. Thermal hyperalgesia, mechanical allodynia, correlation, responder/non-responder and dose response.
A-B: Average response to thermal (Hargrave’s test) and mechanical (Von Frey Test) stimuli at 12 weeks post (n = 11 naïve, 21 vehicle, 10 ILP and 26 ISP for thermal, n = 10 vehicle, 4 ILP and 10 ISP for mechanical). C-E: Correlations between recovery of each individual motor behavior in the ISP treatment group. F-H: For each behavior, the ISP treated animals that recovered to two standard deviations relative to vehicle mean were separated and plotted as “responders” while those that didn’t were plotted as “non-responders”. The n for the responding and non-responding group of each behavior is listed on the graph. I: An in vivo ISP dose response in a single cohort of animals. A dose-dependent increase occurred in void frequency at 12 weeks post SCI.
Extended Data Figure 8. 5 Repetitions of in vivo experiments.
A-C: The individual results of five repeats of in vivo experiments are plotted as individual cohorts of animals for BBB, Gridwalk and Void Frequency. Repeated measures two way ANOVA, Tukey’s post hoc test (BBB); one way ANOVA, Kruskal Wallis post hoc test (gridwalk and void frequency), *p<0.05, **p<0.01, ***p<0.001, ****p<0.0001, Black- ISP vs. Control, Red- ISP vs. ILP. n for each is listed.
Extended Data Figure 9. Correlation between spared tissue and behavioral recovery.
Spared tissue volume (as measured by GFAP positive tissue) or area of spared white matter at the epicenter (as measured by Eriochrome cyanine staining) were plotted against behavioral scores for vehicle (A-F) and ISP (G-L) treated animals. Pearson’s correlation coefficient (r value) is reported for each comparison. Only animals whose spinal cord was processed and cut coronally were included in the analysis.
Extended Data Figure 10. Neurofilament staining at lumbar levels.
A-F: Representative caudal neurofilament expression in lumbar spinal cord. Responders= ISP animals that demonstrated functional improvement (see fig. 3n). All images were taken using identical settings. Scale bar= 500µm.
Supplementary Material
Acknowledgments
This work was supported by NINDS NS025713 (JS); Case Western Reserve University Council to Advance Human Health (CAHH), Mr. Poon Jing, Richard Sr. and Mrs. Suzanne Poon, Unite to Fight Paralysis, The Brumagin Memorial Fund, Spinal Cord Injury Sucks (SCIS), United Paralysis Foundation and The Kaneko Family Fund.
The authors thank John Flanagan (Harvard University, Cambridge, MA), Murray Blackmore (Marquette University, Milwaukee WI), Angela Filous and Susann Brady-Kalnay (Case Western Reserve University, Cleveland, OH), and Ryan Gardner and Beth Habecker (Oregon Health & Science University, Portland, OR) for their valuable discussion and input into the project.
Footnotes
Conflict of Interests: Preliminary patent application 61/621,623 for ISP
Author Contributions: B.T.L performed all in vitro experiments, time-lapse microscopy, ISP treatments, immunohistochemistry and data quantification. B.T.L, J.M.C. and Y.L.W designed the peptides. M.A.D. and AT performed all surgical procedures. B.T.L, M.A.D., K.M.M., and A.T. performed behavioral testing. A.T., B.P.B. and K.X. helped perform the pull-downs. S.M.D. and S. K.-A. performed the CSPG signaling experiments. Y.S., S.K, S.L. and S.A.B. contributed to experimental design and figure preparation. B.T.L. and J.S designed all studies, analyzed the data and wrote the paper. All authors discussed and helped prepare the manuscript.
References
- 1.Cregg JM, et al. Functional regeneration beyond the glial scar. Exp Neurol. 2014;253:197–207. doi: 10.1016/j.expneurol.2013.12.024. [DOI] [PMC free article] [PubMed] [Google Scholar]
- 2.Andrews EM, Richards RJ, Yin FQ, Viapiano MS, Jakeman LB. Alterations in chondroitin sulfate proteoglycan expression occur both at and far from the site of spinal contusion injury. Exp Neurol. 2011;235:174–187. doi: 10.1016/j.expneurol.2011.09.008. [DOI] [PMC free article] [PubMed] [Google Scholar]
- 3.Pizzorusso T, et al. Reactivation of ocular dominance plasticity in the adult visual cortex. Science. 2002;298:1248–1251. doi: 10.1126/science.1072699. [DOI] [PubMed] [Google Scholar]
- 4.Bradbury EJ, et al. Chondroitinase ABC promotes functional recovery after spinal cord injury. Nature. 2002;416:636–640. doi: 10.1038/416636a. [DOI] [PubMed] [Google Scholar]
- 5.Massey JM, et al. Chondroitinase ABC digestion of the perineuronal net promotes functional collateral sprouting in the cuneate nucleus after cervical spinal cord injury. J Neurosci. 2006;26:4406–4414. doi: 10.1523/JNEUROSCI.5467-05.2006. [DOI] [PMC free article] [PubMed] [Google Scholar]
- 6.Shen Y, et al. PTPsigma is a receptor for chondroitin sulfate proteoglycan, an inhibitor of neural regeneration. Science. 2009;326:592–596. doi: 10.1126/science.1178310. [DOI] [PMC free article] [PubMed] [Google Scholar]
- 7.Fisher D, et al. Leukocyte common antigen-related phosphatase is a functional receptor for chondroitin sulfate proteoglycan axon growth inhibitors. J Neurosci. 2011;31:14051–14066. doi: 10.1523/JNEUROSCI.1737-11.2011. [DOI] [PMC free article] [PubMed] [Google Scholar]
- 8.Dickendesher TL, et al. NgR1 and NgR3 are receptors for chondroitin sulfate proteoglycans. Nat Neurosci. 2012;15:703–712. doi: 10.1038/nn.3070. [DOI] [PMC free article] [PubMed] [Google Scholar]
- 9.Tom VJ, Steinmetz MP, Miller JH, Doller CM, Silver J. Studies on the development and behavior of the dystrophic growth cone, the hallmark of regeneration failure, in an in vitro model of the glial scar and after spinal cord injury. J Neurosci. 2004;24:6531–6539. doi: 10.1523/JNEUROSCI.0994-04.2004. [DOI] [PMC free article] [PubMed] [Google Scholar]
- 10.Busch SA, Horn KP, Silver DJ, Silver J. Overcoming macrophage-mediated axonal dieback following CNS injury. J Neurosci. 2009;29:9967–9976. doi: 10.1523/JNEUROSCI.1151-09.2009. [DOI] [PMC free article] [PubMed] [Google Scholar]
- 11.Cajal SRY. Degeneration & regeneration of the nervous system. Humphrey Milford: Oxford University Press; 1928. [Google Scholar]
- 12.Aicher B, Lerch MM, Muller T, Schilling J, Ullrich A. Cellular redistribution of protein tyrosine phosphatases LAR and PTPsigma by inducible proteolytic processing. J Cell Biol. 1997;138:681–696. doi: 10.1083/jcb.138.3.681. [DOI] [PMC free article] [PubMed] [Google Scholar]
- 13.Serra-Pages C, et al. The LAR transmembrane protein tyrosine phosphatase and a coiled-coil LAR-interacting protein co-localize at focal adhesions. EMBO J. 1995;14:2827–2838. doi: 10.1002/j.1460-2075.1995.tb07282.x. [DOI] [PMC free article] [PubMed] [Google Scholar]
- 14.Xie Y, et al. Protein-tyrosine phosphatase (PTP) wedge domain peptides: a novel approach for inhibition of PTP function and augmentation of protein-tyrosine kinase function. J Biol Chem. 2006;281:16482–16492. doi: 10.1074/jbc.M603131200. [DOI] [PubMed] [Google Scholar]
- 15.Jiang G, et al. Dimerization inhibits the activity of receptor-like protein-tyrosine phosphatase-alpha. Nature. 1999;401:606–610. doi: 10.1038/44170. [DOI] [PubMed] [Google Scholar]
- 16.Barr AJ, et al. Large-scale structural analysis of the classical human protein tyrosine phosphatome. Cell. 2009;136:352–363. doi: 10.1016/j.cell.2008.11.038. [DOI] [PMC free article] [PubMed] [Google Scholar]
- 17.Wallace MJ, Fladd C, Batt J, Rotin D. The second catalytic domain of protein tyrosine phosphatase delta (PTP delta) binds to and inhibits the first catalytic domain of PTP sigma. Mol Cell Biol. 1998;18:2608–2616. doi: 10.1128/mcb.18.5.2608. [DOI] [PMC free article] [PubMed] [Google Scholar]
- 18.Silver DJ, et al. Chondroitin sulfate proteoglycans potently inhibit invasion and serve as a central organizer of the brain tumor microenvironment. J Neurosci. 2013;33:15603–15617. doi: 10.1523/JNEUROSCI.3004-12.2013. [DOI] [PMC free article] [PubMed] [Google Scholar]
- 19.Lowery LA, Van Vactor D. The trip of the tip: understanding the growth cone machinery. Nat Rev Mol Cell Biol. 2009;10:332–343. doi: 10.1038/nrm2679. [DOI] [PMC free article] [PubMed] [Google Scholar]
- 20.Polleux F, Snider W. Initiating and growing an axon. Cold Spring Harb Perspect Biol. 2010;2:a001925. doi: 10.1101/cshperspect.a001925. [DOI] [PMC free article] [PubMed] [Google Scholar]
- 21.Sapieha PS, et al. Receptor protein tyrosine phosphatase sigma inhibits axon regrowth in the adult injured CNS. Mol Cell Neurosci. 2005;28:625–635. doi: 10.1016/j.mcn.2004.10.011. [DOI] [PubMed] [Google Scholar]
- 22.Banks WA, Robinson SM, Nath A. Permeability of the blood-brain barrier to HIV-1 Tat. Exp Neurol. 2005;193:218–227. doi: 10.1016/j.expneurol.2004.11.019. [DOI] [PubMed] [Google Scholar]
- 23.Jones LL, Tuszynski MH. Chronic intrathecal infusions after spinal cord injury cause scarring and compression. Microsc Res Tech. 2001;54:317–324. doi: 10.1002/jemt.1144. [DOI] [PubMed] [Google Scholar]
- 24.de Groat WC, et al. Mechanisms underlying the recovery of urinary bladder function following spinal cord injury. J Auton Nerv Syst. 1990;(30 Suppl):S71–S77. doi: 10.1016/0165-1838(90)90105-r. [DOI] [PubMed] [Google Scholar]
- 25.Pikov V, Wrathall JR. Coordination of the bladder detrusor and the external urethral sphincter in a rat model of spinal cord injury: effect of injury severity. J Neurosci. 2001;21:559–569. doi: 10.1523/JNEUROSCI.21-02-00559.2001. [DOI] [PMC free article] [PubMed] [Google Scholar]
- 26.Lee YS, et al. Nerve regeneration restores supraspinal control of bladder function after complete spinal cord injury. J Neurosci. 2013;33:10591–10606. doi: 10.1523/JNEUROSCI.1116-12.2013. [DOI] [PMC free article] [PubMed] [Google Scholar]
- 27.Basso DM, Beattie MS, Bresnahan JC. A sensitive and reliable locomotor rating scale for open field testing in rats. J Neurotrauma. 1995;12:1–21. doi: 10.1089/neu.1995.12.1. [DOI] [PubMed] [Google Scholar]
- 28.Tuszynski MH, Steward O. Concepts and methods for the study of axonal regeneration in the CNS. Neuron. 2012;74:777–791. doi: 10.1016/j.neuron.2012.05.006. [DOI] [PMC free article] [PubMed] [Google Scholar]
- 29.Murray KC, et al. Recovery of motoneuron and locomotor function after spinal cord injury depends on constitutive activity in 5-HT2C receptors. Nat Med. 2010;16:694–700. doi: 10.1038/nm.2160. [DOI] [PMC free article] [PubMed] [Google Scholar]
- 30.Xu B, et al. Role of CSPG receptor LAR phosphatase in restricting axon regeneration after CNS injury. Neurobiol Dis. 2014 doi: 10.1016/j.nbd.2014.08.030. [DOI] [PMC free article] [PubMed] [Google Scholar]
- 31.Horn KP, Busch SA, Hawthorne AL, van Rooijen N, Silver J. Another barrier to regeneration in the CNS: activated macrophages induce extensive retraction of dystrophic axons through direct physical interactions. J Neurosci. 2008;28:9330–9341. doi: 10.1523/JNEUROSCI.2488-08.2008. [DOI] [PMC free article] [PubMed] [Google Scholar]
- 32.Hargreaves K, Dubner R, Brown F, Flores C, Joris J. A new and sensitive method for measuring thermal nociception in cutaneous hyperalgesia. Pain. 1988;32:77–88. doi: 10.1016/0304-3959(88)90026-7. [DOI] [PubMed] [Google Scholar]
- 33.Cheng CL, de Groat WC. The role of capsaicin-sensitive afferent fibers in the lower urinary tract dysfunction induced by chronic spinal cord injury in rats. Exp Neurol. 2004;187:445–454. doi: 10.1016/j.expneurol.2004.02.014. [DOI] [PubMed] [Google Scholar]
- 34.Jakeman LB. Assessment of Lesion and Tissue Sparing Volumes Following Spinal Cord Injury. Animal Models of Acute Neurological Injuries II. 2012:417–442. [Google Scholar]
- 35.Weidner N, Ner A, Salimi N, Tuszynski MH. Spontaneous corticospinal axonal plasticity and functional recovery after adult central nervous system injury. Proc Natl Acad Sci U S A. 2001;98:3513–3518. doi: 10.1073/pnas.051626798. [DOI] [PMC free article] [PubMed] [Google Scholar]
Associated Data
This section collects any data citations, data availability statements, or supplementary materials included in this article.


