Abstract
The cellular membrane governs numerous fundamental biological processes. Therefore, developing a comprehensive understanding of its structure and function is critical. However, its inherent biological complexity gives rise to numerous inter-dependent physical phenomena. In an attempt to develop a model, two different experimental approaches are being pursued in parallel: performing single cell experiments (top down) and using biomimetic structures (bottom up), such as lipid bilayers. One challenge in many of these experiments is the reliance on fluorescent probes for detection which can create confounds in this already complex system. In the present work, a label-free detection method based on an optical resonant cavity is used to detect one of the fundamental physical phenomena in the system: assembly and solubilization of the lipid bilayer. The evanescent field of the cavity strongly interacts with the lipid bilayer, enabling the detection of the bilayer behavior in real-time. Two independent detection mechanisms confirm the formation and detergent-assisted solubilization of the lipid bilayers: (1) a refractive index change and (2) a material loss change. Both mechanisms can be monitored in parallel, on the same device, thus allowing for cross-confirmation of the results. To verify the proposed method, we have detected the formation of self-assembled phosphatidylcholine lipid bilayers from small unilamellar vesicles on the device surface in real-time. Subsequently, we exposed the bilayers to two different detergents (non-ionic Triton X-100 and anionic sodium dodecyl sulfate) to initiate solubilization, and this process was also detected in real-time. After the bilayer solubilization, the device returned to its initial state, exhibiting minimal hysteresis. The experimental wash-off was also collected and analyzed using dynamic light scattering.
Understanding transport across and motion within the cell membrane can enable numerous advances in drug design and improve our fundamental understanding of biological processes.1 One approach which is commonly used to study this system is constructing artificial membranes or lipid bilayers using self-assembly techniques, inserting only the protein of interest.2 There are many approaches for creating solid-supported bilayers,3 but one advantage of the vesicle fusion method is that planar bilayers are spontaneously formed on hydrophilic substrates via extruded liposomes due to the interaction of the proximal leaflets with the substrate.4 Though constrained, the bilayer is a fluid structure,5 and this constant motion creates a background signal which can influence experimental results. One technique for exploring this fluidity is disrupting the membrane structure using detergents. However, experimental results based purely on fluorescent techniques can be confounded because of interactions between the probe molecules and the lipids. Therefore, label-free methods are desirable.
Two label-free techniques which have successfully detected lipid bilayer dynamics are mechanical cantilevers6 and surface plasmon resonance (SPR) sensors.7 SPR offers a sensitivity advantage over mechanical cantilevers because it can maintain performance in aqueous environments. However, the SPR signal can be dependent on the probe density, surface uniformity, and temperature and refractive index changes in the bulk solution. There are two approaches to circumvent these limitations: (1) change the detection mechanism (e.g., use imaging methods8) or (2) reduce the evanescent field length (e.g., use alternative evanescent field methods9). In the present work, we focus on the latter method, using high quality factor (Q) whispering gallery mode optical cavities.10 Resonant cavities confine specific wavelengths of light, also known as resonant wavelengths, which are defined by the device's optical and geometrical properties. Additionally, cavities exhibit characteristic photon lifetimes or quality factors (Q). In the previous work, resonant cavity sensors have demonstrated ultra-sensitive biological and chemical detection by monitoring changes in Q, resonant wavelength, and device geometry.11
In the present work, resonant cavity sensors are used to study the self-assembly and detergent-assisted solubilization of lipid bilayers in real-time. The detection is confirmed by monitoring both the wavelength shift and the photon lifetime change in parallel. Two different detergents are used to solubilize the bilayer (sodium dodecyl sulfate (SDS) and Triton X-100 (TX-100)).
The phospholipid 1,2-dioleoyl-sn-glycero-3-phosphocholine (DOPC, Avanti) is purchased and used without further purification. Solutions of 15 mM SDS (sodium dodecyl sulfate) and 0.5 mM TX-100 (Triton X-100) (Aldrich) are prepared at concentrations above their critical micelle concentration (CMC) which are expected to solubilize the membrane.12
The small unilamellar vesicles (SUVs) are prepared using the extrusion and vesicle fusion method discussed.13 Aliquots of DOPC are dried under nitrogen, forming a thin film. The lipid film is further evaporated under vacuum overnight, then rehydrated in 1X PBS (phosphate buffered saline), and re-suspended by vortexing. A volume of 0.6 mM of DOPC is extruded through a 100 nm pore diameter polycarbonate membrane until the liposomes change from an opaque to a transparent solution. Vesicle size is measured via dynamic light scattering (DLS) (Wyatt).
The silica resonant cavities are fabricated from optical fiber (Newport), using a conventional CO2 laser reflow method.14 The resulting spheres range between 150 and 200 μm in diameter. The microsphere is treated with an oxygen plasma system (Anatech), which serves two purposes: (1) removal of potential contaminants from the surface and (2) enhancement of surface hydrophilicity. This process promotes vesicle fusion and rupture.
Using a tapered optical fiber waveguide, light is coupled into the microcavity from a narrow-linewidth (300 kHz) 765 nm tunable laser (New Focus Velocity). To align the waveguide with the cavity, top and side view camera systems are used in conjunction with nanopositioning stages. The output signal from the waveguide is collected by a photodetector and sent to a high speed digitizer/oscilloscope.13 To determine the quality factor, the spectra are recorded in the under-coupled regime to minimize any non-linear effects. By fitting the resonant peaks to a Lorentzian curve, the full-width-half-max (FWHM, δλ) is used to determine the loaded quality factor (Q) of the device according to Qload = λ/δλ, where λ = resonant wavelength.15
The quality factor is governed by many possible loss mechanisms, comprised of both intrinsic and extrinsic losses.10 High efficiency waveguides, such as tapered fibers, reduce extrinsic losses. As a result, the dominant intrinsic loss mechanism is the material loss of the cavity, allowing the approximation Qload∼Qmat to be made.10 Qmat can be analytically calculated according to the expression: Qmat = 2πn/λα, where α is the effective material absorption and n is the effective refractive index.
The clean microresonator is placed into a ∼200 μl volume aqueous chamber, and the SUVs are introduced into the chamber at a concentration of 0.6 mM in 1X PBS, as shown in Fig. 1(a). As the vesicles approach the surface of the microresonator, they rupture and fuse, resulting in a self-assembled lipid bilayer.3,16 After flushing the chamber with PBS, either the SDS or the TX-100 detergent solution is introduced.13
FIG. 1.
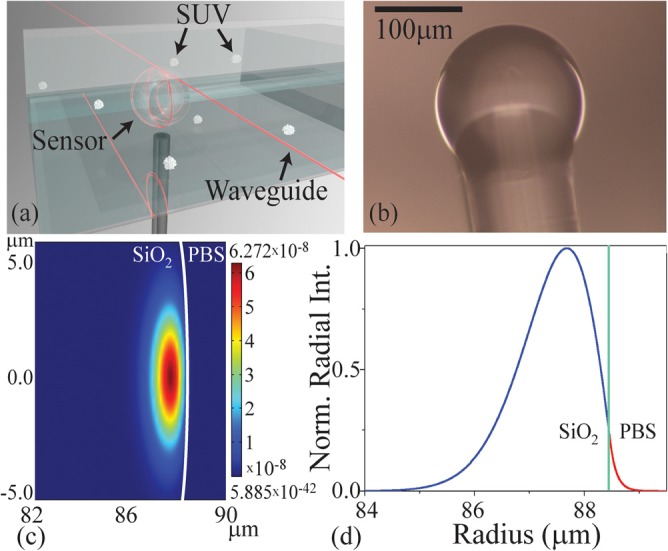
Optical resonant cavity excitation. (a) A rendering of the spherical resonant microcavity inside the detection chamber, highlighting the location of the optical field. (b) An optical micrograph of the SiO2 microsphere microcavity before lipid bilayer adhesion. (c) A FEM simulation of the optical mode in the cavity and buffer. (d) The normalized radial intensity distribution at the cross section of the device. The green line indicates the device:buffer interface. A portion of the optical field clearly extends into the buffer and is able to interact with the ∼5–10 nm bilayer.
Two independent detection mechanisms are used to confirm the formation and detergent-assisted solubilization of the lipid bilayers: (1) a refractive index change and (2) a material loss or material absorption change.13 Both methods rely on the optical mode directly interacting with the lipid bilayer. As can be seen in the finite element method (FEM) simulation (COMSOL Multiphysics) in Figs. 1(c) and 1(d), the evanescent tail of the optical field strongly interacts with the 5–10 nm thick lipid bilayer.13
In the first approach, as the bilayer self-assembles on the cavity surface, the effective refractive index that the optical mode experiences increases because lipids have a higher index than water. Because the resonant wavelength (λ) depends on the refractive index experienced by the mode (neff) according to the expression 2πRneff = mλ, where R is the device radius and m is the optical mode number, when the index changes, the wavelength changes.
In the second method, because the optical absorption of lipids is higher than water, as the bilayer forms and displaces the water, the effective optical loss increases, resulting in a decrease in Qmat. Therefore, by monitoring the Q degradation and recovery and the shift in resonant frequency in real-time, the bilayer formation and solubilization are confirmed.
To perform resonant frequency shift measurements, the previously described testing set-up is used with a slight modification.13 Specifically, the resonant wavelength and transmission are continuously tracked and recorded using a custom LabView program which only records the minimum point. For the present measurements, the data acquisition rate is 600 samples/min.
Several control experiments are also performed to determine the effect of the different detergent solutions (PBS, TX-100 in PBS, SDS in PBS) on the detected signal when a bilayer is not present.13 Because the TX-100 and the SDS have a slightly different index from PBS, they could yield a false positive signal. First, the refractive index of each solution (PBS, TX-100 in PBS, SDS in PBS) is measured using a refractometer. Next, the microcavity is sequentially exposed to each solution, and the resonant wavelength and Q are tracked.
As can be observed in Fig. 2 and in Table I, the control measurements due to the injection of the two different detergents into the PBS solution result in a minimal change in Q and in wavelength. Upon introduction of SUVs into the aqueous chamber, a resonant frequency shift is detected as the vesicles fuse to the microcavity and form a stable planar lipid bilayer (Fig. 2 and Table I). Based on the control experiments, the red shift observed is specific to vesicle rupture and bilayer adhesion. In comparison to all three background measurements, which exhibited shifts in the 0.25–10 pm range, the bilayer formation/detergent-solubilization shift was more than an order of magnitude larger (Δλ ∼ 240–300 pm).13
FIG. 2.
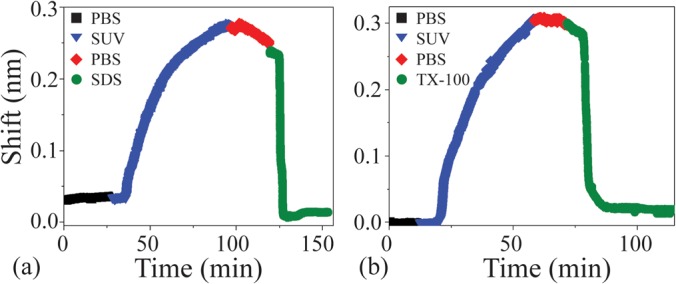
The resonant frequency shift due to liposome fusion and bilayer formation of 0.6 mM DOPC is indicated by the blue curve, and subsequent solubilization via (a) 15 mM SDS, and (b) 0.5 mM TX-100 is shown in green. The detergent-initiated solubilization restores the sensor to its original state, exhibiting minimal hysteresis.
TABLE I.
Effects of a supported lipid bilayer on Q and refractive index.
| Combination (+PBS) | Q | Q error | Δλ (pm) | Δλ error (pm) |
|---|---|---|---|---|
| Control experiments | ||||
| PBS | 7.95 × 10⁶ | ±1.01 × 10⁶ | 1.61 | ±0.39 |
| SDS | 4.88 × 10⁶ | ±7.9 × 10⁵ | 8.42 | ±0.21 |
| TX-100 | 8.93 × 10⁶ | ±2.1 × 10⁶ | 0.29 | ±0.10 |
| SDS experiments | ||||
| PBS | 3.62 × 10⁷ | ±1.5 × 10⁷ | 1.52 | ±0.27 |
| Bilayer | 1.85 × 10⁵ | ±5.1 × 10⁴ | 241 | ±1.60 |
| Bilayer + SDS | 2.40 × 10⁷ | ±1.9 × 10⁷ | 228 | ±0.15 |
| TX-100 experiments | ||||
| PBS | 4.68 × 10⁷ | ±1.9 × 10⁷ | 0.27 | ±0.19 |
| Bilayer | 1.13 × 10⁵ | ±3.2 × 10⁴ | 303 | ±3.54 |
| Bilayer + TX-100 | 1.21 × 10⁷ | ±7.8 × 10⁶ | 289 | ±2.17 |
Once the bilayer has formed, the introduction of pure buffer to flush the SUV-saturated chamber induces a slight blue shift. Initially, two possible explanations were considered: (1) a blue shift is induced by a change in environment due to either temperature or the refractive index of PBS and (2) the PBS may be washing off multilamellar vesicles/layers adsorbed to the bilayer, which are not a part of the laterally diffusing main bilayer membrane. Since the temperatures of all solutions are maintained at 25 °C, and the refractive index measurements indicated a negligible difference between the solutions used in the experiments,13 it is likely that the observed blue shift is due to the removal of residual liposomic micelles on the device.
When the detergents are added for both experiments, the resonant wavelength rapidly returns to its initial position, indicating that the entire lipid bilayer was solubilized (Fig. 2). The control experiments excluding SUVs indicate the shift due to detergents alone are over an order of magnitude smaller (Table I). Additionally, unlike in previous protein dissociation experiments which showed uniform exponential decay indicative of a single kinetic coefficient, the lipid bilayer dissociation or solubilization wavelength shift contained intermediate steps. These intermediate plateaus are indicative of multiple pathways, and perhaps, semi-stable but short-lived intermediate states.
However, while the system can easily detect the 5 nm thick bilayer, the precise nature of the detergent-induced shape changes could not be quantified with the set-up, due to signal blurring from the rapid and abundant motion of the lipids. Because the lateral diffusion of phospholipids and detergent micelle insertions occur on a scale within the same order of magnitude, the membrane is deforming in multiple areas simultaneously, making the distinction between the different mechanisms difficult to achieve.
The second method employed to detect bilayer adhesion and detergent solubilization involves the measurement of the evolution of the device's quality factor (Q) throughout the experiments (Fig. 3, Table I). When the lipid bilayer forms on the cavity surface, the Q decreases from above 107 to ∼105. This nearly two order of magnitude decrease is primarily due to the material absorption of the bilayer. However, upon detergent initiated solubilization and removal of the bilayer, the Q is recovered and returns to its initial value. Additionally, the control experiments verify that the addition of the detergent, without the bilayer present, has minimal impact on the Q. Therefore, this Q change is due solely to the formation and solubilization of a lipid bilayer.13
FIG. 3.
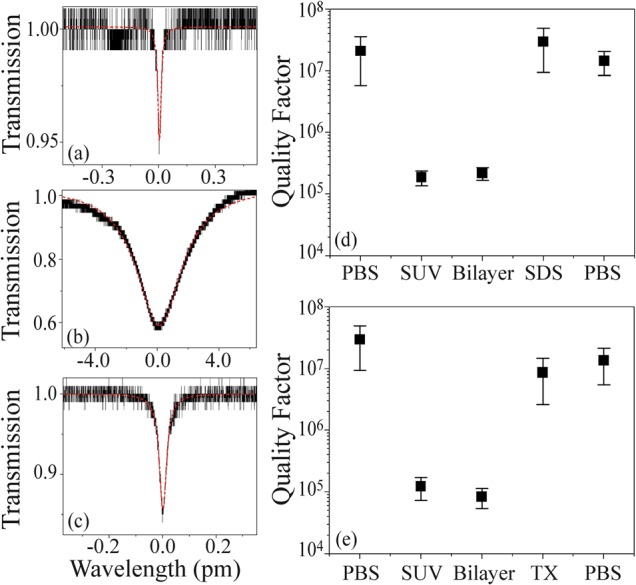
Effects of material absorption on the quality factor of the sensor. The measurements of the photon lifetime or Q factor were performed on: (a) the bare silica sensor in PBS, (b) the sensor coated with a lipid bilayer, and (c) post detergent solubilization, at 765 nm.
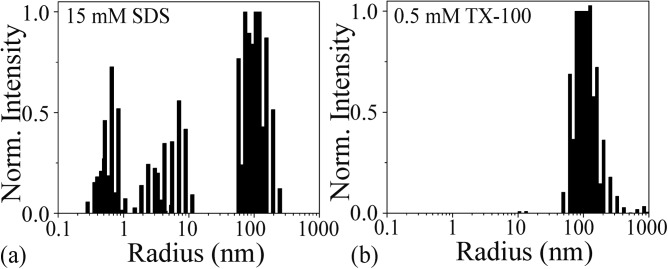
The DLS results from the experimental wash-off experiments are summarized in Fig. 4 and the controls are in the supplementary material.13 By comparing the control and the experimental results, it is clear that the SDS and the TX-100 interact with the lipid bilayer in different ways.
FIG. 4.
DLS histograms of lipid-detergent micelle mixtures from the experimental wash-off of (a) SDS and (b) TX-100 rinses.
Exposure to anionic SDS results in a DLS peak centered at 10 nm which is distinct from the control measurements, and therefore, can be uniquely attributed to the SDS-lipid mixture. These results were expected, as the bilayer is disrupted upon SDS intercalation.
In contrast, the DLS measurements from TX-100 indicate lipid-detergent structures on the order of ∼100 nm and larger only (Fig. 4). Due to the chemical structure of TX-100 and its non-ionic characteristic, one may speculate that stereochemistry plays a role in how the molecules insert into the bilayer. There may be competing interactions between the hydrophilic polyethylene oxide chain and the hydrophobic 4-phenyl group that are not observed with the anionic SDS. Rather than breaking up the bilayer into smaller micelles, larger geometries such as vesicles and sheets are formed.
The solution of SUVs was further characterized using UV-Vis spectroscopy. Two distinct absorption peaks observed are in moderate agreement with the type of bonds specific to DOPC.17 The absorption peak at 190 nm can be attributed to the π-π* bonding interactions of C = C groups and the peak at 250 nm is attributed to the n-π* type of transition due to C=O and N=O bonds.18
In summary, given the combination of DLS and resonant cavity detection results, we propose the pair of solubilization mechanisms shown in Fig. 5.
FIG. 5.
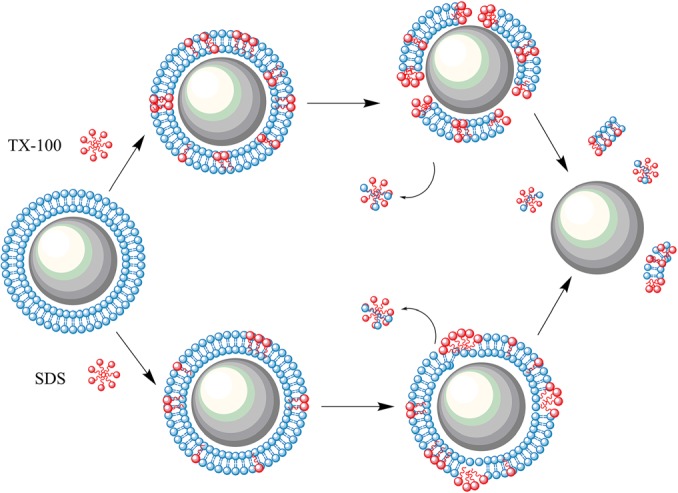
A cartoon schematic detailing the proposed mechanism of lipid bilayer solubilization using the two detergents: SDS (bottom) and TX-100 (top).
By monitoring both the resonant frequency and the quality factor, the formation and solubilization of lipid bilayers are detected in real-time using resonant cavities. Both non-ionic (TX-100) and anionic (SDS) detergents are used to initiate the solubilization, and distinctly different profiles are observed. After the lipid bilayer is completely removed from the device surface, it returns to its initial state, demonstrating the recyclability and repeatability of biosensing experiments with the proposed device.
Through modifications of the device surface or utilization of different types of microcavities, such as liquid droplets, these methods could be extended to membranes with liquid-liquid and solid-liquid phase coexistence. Therefore, the present work sets the foundation for further investigation into membrane dynamics in real-time. Additionally, the present study lays the groundwork for future transmembrane protein studies using resonant cavity sensors. Protein behaviors, such as folding and active vs. passive transport mechanisms,19 are expected to occur at a distinct range from the lateral diffusion of phospholipids and will thus be detectable by the optical cavity biosensor.
Acknowledgments
The authors would like to thank Soheil Soltani (University of Southern California) for helpful discussions regarding the finite element method simulations. Victoria Sun is supported by a Rose Hills Foundation Graduate Fellowship. This work was supported by the National Institutes of Health through the NIH Director's New Innovator Award Program (1DP2OD007391-01). The DLS measurements were performed at the USC NanoBiophysics Core Facility.
References
- 1.Schreier S., Malheiros S. V. P., and de Paula E., Biochim. Biophys. Acta, Biomembr. 1508(1–2), 210 (2000). 10.1016/S0304-4157(00)00012-5 [DOI] [PubMed] [Google Scholar]
- 2.Ottova A., Tvarozek V., Racek J., Sabo J., Ziegler W., Hianik T., and Tien H. T., Supramol. Sci. 4(1–2), 101 (1997). 10.1016/S0968-5677(96)00054-5 [DOI] [Google Scholar]
- 3.Richter R. P., Bérat R., and Brisson A. R., Langmuir 22(8), 3497 (2006). 10.1021/la052687c [DOI] [PubMed] [Google Scholar]
- 4.Ottova A. and Tien H. T., in Advances in Planar Lipid Bilayers and Liposomes, edited by Tien H. T. and Ottova-Leitmannova A. ( Academic Press, 2005), Vol. 1, p. 1. [Google Scholar]
- 5.Shen Y. X., Saboe P. O., Sines I. T., Erbakan M., and Kumar M., J. Membr. Sci. 454, 359 (2014). 10.1016/j.memsci.2013.12.019 [DOI] [Google Scholar]
- 6.Pera I. and Fritz J., Langmuir 23(3), 1543 (2007); 10.1021/la0624337 [DOI] [PubMed] [Google Scholar]; Fritz J., Baller M. K., Lang H. P., Strunz T., Meyer E., Güntherodt H.-J., Delamarche E., Gerber Ch., and Gimzewski J. K., Langmuir 16(25), 9694 (2000). 10.1021/la000975x [DOI] [Google Scholar]
- 7.Glasmästar K., Larsson C., Höök F., and Kasemo B., J. Colloid Interface Sci. 246(1), 40 (2002); 10.1006/jcis.2001.8060 [DOI] [PubMed] [Google Scholar]; Keller C. A., Glasmästar K., Zhdanov V. P., and Kasemo B., Phys. Rev. Lett. 84, 5443 (2000). 10.1103/PhysRevLett.84.5443 [DOI] [PubMed] [Google Scholar]
- 8.Nikitin P. I., Gorshkov B. G., Nikitin E. P., and Ksenevich T. I., Sens. Actuators, B 111–112, 500 (2005); 10.1016/j.snb.2005.03.043 [DOI] [Google Scholar]; Özkumur E., Needham J. W., Bergstein D. A., Gonzalez R., Cabodi M., Gershoni J. M., Goldberg B. B., and Selim Ünlü M., Proc. Natl. Acad. Sci. U.S.A. 105(23), 7988 (2008); 10.1073/pnas.0711421105 [DOI] [PMC free article] [PubMed] [Google Scholar]; Daaboul G. G., Vedula R. S., Ahn S., Lopez C. A., Reddington A., Ozkumur E., and Ünlü M. S., Biosens. Bioelectron. 26(5), 2221 (2011). 10.1016/j.bios.2010.09.038 [DOI] [PubMed] [Google Scholar]
- 9.Luchansky M. S. and Bailey R. C., Anal. Chem. 84, 793 (2012); 10.1021/ac2029024 [DOI] [PMC free article] [PubMed] [Google Scholar]; Mehrabani S., Maker A. J., and Armani A. M., Sensors 14(4), 5890 (2014). 10.3390/s140405890 [DOI] [PMC free article] [PubMed] [Google Scholar]
- 10.Matsko A. B. and Ilchenko V. S., IEEE J. Sel. Top. Quantum Electron. 12(1), 3 (2006). 10.1109/JSTQE.2005.862952 [DOI] [Google Scholar]
- 11.Mehrabani S., Kwong P., Gupta M., and Armani A. M., Appl. Phys. Lett. 102, 241101 (2013); 10.1063/1.4811265 [DOI] [Google Scholar]; Seok Choi H., Ismail S., and Armani A. M., Opt. Lett. 36(12), 2152 (2011); 10.1364/OL.36.002152 [DOI] [PubMed] [Google Scholar]; Soteropulos C., Hunt H., and Armani A. M., Appl. Phys. Lett. 99(10), 103703 (2011); 10.1063/1.3634023 [DOI] [PMC free article] [PubMed] [Google Scholar]; Cheema M. I., Mehrabani S., Peter Y.-A., Armani A. M., and Kirk A. G., Opt. Express 20(8), 9090 (2012); 10.1364/OE.20.009090 [DOI] [PubMed] [Google Scholar]; Santiago-Cordoba M. A., Boriskina S. V., Vollmer F., and Demirel M. C., Appl. Phys. Lett. 99(7), 073701 (2011); 10.1063/1.3599706 [DOI] [Google Scholar]; Zhu J., Ozdemir S. K., Xiao Y.-F., Li L., He L., Chen D.-R., and Yang L., Nat. Photonics 4, 46 (2010). 10.1038/nphoton.2009.237 [DOI] [Google Scholar]
- 12.Ahyayauch H., Bennouna M., Alonso A., and Goñi F. M., Langmuir 26(10), 7307 (2010); 10.1021/la904194a [DOI] [PubMed] [Google Scholar]; Sudbrack T. P., Archilha N. L., Itri R., and Riske K. A., J. Phys. Chem. B 115(2), 269 (2011). 10.1021/jp108653e [DOI] [PubMed] [Google Scholar]
- 13.See supplementary material at http://dx.doi.org/10.1063/1.4908270E-APPLAB-106-066507 for details on computational methods and supplementary figures.
- 14.Vernooy D. W., Ilchenko V. S., Mabuchi H., Streed E. W., and Kimble H. J., Opt. Lett. 23(4), 247 (1998). 10.1364/OL.23.000247 [DOI] [PubMed] [Google Scholar]
- 15.Yariv A., Electron. Lett. 36(11), 321 (2000). 10.1049/el:20000340 [DOI] [Google Scholar]
- 16.Freeman L. M., Li S., Dayani Y., Seok Choi H., Malmstadt N., and Armani A. M., Appl. Phys. Lett. 98(15), 143703 (2011). 10.1063/1.3576908 [DOI] [PMC free article] [PubMed] [Google Scholar]
- 17.Wang F. and Liu J., Nanoscale 5(24), 12375 (2013). 10.1039/c3nr04143c [DOI] [PubMed] [Google Scholar]
- 18.Chaitanya K., Spectrochim. Acta, Part A 86, 159 (2012). 10.1016/j.saa.2011.09.069 [DOI] [PubMed] [Google Scholar]
- 19.Krishnamurthy H. and Gouaux E., Nature 481(7382), 469 (2012); 10.1038/nature10737 [DOI] [PMC free article] [PubMed] [Google Scholar]; Burns J. R., Stulz E., and Howorka S., Nano Lett. 13(6), 2351 (2013). 10.1021/nl304147f [DOI] [PubMed] [Google Scholar]
Associated Data
This section collects any data citations, data availability statements, or supplementary materials included in this article.
Data Citations
- See supplementary material at http://dx.doi.org/10.1063/1.4908270E-APPLAB-106-066507 for details on computational methods and supplementary figures.


