

Abstract
Determining the mechanisms of self-sustained oscillation of the vocal folds requires characterization of the pressures produced by intraglottal aerodynamics. Because most of the intraglottal aerodynamic forces cannot be measured in a tissue model of the larynx, current understanding of vocal fold vibration mechanism is derived from mechanical, analytical, and computational models. Previous studies have computed intraglottal pressures from measured intraglottal velocity fields and intraglottal geometry; however, this technique for determining pressures is not yet validated. In this study, intraglottal pressure measurements taken in a hemilarynx model are compared with pressure values that are computed from simultaneous velocity measurements. The results showed that significant negative pressure formed near the superior aspect of the folds during closing, which agrees with previous measurements in other hemilarynx models. Intraglottal velocity measurements show that the flow near the superior aspect separates from the glottal wall during closing and may develop into a vortex, which further augments the magnitude of negative pressure. Intraglottal pressure distributions, computed by solving the pressure Poisson equation, showed good agreement with pressure measurements. The match between the pressure computations and its measurements validates the current technique, which was previously used to estimate intraglottal pressure distribution in a full larynx model.
INTRODUCTION
Characterizing intraglottal aerodynamics is required in order to understand the mechanisms of self-sustained oscillations during vocal fold vibration. Because the majority of sound is produced during vocal fold closing (Stevens, 1998), knowledge of intraglottal pressures during that phase is especially important. Experimentally determining the detailed spatial and temporal intraglottal pressures is difficult in humans and even tissue models. Thus, almost all of our understanding of intraglottal aerodynamics is derived from mechanical, analytical, and computational models. The reader is referred to Mittal et al. (2013) for a summary of the progress that was made in computational and experimental models used to study the aerodynamics of the vocal folds vibrations.
One of the key points that differentiate the models used to study intraglottal pressure is the assumptions regarding flow separation. For example, Ishizaka and Matsudaira (1972) and Story and Titze (1995) used the Bernoulli equation to predict intraglottal pressures based on the implicit assumption that intraglottal flow separated at the glottal exit. Later models assumed that flow separated inside the glottis (Pelorson et al., 1994) and that pressures were atmospheric downstream of the point of flow separation. Recently, Oren et al. (2014b) and Khosla et al. (2014) computed the intraglottal pressure distributions during closing based on velocity measurements using a derivation of the Navier–Stokes equations; these studies found that large magnitude negative pressures formed near the superior aspect of the fold. The term negative pressure describes the (gauge) pressure values that are less than atmospheric. To compute the intraglottal pressures, several assumptions regarding the glottal flow were necessary; however, the accuracy of the pressure computations could not be determined because no direct measurement of these pressures was made to validate the computation technique.
Intraglottal pressure measurements were taken empirically using a canine hemilarynx model (Alipour and Scherer, 2000). This model was prepared by replacing half of the thyroid cartilage and its associated vocal fold with a plate embedded with pressure taps. The pressure taps were located along the anterior, middle, and posterior planes in the superior and inferior aspects of the fold. Alipour and Scherer (2000) showed that significant negative pressure formed near the superior aspect of the fold. Although a few factors suggested that these negative gauge pressures occurred during the end of closing, the exact phase could not be determined due to lack of simultaneous measurements of vibration. These negative pressures can produce a suction force that will aid in the closing mechanism of the folds. Given that in these previous hemilarynx experiments there was also no visualization of the superior and inferior edge of the fold, the exact location of the pressure taps could not be determined. Thus, further work is needed to substantiate the magnitude and the distribution of the negative pressures that are formed during closing near the superior aspect of the folds.
In the current study, intraglottal pressure measurements taken in a hemilarynx model are compared with pressure values computed from simultaneous velocity measurements. One purpose of this study is to validate the technique used to compute the intraglottal pressure distribution from velocity measurements in the full larynx model (Oren et al., 2014b). The intraglottal velocity measurements are taken using particle image velocimetry (PIV), which also enables identification of the superior and inferior aspects of the fold; this allows us to precisely determine the vertical location of the pressure measurements. Results from the current study are discussed and compared with previous models.
METHODOLOGY
Five larynges were harvested from shared research canine mongrels. All were males and weighed 23.6, 24.1, 23.9, 20.0, and 19.5 kg. The lengths of their vocal folds, measured from the vocal process to the anterior commissure, were 14.0, 14.5, 14.0, 15.0, and 14.5 mm, respectively. The vertical height of the folds, measured from the superior medial edge to the inferior medial edge was 3.0 mm (in all cases). All the structures above the vocal folds were removed to obtain an unobstructed view of the intraglottal flow and flow above the glottis. The tracheas were kept 3–5 cm long and were attached to an aerodynamic nozzle. The upstream airflow in the nozzle was conditioned, measured, and humidified before entering the glottis. Testing was done 24–48 h postmortem. The larynges were refrigerated and kept in saline when not used. More details on the experimental setup can be found in Oren et al. (2014c).
The hemilarynx models were prepared based on the protocols from previous studies (Alipour and Scherer, 2000; Berry et al., 2001; Jiang and Titze, 1993). The vocal fold, paraglottic tissue, and thyroid cartilage were removed on one side in each larynx. The incision along the thyroid cartilage was smoothed under a ×10 microscope using a surgical drill (CORE Sumex Drill, Stryker). The hemilarynx was then attached to a metal plate using three-pronged devices that secured the arytenoids and the anterior commissure to the plate. Any gaps between the plate and hemilarynx were sealed using gauze and vacuum grease.
Two holes were drilled into the metal plate to accommodate the pressure transducers. The holes had a 1.8 mm diameter and were located 1 mm apart in the same vertical plane. The superior hole was located 1.5 mm from the edge of the plate. When attaching the hemilarynx to the plate, special care was taken to ensure that the center of the superior hole was aligned with the superior aspect of the fold and in the mid-membranous plane, which was defined as half way between the vocal process to the anterior commissure. Schematic views of the experimental setup are shown in Fig. 1.
FIG. 1.

Schematics of the hemilarynx setup showing (a) top view and (b) front view. Note that image is not drawn to scale.
The intraglottal pressures along the superior and inferior aspect of the fold were measured using high-response pressure transducers (XCS-062, 0-350cmH2O, Kulite). The high frequency response of the pressure transducer was needed so that the pressure dynamics during vibration could be measured. The miniature pressure transducers fit firmly into the drilled holes in the metal plate. The pressure measurements were taken for 2.7 s at a sampling rate of 80 kHz.
The pressure range of the miniature pressure transducers was significantly higher than the anticipated pressure magnitudes in the glottis. To test that measurements of low-pressure magnitudes were not contaminated by noise in the signal from the fast-response transducer, we compared these pressure measurements with measurements taken using a pressure transducer with a lower pressure range (FPG, 0–25 cm H2O, Honeywell). The FPG pressure transducer has high 0.1% accuracy for its pressure range, but lower frequency response (2 kHz). The validation was done by connecting both transducers into a manifold and subjecting them to the same input pressure, which was selected using a pressure controller (DPI 510, Druck). This process showed that the pressure measurements taken with the miniature pressure transducers matched the pressure values that were measured with the lower range pressure transducer (Fig. 2).
FIG. 2.

Comparison of low-pressure measurements using the miniature pressure transducers that are used in the hemilarynx model (0–350 cm H2O) and low-rated pressure transducer (Honeywell, FPG 0–25 cm H2O).
The upstream pressure, PSG, was measured inside the nozzle, which was connected to the trachea using a pressure transducer (FPG, 0–50 cm H2O, Honeywell). The flow rate, Q, was measured using a Coriolis flow meter (CMF025, MicroMotion, Inc.). These measurements were used to evaluate the pressure in the inferior aspect of the fold using the Bernoulli equation,
| (1) |
where , ASG, and AINF are the density, area inside the nozzle, and the minimum glottal opening area, respectively. The use of Bernoulli's equation to approximate PINF is valid because the airflow inside the nozzle and in the subglottal region is assumed to be (quasi-) steady, incompressible, and inviscid. The latter assumption is based on the aerodynamic design of the nozzle and the study of Oren et al. (2009) that showed that the subglottal shape reduces the (upstream) turbulence level in the glottal flow.
The glottal opening area was recorded using a high-speed video camera (SA4, Photron) that was placed above the larynx. Total of 21 600 images were taken at 8 kHz with a spatial resolution of 33.2 pixels/mm. The glottis changed its shape from convergent to divergent during opening and closing phases. As a result, the minimum glottal area occurred in the superior aspect of the fold during opening and in the inferior aspect during closing.
The velocity fields of the glottal jet were taken using time-resolved PIV measurements. For each run, 2700 images were taken at 1 kHz with a spatial resolution of 71.0 pixels/mm. The flow between the plate and the vibrating fold was measured by illuminating the flow field from above the larynx, and positioning the PIV camera in front of the anterior commissure and above the larynx. Tilting the camera to a angle relative to the horizontal plane of the fold enabled our measurements of the flow between the plate and fold. A Scheimpflug optical adaptor (LaVision GmbH) was used to correct the distortion in the PIV image due to the oblique viewing angle. The PIV measurement plane was directed onto the same measurement plane of the pressure transducers (i.e., mid-membranous plane). The phase of the velocity fields was determined by comparing the TTL signal of the PIV camera with a reference signal, which was based on acoustic measurements (model 4950, 0.5 in. free-field microphone, Brüel & Kjær) that were synchronized with the velocity measurements (Oren et al., 2014c).
The extent of the intraglottal velocity measurements is determined by the location of the superior edge of the fold with respect to inferior edge. Because of the divergent shape of the glottis during closing, the entire intraglottal velocity field can be measured. On the other hand, the convergent shape of the glottis during opening prevented illumination of the lateral aspects of the inferior aspects of the fold. Additionally, the location of the superior edge of the fold can always be determined from the PIV measurements, which was used to certify that the superior aspect of the fold was vibrating against the superior pressure transducer even if some (minimal) vertical displacement of the fold was observed.
To reduce the reflections from the laser, the tissue of the fold was coated with fluorescent red dye (Rhodamine WT Dye, Cole-Parmer) and the metal plate was painted using Rhodamine B, which was dissolved into acrylic clear paint. The lens of the PIV camera was also equipped with a 527 nm band-pass filter. Post processing of the PIV data was done using davis® 8.1 software (LaVision GmbH) with a multi-pass decreasing window size (64 × 64 to 32 × 32) and adaptive interrogation window with 75% overlap. Spurious velocity vectors (i.e., vectors with magnitudes and/or directions that differ substantially from their neighbors) were removed and replaced using linear interpolation. Most of these spurious vectors occurred within 0.1 mm from the glottal wall; no more than 17% of the vectors were replaced using interpolation in each velocity field. The upper bound for the Stokes number that was computed for the current study was S = 0.013, which according to Crowe et al. (1988) sets the estimated error due to the Stokes number effect at less than 2%. More discussion about the uncertainties of the PIV measurements can be found in Oren et al. (2014c).
The pressure distribution was computed from the PIV velocity measurements by solving the pressure Poisson equation:
| (2) |
where is the density and is the vector velocity. The right side of the equation is solved based on the PIV velocity measurements. The method of estimating the pressure distribution from velocity measurements using PIV was shown to have good agreement with direct measurements (de Kat and Oudheusden, 2012). The upper bound of the uncertainty for the pressure computation (de Kat and Oudheusden, 2012) of the current data was estimated to be 40%, which falls within the range reported by Charonko et al. (2010) when using the Poisson equation to compute pressure from PIV.
In order to solve Eq. (2), the boundary conditions of the pressure must be known. The pressure above the folds was assumed to be atmospheric and the pressure below the fold, PINF, was computed from Eq. (1). The flow in the measurement plane was assumed to be two dimensional (2D), which was based on the anterior-posterior supraglottic flow measurements in Khosla et al. (2008), and the intraglottal flow measurements at the mid-membranous plane of the static model of Scherer et al. (2010). The 2D assumption was also validated by computing the divergence of the current velocity measurements, which was between ±5 s−1.
Another assumption needed to solve Eq. (2) was that the pressure gradient normal to the wall was assumed to be zero. In our previous publication (Oren et al., 2014b), we made the qualitative argument that the glottal wall can be considered stationary with respect to the glottal flow because the velocity of the flow is more than an order of magnitude higher than the velocity of the wall (hence = 0). A quantitative argument for this assumption can also be made based on the (peak) acceleration data for the glottal wall from Döllinger et al. (2005). Using control volume analysis shows that the maximum normal pressure generated by the motion of the glottal wall is estimated to be 0.7 Pa, which is clearly negligible.
RESULTS
The temporal variation of the pressure measurements in the superior and inferior aspects of the folds are shown as mean pressure waveforms in Fig. 3. The mean waveforms were generated by averaging together the pressure measurements from each glottal cycle. The images in Fig. 3 are showing the three larynges, L1–L3, at PSG = 28.5, 19.3, and 26.6 cm H2O, respectively. The phase of the glottal cycle is defined as θ = 0°–360°, where θ = 0° or 360° marked the beginning of opening at the superior edge, as determined from the high-speed images of the glottal area. The duration of the opening, closing, and closed phases is marked above each plot of Fig. 3.
FIG. 3.

Pressure measurements in the superior and inferior aspect (showing mean waveforms). (a) L1, PSG = 28.5 cm H2O, (b) L2, PSG = 19.3 cm H2O, and (c) L3, PSG = 26.6 cm H2O. Solid line is showing best fit to the data. Dashed line is showing data reproduce from Alipour and Scherer (2000) (cf. Fig. 6).
The pressure waveforms in the inferior aspect showed a sinusoidal behavior. Specifically, the drop in the pressure magnitude began as the inferior aspect of the fold begins to move laterally from the plate. The pressure did not change much during the opening phase. As determined from the high-speed images, the beginning of the closing phase occurred when the inferior edge starts to move medially (while the superior edge may still be moving laterally). The buildup in the inferior pressure begins as the closing phase begins and reaches its maximum magnitude, which is the same as PSG, or the “lung pressure.” The peak in pressure magnitude occurred at the inferior aspect prior to the peak in the superior aspect due to the vertical mucosal wave that travels in the glottis.
The shape of the pressure waveform in the superior aspect is very different than the inferior due to the dynamics of the flow near the superior aspect. Similar to the flow in the inferior aspect, the pressure superiorly began to drop as soon as the fold began to move laterally from the plate, which marked the beginning of opening (). The drop in the pressure continued monotonically until about midway in closing. Pressures near the superior aspect became negative during the early stage of closing; the lowest pressure was measured shortly before the middle of closing. The lowest value of the negative pressure was directly related to the magnitude of PSG, which was also shown in the full larynx model (Oren et al., 2014b). The pressure near the superior aspect remained negative until about the middle of closing. The buildup in pressure during the mid-to-end of closing occurred monotonically toward the magnitude of PSG. Pressure values in the superior aspect were always lower than the inferior, thus creating the pressure gradient that drives the glottal flow.
Pressure waveforms (based on a case with comparable PSG) from the hemilarynx model of Alipour and Scherer (2000) are also shown in Fig. 3(c). Although the magnitude and phase of the pressure waveforms in their study is somewhat different, the overall shape of their waveforms was similar to the ones in our current study.
The flow separation that occurs in the glottis during closing is shown in the velocity fields for larynx L5 in Fig. 4 (PSG = 28.1 cm H2O). The instantaneous velocity fields shown in the images of Figs. 4(a)–4(c) captured during , where the closing phase occurred during . The velocity fields are shown where the length of each vector (i.e., arrows) corresponds to the magnitude of the velocity. The rotational motion in the flow is identified using the swirling strength parameter, λci, which reveals areas in the flow with high swirling motion (Adrian et al., 2000). The swirling strength can be used to identify vortices with small resolution compared with the spatial resolution of the measurement; it is a measure for the vortex size, but not its force.
FIG. 4.

(Color online) (a)–(c) Instantaneous velocity fields of the same closing phase, L5, PSG = 28.1 cm H2O, . (d) The phased-averaged velocity field for in L5 based on the instantaneous velocity fields.
During closing, the glottal flow separated from the divergent side of the fold. Ambient flow was entrained into the separation zone that was formed between the glottal jet and the fold. The entrainment flow rolled into a vortex near the superior aspect. The same observations were made in the full larynx model (Oren et al., 2014c).
The robustness of velocity measurements with PIV is often enhanced using ensemble averaging of instantaneous velocity fields that are taken during the same phase (i.e., phase-averaging). Using this methodology is not preferable in the current study because of the difficulty of synchronizing the acquisition rate of the PIV (which is set prior to the testing) with the unpredictable vibration frequency of the larynx. In this study, the phase of each velocity field was determined in post-processing and was affected by the jitter in the acoustic signal. The jitter effect in the reference signal is shown in Fig. 4(d), which is the ensemble average for based on the instantaneous velocity fields [Figs. 4(a)–4(c)]. The averaging process smoothed the velocity field, but undesirably, also significantly reduced the magnitude of the vortex because of the small variations in its location.
The pressure distribution data shows that negative pressures were present near the superior aspect of the fold, with the lowest values occurring at the vortex, presumably at its center. The intraglottal pressure distribution was computed by solving Eq. (2) using the velocity fields (Fig. 5). The image in Fig. 5(a) was based on the instantaneous velocity field shown in Fig. 4(a), and the image in Fig. 5(b) was based on the phase-averaged velocity field that is shown in Fig. 4(d). There is a significant gradient that occurred between the pressures in the superior and inferior aspects of the fold, which was also observed in the pressure measurements.
FIG. 5.
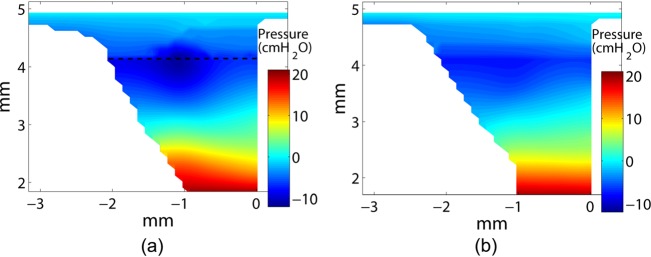
(Color online) (a) Pressure distribution computed from instantaneous velocity data shown in Fig. 4(a). (b) Pressure distribution computed from the phase-averaged velocity data shown in Fig. 4(d).
Comparing the pressure distribution computed from the instantaneous velocity field [Fig. 5(a)] with the pressure distribution computed from the phase-averaged velocity field [Fig. 5(b)] shows that the former is preferable. The lowest negative pressure value that was computed from the instantaneous intraglottal velocity fields was −11.1 cm H2O and the lowest negative pressure that was computed from the phase-average velocity field was −7.8 cm H2O. These values are compared with the pressure that was measured near the superior aspect for the same phase (), which was −11.6 cm H2O. This process shows that using the phase-averaged velocity field to compute the pressure diminishes the extent of the intraglottal vortex and consequently lessens the magnitude of the aerodynamic forces generated near the fold's superior aspect.
The lateral changes in the intraglottal pressure distribution are minimal (compared with the vertical changes), which was also shown in the computational model of Mihaescu et al. (2010). The lateral pressure profiles at the inferior and superior aspects were extracted in the same vertical plane of the pressure transducers (Fig. 6). The dashed line in Fig. 5(a) marks the approximate location of the superior profile that is shown. The pressure computed in the inferior aspect is about 18 cm H2O. The values of the negative pressures in the superior profile match fairly well with the pressure measurement for the same phase (Fig. 7).
FIG. 6.

Lateral pressure profiles computed from PIV at the same vertical location of the superior and inferior pressure measurements. Solid symbol indicates the value used to compare with the pressure measurement.
FIG. 7.

Comparison of the pressure computed from PIV and the pressure measurements during the closing phase of the glottal cycle. Solid line is the fit data to the superior pressure measurement. (a) L3, PSG = 26.6 cm H2O. The dashed line is the fit data to the pressure computed in a full larynx model with PSG = 25.5 cm H2O shown in Oren et al. (2014b). (b) L4, PSG = 21.9 cm H2O. (c) L5, PSG = 28.1 cm H2O.
DISCUSSION
Pressure measurements in the inferior and superior aspects of the folds and intraglottal velocity measurements were taken in a hemilarynx model. The inferior pressure measurements showed sinusoidal waveform characteristics with a peak magnitude that is equal to the subglottal pressure. The pressure measurements at the superior aspect showed that negative pressure is formed shortly after the beginning of closing and reaches the lowest value at the mid to latter part of closing. The pressure rapidly increases at the very end of closing. Velocity measurements using PIV showed that the flow separated from the fold during the closing phase due to the divergent angle of the fold. The study found good agreement between the pressure that was computed from PIV and the pressure measurements at the wall. The last finding of the study substantiates the method that was used to estimate the intraglottal pressure distribution in a full larynx model (Oren et al., 2014b; Khosla et al., 2014).
During the closing phase, the fold assumes a divergent shape because of the vertical mucosal wave that travels in the glottis (Titze, 1988) and the vertical difference in the stiffness of the tissue (Oren et al., 2014a). The flow coming from the subglottis can no longer follow the wall of the fold because of the divergent shape and separates from it. Flow from the ambient air then entrains into the separation zone that is formed between the wall and the glottal flow. This entrained flow may roll into vortices (Oren et al., 2014c). It is well established in fluid mechanics that vortices can generate pressures that are less than atmospheric (i.e., negative pressure), and their magnitude depends on the strength of the rotational motion. The flow separation that occurs during closing induces the negative pressures at the superior aspect of the fold. Due to the negative pressure that is observed near the superior aspect, the magnitude of the transglottal pressure can surpass the magnitude of PSG, thus creating a large pressure gradient along the vertical height of the glottis. This large pressure gradient is an additional mechanism that contributes to the acceleration of the glottal flow, which occurs toward the end of closing and also contributes to rapid decrease of the glottal area.
The main limitation of the study is that the pressure and velocity measurements are taken in a particular plane and do not necessary exemplify the 3D nature of the flow. Several studies have shown that the dynamics of the flow change significantly near the anterior and posterior aspects of the folds, and more specifically that the out-of-plane component of the intraglottal velocity is increased (Khosla et al., 2008; Scherer et al., 2010).
The comparison between the pressure measurements (taken as the best fit line to the data from the superior measurements) and the pressure computed from PIV for larynges L3–L5 is shown in Fig. 7. The pressure values from PIV were taken as the closest value that was computed near the wall of the plate (i.e., Fig. 6, solid symbol). The pressure values are shown just for the closing phase since the entire intraglottal flow cannot be measured during opening (due to the convergent shape of the folds). The pressure computed from PIV is also not shown for the end of the closing phase because the quasi-steady assumption (Krane et al., 2010; Mongeau et al., 1997; Zhang et al., 2002) needed to solve Eq. (2) (Oren et al., 2014b), is no longer valid. The maximum measured acceleration of the intraglottal flow during the period when the quasi-steady assumption was applied was 40 000 m/s2, which has the potential to produce a pressure change of up to 1.9 cm H2O. The current result show overestimation of the magnitude of the negative pressure for larynx L4 by no more than 1.8 cm H2O, and underestimation of the pressures for larynges L3 and L5 by no more than 3.9 cm H2O.
Figure 7 shows that the pressure computed from PIV matches fairly well with the measured data in the superior aspects. The overall error of the pressure computations was calculated as the rms of the difference between the computations and the measurements and was found to be 36%, which matches with the uncertainty that is predicted for using the pressure Poisson equation for this study. We emphasize that the agreement is related to the pressure near the plate. The intraglottal pressure distribution that is shown is approximated and is based on the validity of the other assumptions being used to solve Eq. (2). These same assumptions on the flow were used to compute the intraglottal pressures in the full larynx model (Oren et al., 2014b).
Although validation of our pressure computations with measured pressures does support our use of the quasi-steady assumption, it does not necessarily support the use of this assumption in general. For theoretical models, the quasi-steady hypothesis is used to determine velocity fields, and changes in vocal fold geometry and pressures; in our experiments, the first two variables were measured. It may be that unsteady effects change the geometry and velocity fields, but these effects are accounted for in the measurements. Thus it can only be stated that our data supports the use of the pseudo-steady hypothesis to theoretically calculate pressure fields from direct measurement of intraglottal geometry and velocities. Further work is still needed to show the validity of the quasi-steady assumption.
The development of negative pressure in the glottis during closing was predicted by the small-amplitude oscillation theory (Titze, 1988). Titze's theory, however, attributes the development of the negative pressure to the inertia forces in the flow, which are created due to the presence of a vocal tract above the folds. A vocal tract was neither present in the current study nor in the study of Alipour and Scherer (2000), yet both studies measured negative pressure near the superior aspect of the fold. While the presence of superior negative intraglottal pressures is clearly demonstrated, their effect on vocal fold vibration and sound production is yet to be determined.
CAVEATS IN COMPARING AERODYNAMICS OF THE HEMILARYNX AND FULL LARYNX MODELS
Jiang and Titze (1993) were the first to use the hemilarynx model and showed that the acoustic characteristics and some of the vibration characteristics were comparable with the full larynx model. Our findings suggest that there may be some caveats when comparing aerodynamics of the hemilarynx to the full larynx. First, the velocity measurements in the full larynx model showed that the intraglottal flow may separate only from one side and remain attached to the other, whereas the vibrations of the folds remain symmetric (as observed from above). Similar flow behavior was also observed in static mechanical models (Alipour et al., 1996; Kucinschi et al., 2006) and dynamic models (Krane et al., 2007; Triep et al., 2005). Such flow behavior cannot be studied in a hemilarynx model because the flow will not separate from the plate side while attaching to the fold side. Second, the aerodynamics that govern the flow in the subglottal region differs between the hemilarynx and full larynx; that is, the inserted plate likely induces some instabilities in flow that do not exist in the full larynx model. Third, the values of the negative pressure computed in the full larynx were much lower than the pressure computed in the hemilarynx model (for comparable PSG). The negative pressure estimated in the full larynx with comparable PSG (Oren et al., 2014b) was also shown in Fig. 7(a). The lowest value of the negative pressure computed in the full larynx model was −14.5 cm H2O, which is much lower than the hemilarynx. However, the shape of both waveforms matches fairly well, which is consistent with the underlying hypothesis that intraglottal vortices produce the negative pressure.
Another observation that differentiates the hemilarynx from the full larynx model is the duration of the opening, closing, and closed phases during the glottal cycle. The five studied hemi-larynges exhibited a very short closed phase (i.e., duration where the fold is attached to the wall). Similar behavior can be extracted from the hemilarynx model of Alipour and Scherer (2000) (based on the duration of the peak pressure in the superior aspect measurements; cf. Figs. 5 and 6 in their paper), and in the hemilarynx model of Döllinger et al. (2005) (cf. Figs. 3 and 4 in their paper). Short duration of the closed phase was observed in a full larynx in cases where the folds vibration occurs in a zipper-like motion (Granqvist et al., 2003). The zipper-like motion during closing in the full larynx was more likely to produce asymmetries in the intraglottal flow and yield lower magnitudes of negative pressures during closing (Oren et al., 2014b,c). The shorter closed phase in the hemilarynx model might stem from the fact that the fold collides with a rigid surface that absorbs all the collision energy. In contrast, the duration of the collision between two folds in a full larynx model is prolonged by the compliance (i.e., elasticity) of the tissue. All of the observations that compare the hemi and full larynx models should be taken with cautions because the experiments were not done in the same larynx.
Further work is still needed to assess how the negative pressures during closing affect the vibration mechanism of the folds. In addition, our results suggest that further work should be done to compare the aerodynamic differences between the hemi and full larynx models. In the past, the hemilarynx model was necessary to determine intraglottal pressures and the dynamics of the medial surface of the folds. Our findings are a step forward that show that both pressures and medial surface dynamics can now be measured during closing phase in the full larynx.
ACKNOWLEDGMENT
The authors acknowledge the support of NIH Grant No. 5R01DC009435. The authors thank Alexandra Maddox for her contribution in performing the experiments.
References
- 1.Adrian, R., Christensen, K., and Liu, Z. C. (2000). “ Analysis and interpretation of instantaneous turbulent velocity fields,” Exp. Fluids 29, 275–290 10.1007/s003489900087 [DOI] [Google Scholar]
- 2.Alipour, F., and Scherer, R. C. (2000). “ Dynamic glottal pressures in an excised hemilarynx model,” J. Voice 14, 443–454 10.1016/S0892-1997(00)80002-8 [DOI] [PubMed] [Google Scholar]
- 3.Alipour, F., Scherer, R., and Knowles, J. (1996). “ Velocity distributions in glottal models,” J. Voice 10, 50–58 10.1016/S0892-1997(96)80018-X [DOI] [PubMed] [Google Scholar]
- 4.Berry, D. A., Montequin, D. W., and Tayama, N. (2001). “ High-speed digital imaging of the medial surface of the vocal folds,” J. Acoust. Soc. Am. 110, 2539–2547 10.1121/1.1408947 [DOI] [PubMed] [Google Scholar]
- 5.Charonko, J. J., King, C. V., Smith, B. L., and Vlachos, P. P. (2010). “ Assessment of pressure field calculations from particle image velocimetry measurements,” Meas. Sci. Technol. 21, 105401. 10.1088/0957-0233/21/10/105401 [DOI] [Google Scholar]
- 6.Crowe, C., Chung, J., and Troutt, T. (1988). “ Particle mixing in free shear flows,” Prog. Energy Combust. Sci. 14, 171–194 10.1016/0360-1285(88)90008-1 [DOI] [Google Scholar]
- 11.de Kat, R., and van Oudheusden, B. (2012). “ Instantaneous planar pressure determination from PIV in turbulent flow,” Exp. Fluids 52, 1089–1106 10.1007/s00348-011-1237-5 [DOI] [Google Scholar]
- 7.Döllinger, M., Berry, D. A., and Berke, G. S. (2005). “ Medial surface dynamics of an in vivo canine vocal fold during phonation,” J. Acoust. Soc. Am. 117, 3174–3183 10.1121/1.1871772 [DOI] [PubMed] [Google Scholar]
- 8.Granqvist, S., Hertegård, S., Larsson, H., and Sundberg, J. (2003). “ Simultaneous analysis of vocal fold vibration and transglottal airflow: Exploring a new experimental setup,” J. Voice 17, 319–330 10.1067/S0892-1997(03)00070-5 [DOI] [PubMed] [Google Scholar]
- 9.Ishizaka, K., and Matsudaira, M. (1972) “ Fluid mechanical considerations of vocal cord vibration,” Monograph No. 8, Speech Communication Research Laboratory, Santa Barbara. [Google Scholar]
- 10.Jiang, J. J., and Titze, I. R. (1993). “ A methodological study of hemilaryngeal phonation,” Laryngoscope 103, 872–882 10.1288/00005537-199308000-00008 [DOI] [PubMed] [Google Scholar]
- 12.Khosla, S., Murugappan, S., Lakhamraju, R., and Gutmark, E. (2008). “ Using particle imaging velocimetry to measure anterior-posterior velocity gradients in the excised canine larynx model,” Ann. Otol. Rhinol. Laryngol. 117, 134–144. [DOI] [PMC free article] [PubMed] [Google Scholar]
- 13.Khosla, S., Oren, L., Ying, J., and Gutmark, E. (2014). “ Direct simultaneous measurement of intraglottal geometry and velocity fields in excised larynges,” Laryngoscope 124, S1–S13 10.1002/lary.24866 [DOI] [PubMed] [Google Scholar]
- 14.Krane, M., Barry, M., and Wei, T. (2007). “ Unsteady behavior of flow in a scaled-up vocal folds model,” J. Acoust. Soc. Am. 122, 3659–3670 10.1121/1.2409485 [DOI] [PMC free article] [PubMed] [Google Scholar]
- 15.Krane, M. H., Barry, M., and Wei, T. (2010). “ Dynamics of temporal variations in phonatory flow,” J. Acoust. Soc. Am. 128, 372–383 10.1121/1.3365312 [DOI] [PMC free article] [PubMed] [Google Scholar]
- 16.Kucinschi, B. R., Scherer, R. C., DeWitt, K. J., and Ng, T. T. M. (2006). “ Flow visualization and acoustic consequences of the air moving through a static model of the human larynx,” J. Biomech. Eng. 128, 380–390 10.1115/1.2187042 [DOI] [PubMed] [Google Scholar]
- 17.Mihaescu, M., Khosla, S., Murugappan, S., and Gutmark, E. (2010). “ Unsteady laryngeal airflow simulations of the intra-glottal vortical structures,” J. Acoust. Soc. Am. 127, 435–444 10.1121/1.3271276 [DOI] [PMC free article] [PubMed] [Google Scholar]
- 18.Mittal, R., Earth, B. D., and Plesniak, M. W. (2013). “ Fluid dynamics of human phonation and speech,” Ann. Rev. Fluid Mech. 45, 437–467 10.1146/annurev-fluid-011212-140636 [DOI] [Google Scholar]
- 19.Mongeau, L., Franchek, N., Coker, C. H., and Kubli, R. A. (1997). “ Characteristics of a pulsating jet through a small modulated orifice, with application to voice production,” J. Acoust. Soc. Am. 102, 1121–1133 10.1121/1.419864 [DOI] [PubMed] [Google Scholar]
- 20.Oren, L., Dembinski, D., Gutmark, E., and Khosla, S. (2014a). “ Characterization of the vocal fold vertical stiffness in a canine model,” J. Voice 28, 297–304 10.1016/j.jvoice.2013.11.001 [DOI] [PMC free article] [PubMed] [Google Scholar]
- 21.Oren, L., Khosla, S., and Gutmark, E. (2014b). “ Intraglottal pressure distribution computed from empirical velocity data in canine larynx,” J. Biomech. 47, 1287–1293 10.1016/j.jbiomech.2014.02.023 [DOI] [PMC free article] [PubMed] [Google Scholar]
- 22.Oren, L., Khosla, S., and Gutmark, E. (2014c). “ Intraglottal geometry and velocity measurements in canine larynges,” J. Acoust. Soc. Am. 135, 380–388 10.1121/1.4837222 [DOI] [PMC free article] [PubMed] [Google Scholar]
- 23.Oren, L., Khosla, S., Murugappan, S., King, R., and Gutmark, E. (2009). “ Role of subglottal shape in turbulence reduction,” Ann. Otol. Rhinol. Laryngol. 118, 232–240 10.1177/000348940911800312 [DOI] [PubMed] [Google Scholar]
- 24.Pelorson, X., Hirschberg, A., Van Hassel, R., Wijnands, A., and Auregan, Y. (1994). “ Theoretical and experimental study of quasisteady-flow separation within the glottis during phonation. Application to a modified two-mass model,” J. Acoust. Soc. Am. 96, 3416–3431 10.1121/1.411449 [DOI] [Google Scholar]
- 25.Scherer, R. C., Torkaman, S., Kucinschi, B. R., and Afjeh, A. A. (2010). “ Intraglottal pressures in a three-dimensional model with a non-rectangular glottal shape,” J. Acoust. Soc. Am. 128, 828–838 10.1121/1.3455838 [DOI] [PMC free article] [PubMed] [Google Scholar]
- 26.Stevens, K. N. (1998). Acoustic Phonetics ( MIT Press, Cambridge, MA: ), pp. 1–202. [Google Scholar]
- 27.Story, B. H., and Titze, I. R. (1995). “ Voice simulation with a body-cover model of the vocal folds,” J. Acoust. Soc. Am. 97, 1249–1260 10.1121/1.412234 [DOI] [PubMed] [Google Scholar]
- 28.Titze, I. R. (1988). “ The physics of small-amplitude oscillation of the vocal folds,” J. Acoust. Soc. Am. 83, 1536–1552 10.1121/1.395910 [DOI] [PubMed] [Google Scholar]
- 29.Triep, M., Brücker, C., and Schröder, W. (2005). “ High-speed PIV measurements of the flow downstream of a dynamic mechanical model of the human vocal folds,” Exp. Fluids 39, 232–245 10.1007/s00348-005-1015-3 [DOI] [Google Scholar]
- 30.Zhang, Z., Mongeau, L., and Frankel, S. H. (2002). “ Experimental verification of the quasi-steady approximation for aerodynamic sound generation by pulsating jets in tubes,” J. Acoust. Soc. Am. 112, 1652–1663 10.1121/1.1506159 [DOI] [PubMed] [Google Scholar]