Abstract
Biophysical studies of the interaction of peptides with model membranes provide a simple yet effective approach to understand the transport of peptides and peptide based drug carriers across the cell membrane. Herein, the authors discuss the use of self-assembled monolayers fabricated from the full membrane-spanning thiol (FMST) 3-((14-((4′-((5-methyl-1-phenyl-35-(phytanyl)oxy-6,9,12,15,18,21,24,27,30,33,37-undecaoxa-2,3-dithiahenpentacontan-51-yl)oxy)-[1,1′-biphenyl]-4-yl)oxy)tetradecyl)oxy)-2-(phytanyl)oxy glycerol for ultrahigh vacuum (UHV) based experiments. UHV-based methods such as electron spectroscopy and mass spectrometry can provide important information about how peptides bind and interact with membranes, especially with the hydrophobic core of a lipid bilayer. Near-edge x-ray absorption fine structure spectra and x-ray photoelectron spectroscopy (XPS) data showed that FMST forms UHV-stable and ordered films on gold. XPS and time of flight secondary ion mass spectrometry depth profiles indicated that a proline-rich amphipathic cell-penetrating peptide, known as sweet arrow peptide is located at the outer perimeter of the model membrane.
I. INTRODUCTION
Biological membranes are an integral part of transport, communication, and energy transduction systems within cells. However, the hydrophobic nature of the lipid bilayer of the cell membrane renders it impermeable to many biologically active substances like hydrophilic proteins and oligonucleotides. Cell-penetrating peptides have been applied for the intracellular delivery of numerous cargos across the cell membrane, and in spite of their widespread application in the past 20 years, their exact mechanism of translocation still remains unclear. As there is no unified cell model that can be applied for studying the interaction of cell-penetrating peptides and cell membranes, we have chosen to engineer a model membrane that mimics the hydrophobic barrier of the plasma membrane.
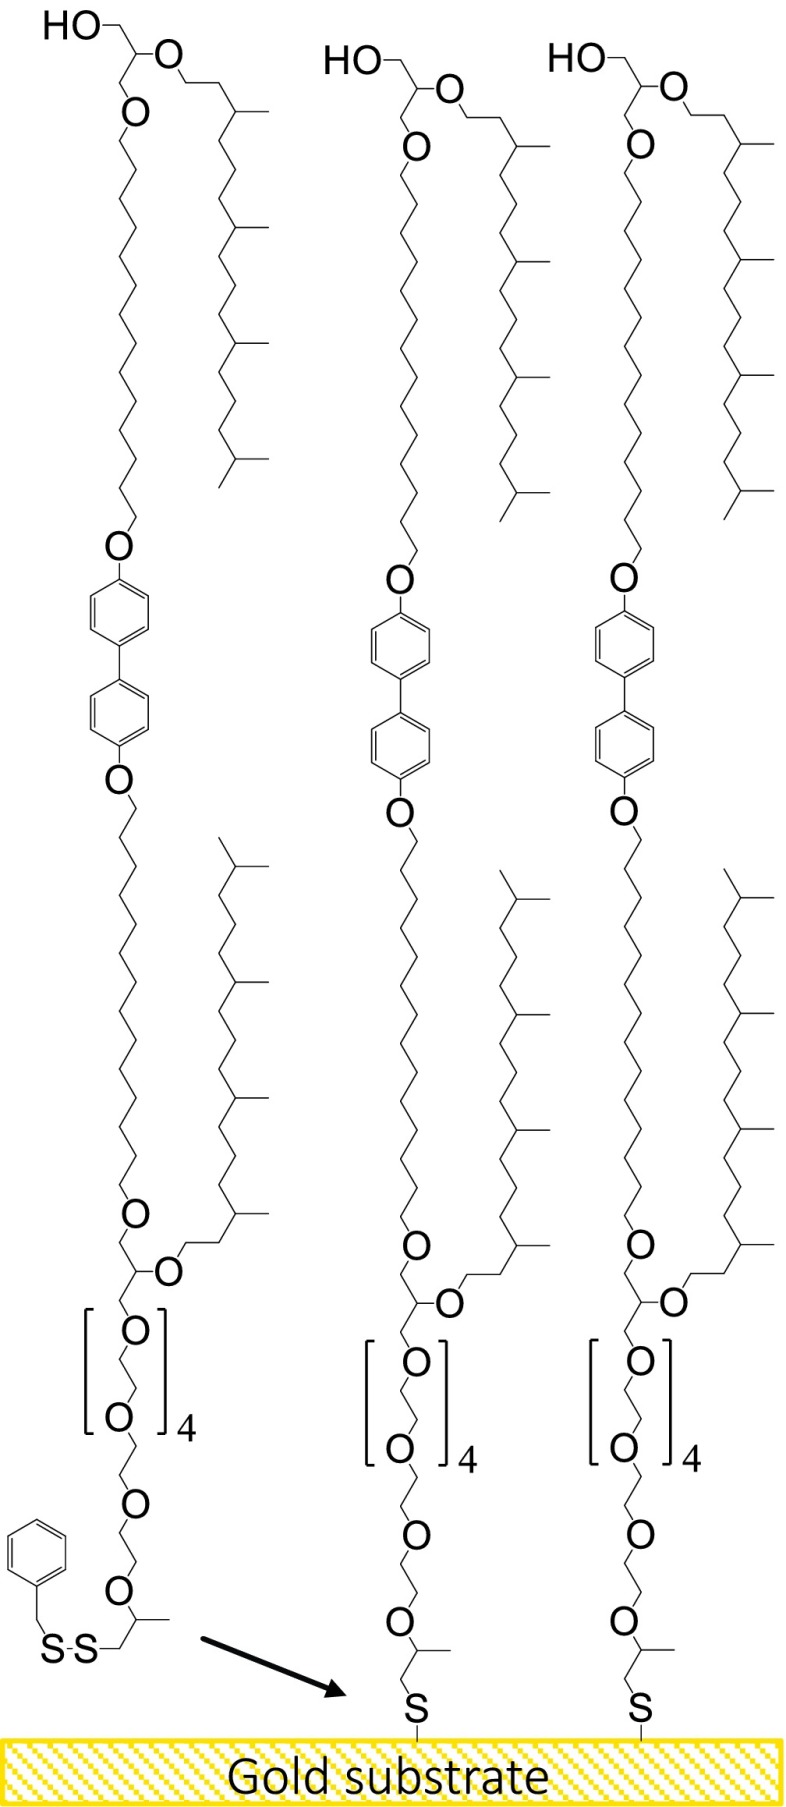
Cell membranes that are solid supported have been modeled and have proven to be quite stable due to crosslinking between proximal and distal lipid leaflets.1,2 However, intercalation of peptides and other molecules can be sterically hindered by the solid contacts of the lipid layer. Tethered bilayer lipid membranes (tBLMs), on the other hand, are supported by “cushions” of polyethylene glycol (PEG) chains, to separate the lipid layer from the rigid solid substrate.3 There are well-established approaches for the preparation of the corresponding distal lipid leaflet, e.g., vesicle spreading or rapid solvent exchange. However, in all of these systems, the lipid assemblies are stabilized by hydrophobic interactions, which break down under ultrahigh vacuum (UHV) conditions. UHV-based techniques, such as x-ray photoelectron spectroscopy (XPS),4,5 time-of-flight secondary ion mass spectrometry (ToF-SIMS),5–12 and near edge x-ray absorption fine structure (NEXAFS) spectroscopy,13 have been shown to be able to provide important information about protein structure and binding at surfaces.7–9,14 However, the destabilization in UHV can lead to disturbed or significantly disordered bilayers, which makes in vacuo high-resolution structural studies impossible. We therefore used the approach to chemically link the proximal and the distal lipid leaflet in a single full membrane spanning thiol (FMST) using 3-((14-((4′-((5-methyl-1-phenyl-35-(phytanyl)oxy-6,9,12,15,18,21,24,27,30,33,37-undecaoxa-2,3-dithiahenpentacontan-51-yl)oxy)-[1,1′-biphenyl]-4-yl)oxy)tetradecyl)oxy)–2-(phytanyl)oxy glycerol (Scheme 1) to form—in one step—a self-assembled monolayer (SAM)-type full bilayer lipid membrane (tFBLM). The molecules consist of two sequences of alkane chains connected via aromatic groups to mimic the hydrophobic core of a lipid bilayer. This aliphatic sequence is terminated on one side by an OH group, emulating a hydrophilic lipid head group, the other side of the alkane segment carries a thiol function for surface attachment and a PEG chain to provide film mobility and emulate a hydrophilic environment.
Scheme 1.
Schematic of proposed surface structure. Self-assembled monolayer of the hydroxyl terminated full membrane spanning tether molecule FMST coordinated onto a gold surface.
Cell-penetrating peptides (CPPs) can overcome the cell membrane barrier and have been applied to deliver various cargos into cells.15,16 Pathways for cell entry by peptides are diverse, they include macropinocytosis, endocytosis, and direct penetration of the cell membrane.17–19 However, the exact mechanism of cell uptake is still not well understood, and this current lack of information about CPP-membrane interactions represents a hurdle to the design of peptide-based drug carriers.
Proline-rich amphipathic CPPs have drawn considerable attention due to efficient cellular uptake and noncytotoxicity.20,21 In this work, we have chosen the proline-rich peptide SAP(E) [sequence CGGW(VELPPP)3] as it represents the first example of negatively charged CPPs. It is a variation of the so-called sweet arrow peptide (SAP), an amphipathic peptide derived from the natural sequence of the N-terminal domain of γ-zein that contains 50% of proline residues [sequence (VRLPPP)3].22 In SAP(E) all arginine residues have been replaced by glutamic acid residues. Interestingly, it has been observed that the cellular uptake rate is not affected by the reversed net charge. This is surprising in view of the net negative charge of cell membranes. Based on colocalization studies, it has been proposed that SAP(E) uses a caveolae-mediated uptake mechanism, which is beneficial for peptide conjugates as this pathway reduces the risk of degradation by proteases.23 Here, small, protein-coated invaginations in the cell membrane trap membrane-bound but yet mobile molecules and particles.24
An important requirement for any “active” uptake mechanism, including caveolae-mediated transport, is the relatively stable interaction between the peptide and the cell membrane. Another important question for a more detailed understanding of the cell uptake mechanism is the location of the peptide with respect to the membrane. Is the peptide binding to the outer surface or is it located within the hydrophobic lipid core of the bilayer, or is it found throughout the bilayer, implying it might penetrate the bilayer even without protein-driven uptake. To answer these questions, we used simplified model lipid bilayers to probe interaction of SAP(E) with a lipidlike environment. A protein free model membrane allows us to study the SAP(E)–lipid system without interference by proteins and other biomolecules.
This approach combines the advantages of different model membrane systems to implement a vacuum stable solid supported tFBLM. We studied the interaction of SAP(E) with this model bilayer using XPS, ToF-SIMS, and NEXAFS spectroscopy. To localize the peptide within the film, we combined ToF-SIMS and XPS with depth profiling using argon cluster beams.
II. EXPERIMENT
All solvents, chemicals, and reagents were bought from commercial sources and used without further purification. Ac-CGGWVELPPPVELPPPVELPPP-NH2 (purity > 95%) was purchased from Genosphere Biotechnologies (Paris, France). The hydroxyl terminated full membrane spanning thiol FMST ((3–((14–((4′-((5-methyl-1-phenyl-35-(phytanyl)oxy-6,9,12,15,18,21,24,27,30,33,37-undecaoxa-2,3-dithiahenpentacontan-51-yl)oxy)-[1,1′-biphenyl]-4-yl)oxy)tetradecyl)oxy)-2-(phytanyl)oxy)glycerol) was purchased from SDx Tethered Membranes Pty Ltd. (Sydney, Australia).
A. Self-assembled monolayer
The substrates used in this study were 1 × 1 cm pieces cut from a silicon wafer (ABC GmbH, Brunnthal, Germany), coated with 10 nm chromium and 80 nm gold by thermal evaporation at pressures below 2 × 10⁻⁶ bars. The SAMs were prepared by immersing the gold surfaces into 1 μM FMST, dissolved in ethanol (absolute, Fisher Scientific) for different incubation times, ranged from 2 s up to 16 h. A higher solution concentration (30 μM) was used for the assembly of more ordered SAMs. The SAMs were then rinsed thoroughly with pure ethanol to remove any unbound or oxidized thiol molecules. Samples were dried in a stream of nitrogen and stored under nitrogen.
B. Peptide adsorption
A highly-ordered SAM (30 μM, 24 h) was immersed in an aqueous peptide solution (0.1 mg/ml), buffered with phosphate buffered saline (PBS, 0.01 M phosphate buffer, 0.0027 M KCl and 0.137 M NaCl, pH 7.4, Sigma Aldrich). After 15 h, the peptide solution was exchanged several times with pure buffer by dilution displacement to avoid a Langmuir deposition of additional peptide onto the sample when the sample was removed from the PBS. Afterward, the samples were rinsed thoroughly with MilliQ water. The samples were dried in a nitrogen stream and stored under nitrogen until analysis.
C. X-ray photoelectron spectroscopy
Measurements were performed on a Kratos AXIS Ultra DLD instrument using a monochromatic Al Kα x-ray source. The electron take off angle was 90° in hybrid mode. The take-off angle is defined as the angle between the sample surface plane and the axis of the analyzer lens. A compositional survey and detailed scans (C 1s, N 1s, O 1s, and S 2p) were acquired using an analyzer pass energy of 80 eV. High resolution scans (N 1s and S 2p) were acquired with an analyzer pass energy of 20 eV. Three spots on each sample were analyzed. Error bars in the reported data represent the standard deviation of the average of the three spots. Data analysis was performed with CasaXPS software. A gas cluster source using 5 keV Ar500+ gas cluster ion beam was used for sputtering. A depth profile of the sample was generated in 85 cycles, each XPS spectrum collected after exposing the sample to the gas cluster ion beam for 10 s.
D. Time-of-flight secondary ion mass spectrometry
A ToF-SIMS depth profile was carried out in the noninterlaced mode (i.e., the sputter and analysis cycles were done in separate ToF cycles) using a IONTOF ToF-SIMS 5 spectrometer with a 25 keV Bi3+ cluster ion source in the pulsed mode for spectra and a gas cluster source using 5 keV Ar1000+ gas cluster ion beam for sputtering. Sputtering was done at a dose of 1.27 × 10¹² ions/cm2 per sputter cycle using a 1 nA beam rastered over a 700 μm × 700 μm area for 1 s. Positive ion spectra were collected with a current of 0.05 pA and a dose of 6 × 10¹⁰ ions/cm2 over a 100 μm × 100 μm area at the center of the sputter crater. The spectra were mass calibrated using the CH3+, C2H3+, C3H5+, C4H7+, and C6H9+ peaks. Calibration errors were kept below 30 ppm. Mass resolution (m/Δm) at m/z 25 was 4000. Data analysis was performed within the SurfaceLab software.
E. Near-edge x-ray absorption fine structure
NEXAFS spectra were collected at the National Synchrotron Light Source (NSLS) U7A beamline at Brookhaven National Laboratory, using an elliptically polarized beam with ∼85% p-polarization. This beamline is equipped with a monochromator (600 lines/mm grating), which provides a full width at half-maximum resolution of ∼0.15 eV at the carbon K-edge. At the carbon K-edge, the monochromator energy scale was calibrated using the intense C 1s − π* transition at 285.35 eV of a graphite transmission grid placed in the path of the x-rays. Partial electron yield was monitored by a detector with the bias voltage maintained at −150 V. Samples were mounted to allow rotation and changing the angle between the sample surface and the synchrotron x-rays. The NEXAFS angle is defined as the angle between the incident light and the sample surface.
III. RESULTS AND DISCUSSION
A. UHV stable model membrane
SAMs on gold surfaces have been used to prepare well-defined substrates for UHV experiments with peptides before.12,25–28 The idea of the FMST SAM is that peptides can, in principle, also intercalate and insert into the SAM more easily. For this strategy, the FMST surface coverage is a very important parameter, as certain threshold of packing density must be reached to form a proper model membrane. At lower density, the model membrane is unstable, as the SAM is unordered and binds with a strongly inclined geometry. The packing density also affects the hydrophobic thickness of the model membrane along surface normal and will change the chemical composition at the exposed surface. However, at a sufficiently high surface coverage, FMST units are expected to adopt a well packed and ordered conformation. However, this upright binding geometry can lead to a reduced mobility of the hydrocarbon chains and reduce the insertion of proteins.
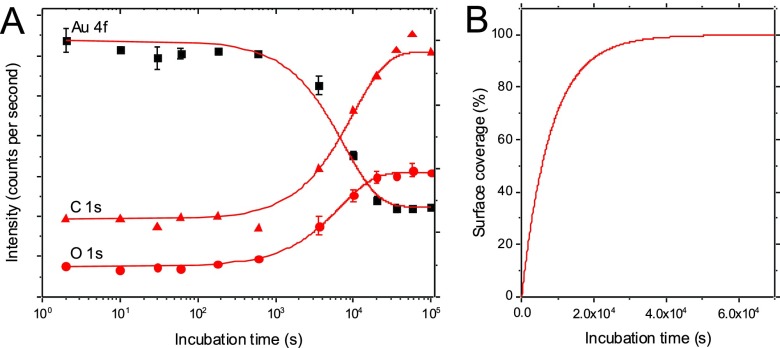
XPS was used to follow the packing density of the SAM as a function of incubation time in a 1 μM FMST thiol solution in ethanol. Figure 1 shows the XPS adsorption kinetics for the carbon, oxygen, and gold. The signals for carbon and oxygen start to increase significantly at incubation times of 1000 s and saturate after around 5 × 10⁴ s. At the same time, the gold signal is gradually decreasing because of progressive attenuation by the SAM overlayer.29 The film thickness of the full coverage layer was determined to be 41.3 Å on the basis of the intensities of the C 1 s and the Au 4f emissions.30 In this study, we used high density FMST SAMs with a surface coverage of 100%. Another possible application of FMST SAMs, which was not used here, is to prepare low density FMST SAM films first and then backfill them with regular lipids. This way the FMST SAM layer will anchor the model bilayer to the surface and can provide a lateral template for untethered lipids. The XPS kinetics shown in Fig. 1 provides all information required to conveniently control the FMST surface coverage via incubation time for preparing mixed model membranes.
Fig. 1.
XPS results following the growth of the self-assembled monolayer. (a) XPS signal intensity of the Au 4f, C 1s, and O 1s peaks at different incubation times of the membrane spanning tether molecule and (b) the subsequently derived calculated surface coverage.
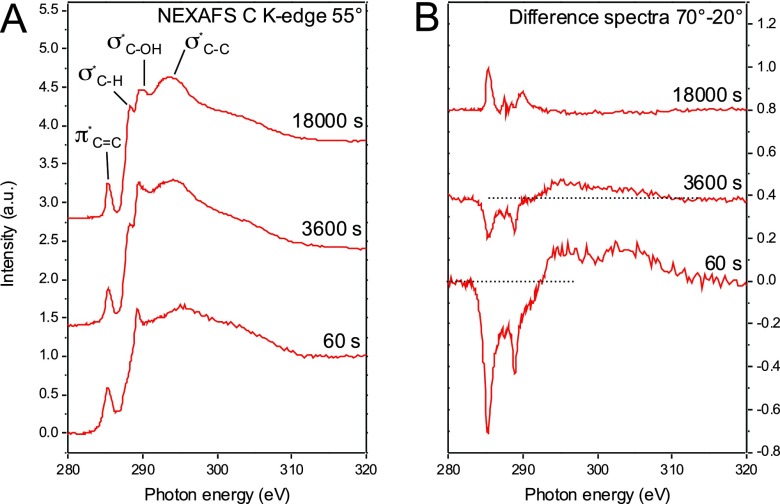
NEXAFS spectroscopy has the ability to detect the presence and the orientation of specific chemical bonds on surfaces.13 By varying the x-ray angle of incidence the orientation of molecules and functional groups on surfaces can be derived. The molecular alignment is determined by observation of the linear dichroism of x-ray absorption. This effect can be monitored by recording spectra at normal and glancing incidence angles, while spectra collected at 55°—the so-called magic angle of NEXAFS—are not affected by molecular order and are only representative of the electronic structure of the surface. Figure 2(a) shows NEXAFS spectra of FMST SAMs incubated for 60, 3600, and 18 000 s. With increasing incubation time, signals for SAM-related bonds such as σ*C–C (around 294 eV),31 σ*C–H (around 288 eV),32,33 and σ*C–O (around 290 eV) become more prominent. All spectra also show a π* resonance near 285 eV related to the aromatic rings.34,35
Fig. 2.
NEXAFS spectra of the carbon K-edge. Spectra presented were collected at x-ray incidence angles of 20°, 55°, and 70° for self-assembled monolayer of the full membrane spanning tether molecule after incubation times of 60, 3600, or 18 000 s.
Difference spectra [Fig. 2(b)] of spectra collected at 70° (near normal) and 20° (glancing) show that with increasing incubation time (increasing surface density) the FMST molecules align themselves toward the surface normal. At 60 s incubation time, the dichroism has a strong negative polarity for both the σ*C–H and the π* resonances, indicating an orientation of aliphatic chains and phenyl rings parallel to the surface. Such a “striped phase” geometry has also been observed for other SAMs.36 The negative dichroism becomes weaker after 3600 s and then after 18 000 s incubation time, the polarity of the dichroism is inverted—the FMST molecules assume an upright orientation at high packing densities.
B. SAP(E) at model membranes
1. SAP(E) surface coverage
The adsorption of SAP(E) to FMST SAMs was followed by XPS. Table I shows the XPS-determined elemental composition before and after adsorption of SAP(E) onto a full coverage FMST SAM. The elemental composition of the SAM incubated with SAP(E) shows a slightly increased carbon and increased oxygen concentration. In addition, 1.5% nitrogen are detected for the SAP(E) adsorbed film showing the peptide is binding to the FMST SAM. The nitrogen content is lower than concentrations observed for full peptide monolayers. Based on published XPS data for monolayers of similar size peptides the surface coverage of SAP(E) can be estimated to be ∼24% of a monolayer.25
Table I.
Summary of XPS determined elemental compositiona for the FMST lipid tether on gold.
| C | N | S | 0 | |
|---|---|---|---|---|
| Theoretical composition | 85.0 | 0 | 1.6 | 13.4 |
| Expt. composition FMST SAM | 87.3 (2.3) | 0 | n.d.b | 12.7 (1.1) |
| Expt. composition FMST SAM + SAP(E) | 83.8 (2.1) | 1.5 (0.3) | n.d.b | 14.7 (1.0) |
Values in atomic percentage with experimental errors in parentheses.
Not detected.
2. ToF-SIMS
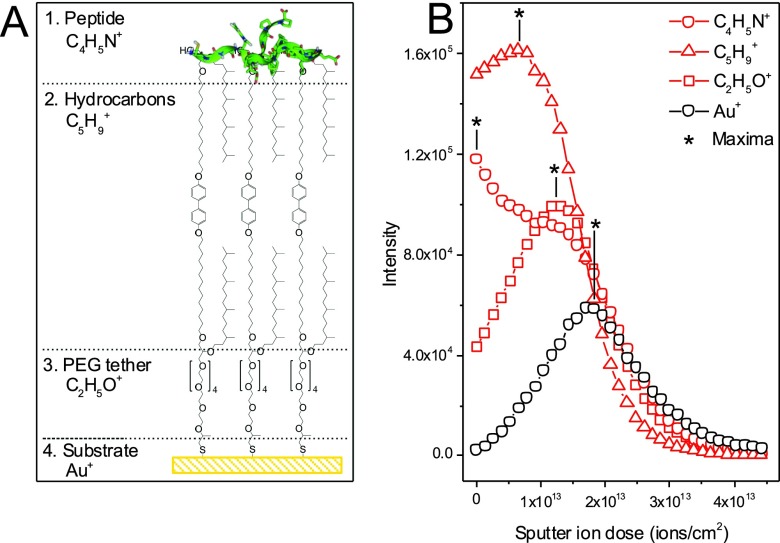
A chemical depth profile of the peptide/lipid bilayer interface was carried out using ToF-SIMS. From a chemical point-of-view, the prepared sample can be divided into four different regions: the peptide, the hydrocarbon layer, the PEG tether, and the gold surface [Fig. 3(a)].
Fig. 3.
(a) Schematic drawing of proposed surface structure and (b) ToF-SIMS depth profile results. Selected peaks are shown for the peptide (C4H5N+), hydrocarbon from the lipid layer (C5H9+), PEG spacer (C2H5O+), and the gold substrate (Au+). The Au signal has been scaled by 2× to make it more visible in the figure.
Figure 3(b) shows the ToF-SIMS depth profile results for peaks characteristic of the peptide (C4H5N+), hydrocarbon from the lipid layer (C5H9+), PEG spacer (C2H5O+), and the gold substrate (Au+). The peptide peak was chosen since it is a typical fragment from both leucine and proline, which makes up 12 of the 22 amino acids in the peptide. The hydrocarbon fragment was chosen as it showed a trend expected based on the layer structure. It is noted that the behavior of the hydrocarbon peaks was complicated since there is likely hydrocarbons adsorbed to the gold substrate, hydrocarbons within the lipid layer, hydrocarbons that can result from amino acid fragmentation, and likely hydrocarbons adsorbed to the top of the surface.
As seen in the figure, the trends in the depth profile support the hypothesis that the peptide is located predominately at the top of the lipid layer. This is shown by the fact that signal from the peptide (C4H5N+) starts high at the surface and then decreases throughout the profile. However, based on the gradual decrease seen in the peptide signal, it is possible that some peptide is also located throughout the lipid layer or that the signal is gradually decreasing due to ion induced mixing caused by the bismuth analysis beam. Shortly after the initial decrease of the peptide signal, the hydrocarbon signal from the lipid layer (C5H9+) is shown to increase followed by an increase in the PEG signal (C2H5O+) and finally the rise in the gold signal at the end of the profile. It should be noted that there could be significant changes in the sputter rate throughout this layer since it is relatively thin and it is known that the sputter rates of materials can change as the beam approaches an interface. Though further work would be required to optimize the data collection and more fully understand the data, the ToF-SIMS results are consistent with the results from the other methods used to analyze these surfaces.
3. XPS depth profiling
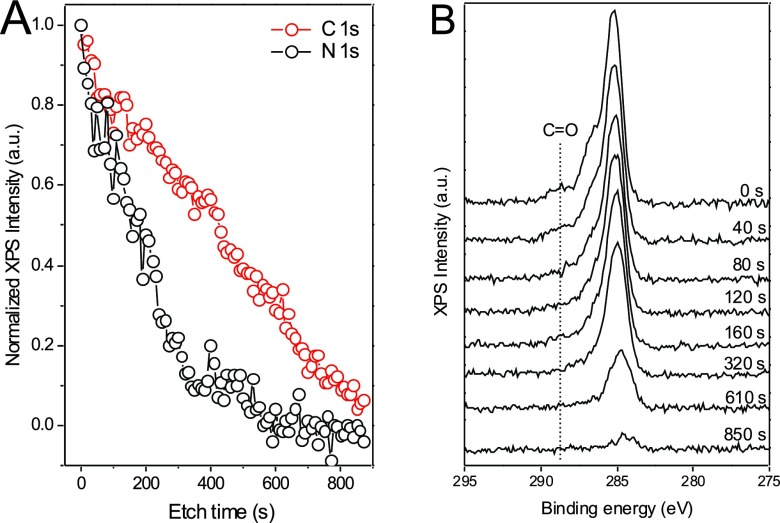
The peptide concentration throughout the film was also determined with XPS depth profiling using argon cluster sputtering. Figure 4(a) shows the normalized intensities of the N 1s and C 1s XPS signals as a function of the etch time. The C 1s signal decreases at a continuous sputter rate of 0.10 ± 0.01 Å/s (assuming a total film thickness of ∼10 nm), which is not surprising since all film components (peptide, aliphatic chains, and PEG) contain carbon. The nitrogen signal, which is unique to the peptide within the film, decreases much faster. The initial sputter rate is approximately 0.24 ± 0.02 Å/s. The signal quickly levels off after a 300 s etch time and is not detectable past 580 s. The small signal observed after 300 s is likely caused by layer mixing and some peptides and peptide fragments being spread through the film due to the sputtering process. Since significant nitrogen signal is only detected for the top ∼30% of the film, the peptide is likely located mostly in the outermost regions of the bilayer model in agreement with the ToF-SIMS profiles. This view is corroborated by C 1 s spectra for different sputter times shown in Fig. 4(b). The C 1s spectra exhibit the main emission near 285.0 eV related to aliphatic and aromatic C–H bonds and two shoulders near 286.4 and 288.5 eV related to C–O and C=O bonds, respectively. The C=O signal is unique to the peptide amide bonds and can be used as an additional marker for the concentration of peptides. For etch times longer than 320 s, the C=O intensity is no longer detectable. Both the N 1s and the C=O signal levels effectively trace the amount of peptide found in the respective film layer.
Fig. 4.
XPS depth profiling. (a) Normalized XPS intensities of N 1s and C 1s peaks as a function of etch time. (b) Changes of the C 1s peak with etch time.
IV. SUMMARY
We have shown that full membrane spanning SAMs prepared from FMST can be used as simplified mimics of lipid bilayers and allow the investigation of CPP–membrane interactions under UHV conditions. The combination of XPS and ToF-SIMS depth profiling allows the determination of the amount of CPPs adsorbed and, most importantly, it provides information about the location of CPPs within the membrane. The data show that SAP(E) binds to the FMST SAM. XPS and ToF-SIMS depth profiling with argon clusters showed that the CPP is mostly located near the SAM-vacuum interface. Direct insertion of the peptide into the model membrane is not observed, which supports the previously proposed endocytic uptake mechanism. However, the insertion processes can be severely hindered by the high-density of the FMST SAM. While the main focus of this work was the development of tools to evaluate the z-resolution limits for both the XPS and ToF-SIMS depth profiling, future studies should focus on (1) lower-density FMST SAMs mixed with untethered lipids for a more flexible and physiological environment for protein or peptide insertion and (2) optimization of sputter cycle length, cluster size, and cluster kinetic energy to further improve the quality of depth profiling information about nanometer thin biological interfaces.
ACKNOWLEDGMENTS
J.F. and T.W. thank Hao Lu for help with the XPS thickness determination and the Deutsche Forschungsgemeinschaft (WE 4478/2-1) and European Union Marie Curie Program for support of this work (CIG grant #322124). This work is part of the research program of the Max Planck Society. J.F. gratefully acknowledges support by the International Max Planck Research School. D.J.G. and D.G.C. thank grant EB-002027 from the U.S. National Institutes of Health for support of the ToF-SIMS experiments. NEXAFS spectra were collected at the National Synchrotron Light Source (NSLS), Brookhaven National Laboratory, which was supported by the U.S. Department of Energy, Division of Materials Science and Division of Chemical Sciences.
References
- 1.Conboy J. C., Liu S., O'Brien D. F., and Saavedra S. S., Biomacromolecules 4, 841 (2003). 10.1021/bm0256193 [DOI] [PubMed] [Google Scholar]
- 2.Michel R.et al. , Langmuir 24, 4901 (2008). 10.1021/la800037r [DOI] [PMC free article] [PubMed] [Google Scholar]
- 3.Knoll W., Köper I., Naumann R. L., and Sinner E.-K., Electrochim. Acta 53, 6680 (2008). 10.1016/j.electacta.2008.02.121 [DOI] [Google Scholar]
- 4.Ratner B. D. and Castner D. G., Surface Analysis—The Principal Techniques, edited by Vickerman J. C. and Gilmore I. ( Wiley, Chichester, 2009), pp. 47–112. [Google Scholar]
- 5.Baio J. E., Weidner T., Interlandi G., Mendoza-Barrera C., Canavan H. E., Michel R., and Castner D. G., J. Vac. Sci. Technol., B 29, 4D113 (2011). 10.1116/1.3613919 [DOI] [PMC free article] [PubMed] [Google Scholar]
- 6.Belu A. M., Graham D. J., and Castner D. G., Biomaterials 24, 3635 (2003). 10.1016/S0142-9612(03)00159-5 [DOI] [PubMed] [Google Scholar]
- 7.Baio J. E., Weidner T., and Castner D. G., Proteins at Interfaces III, edited by Horbett T. A. and Brash J. L. ( American Chemical Society, Washington, D.C.2013), pp. 761–779. [Google Scholar]
- 8.Baio J. E., Weidner T., Baugh L., Gamble L. J., Stayton P. S., and Castner D. G., Langmuir 28, 2107 (2012). 10.1021/la203907t [DOI] [PMC free article] [PubMed] [Google Scholar]
- 9.Baugh L., Weidner T., Baio J. E., Nguyen P. C., Gamble L. J., Stayton P. S., and Castner D. G., Langmuir 26, 16434 (2010). 10.1021/la1007389 [DOI] [PMC free article] [PubMed] [Google Scholar]
- 10.Baio J. E., Cheng F., Ratner D. M., Stayton P. S., and Castner D. G., J. Biomed. Mater. Res. A 97A, 1 (2011). 10.1002/jbm.a.33025 [DOI] [PMC free article] [PubMed] [Google Scholar]
- 11.Baio J. E., Weidner T., Samuel N. T., McCrea K., Baugh L., Stayton P. S., and Castner D. G., J. Vac. Sci. Technol., B 28, C5D1 (2010). 10.1116/1.3456176 [DOI] [PMC free article] [PubMed] [Google Scholar]
- 12.Baio J. E., Weidner T., Ramey D., Pruzinsky L., and Castner D. G., Biointerphases 8, 18 (2013). 10.1186/1559-4106-8-18 [DOI] [PMC free article] [PubMed] [Google Scholar]
- 13.Stöhr J., NEXAFS Spectroscopy ( Springer-Verlag, Berlin, 2000). [Google Scholar]
- 14.Weidner T., Dubey M., Breen N. F., Ash J., Baio J. E., Jaye C., Fischer D. A., Drobny G. P., and Castner D. G., J. Am. Chem. Soc. 134, 8750 (2012). 10.1021/ja301711w [DOI] [PMC free article] [PubMed] [Google Scholar]
- 15.Koren E. and Torchilin V. P., Trends Mol. Med. 18, 385 (2012). 10.1016/j.molmed.2012.04.012 [DOI] [PubMed] [Google Scholar]
- 16.Milletti F., Drug Discovery Today 17, 850 (2012). 10.1016/j.drudis.2012.03.002 [DOI] [PubMed] [Google Scholar]
- 17.Madani F., Lindberg S., Langel U., Futaki S., and Graslund A., J. Biophys. 2011, 414729. 10.1155/2011/414729 [DOI] [PMC free article] [PubMed] [Google Scholar]
- 18.Pujals S., Fernandez-Carneado J., Lopez-Iglesias C., Kogan M. J., and Giralt E., Biochim. Biophys. Acta 1758, 264 (2006). 10.1016/j.bbamem.2006.01.006 [DOI] [PubMed] [Google Scholar]
- 19.Conner S. D. and Schmid S. L., Nature 422, 37 (2003). 10.1038/nature01451 [DOI] [PubMed] [Google Scholar]
- 20.Pujals S. and Giralt E., Adv. Drug Delivery Rev. 60, 473 (2008). 10.1016/j.addr.2007.09.012 [DOI] [PubMed] [Google Scholar]
- 21.Scocchi M., Tossi A., and Gennaro R., Cell Mol. Life Sci. 68, 2317 (2011). 10.1007/s00018-011-0721-7 [DOI] [PMC free article] [PubMed] [Google Scholar]
- 22.Martin I., Teixido M., and Giralt E., ChemBioChem 12, 896 (2011). 10.1002/cbic.201000679 [DOI] [PubMed] [Google Scholar]
- 23.Lelle M., Frick S. U., Steinbrink K., and Peneva K., J. Pept. Sci. 20, 323 (2014). 10.1002/psc.2617 [DOI] [PubMed] [Google Scholar]
- 24.Pelkmans L. and Helenius A., Traffic 3, 311 (2002). 10.1034/j.1600-0854.2002.30501.x [DOI] [PubMed] [Google Scholar]
- 25.Apte J. S., Collier G., Latour R. A., Gamble L. J., and Castner D. G., Langmuir 26, 3423 (2010). 10.1021/la902888y [DOI] [PMC free article] [PubMed] [Google Scholar]
- 26.Weidner T., Apte J. S., Gamble L. J., and Castner D. G., Langmuir 26, 3433 (2010). 10.1021/la903267x [DOI] [PMC free article] [PubMed] [Google Scholar]
- 27.Breen N. F., Weidner T., Li K., Castner D. G., and Drobny G. P., J Am. Chem. Soc. 131, 14148 (2009). 10.1021/ja905382m [DOI] [PMC free article] [PubMed] [Google Scholar]
- 28.Fears K. P., Clark T. D., and Petrovykh D. Y., J. Am. Chem. Soc. 135, 15040 (2013). 10.1021/ja404346p [DOI] [PubMed] [Google Scholar]
- 29.Thome J., Himmelhaus M., Zharnikov M., and Grunze M., Langmuir 14, 7435 (1998). 10.1021/la9808317 [DOI] [Google Scholar]
- 30.Lamont C. L. A. and Wilkes J., Langmuir 15, 2037 (1999). 10.1021/la981168p [DOI] [Google Scholar]
- 31.Outka D. A., Stöhr J., Rabe J. P., and Swalen J. D., J. Chem. Phys. 88, 4076 (1988). 10.1063/1.453862 [DOI] [Google Scholar]
- 32.Väterlein P., Fink R., Umbach E., and Wurth W., J. Chem. Phys. 108, 3313 (1998). 10.1063/1.475729 [DOI] [Google Scholar]
- 33.Weiss K., Bagus P. S., and Wöll C., J. Chem. Phys. 111, 6834 (1999). 10.1063/1.479976 [DOI] [Google Scholar]
- 34.Wacker D., Weiss K., Kazmaier U., and Wöll C., Langmuir 13, 6689 (1997). 10.1021/la970205u [DOI] [Google Scholar]
- 35.Himmel H.-J., Terfort A., and Wöll C., J. Am. Chem. Soc. 120, 12069 (1998). 10.1021/ja981872s [DOI] [Google Scholar]
- 36.Schreiber F., Prog. Surf. Sci. 65, 151 (2000). 10.1016/S0079-6816(00)00024-1 [DOI] [Google Scholar]


