

Abstract
It has long been known that solvation plays an important role in protein-protein interactions. Here, we use a minimalistic solvation-based model for predicting protein binding energy to estimate quantitatively the contribution of the solvation factor in protein binding. The factor is described by a simple linear combination of buried surface areas according to amino-acid types. Even without structural optimization, our minimalistic model demonstrates a predictive power comparable to more complex methods, making the proposed approach the basis for high throughput applications. Application of the model to a proteomic database shows that receptor-substrate complexes involved in signaling have lower affinities than enzyme-inhibitor and antibody-antigen complexes, and they differ by chemical compositions on interfaces. Also, we found that protein complexes with components that come from the same genes generally have lower affinities than complexes formed by proteins from different genes, but in this case the difference originates from different interface areas. The model was implemented in the software PYTHON, and the source code can be found on the Shakhnovich group webpage: http://faculty.chemistry.harvard.edu/shakhnovich/software.
Main Text
Protein-protein interactions (PPIs), such as those involved in signaling pathways and enzyme-inhibitor interactions, play a fundamental role in biological function and evolution. Thus significant biological insight can be gained by estimating the strength of PPIs in the whole interactome (1). Various methods have been developed to predict binding affinities accurately and quickly, either based on physical force fields (2–4) or molecular dynamics (5,6). Although several recent methods were reported to show high correlation to experiment (7,8), it is still challenging to estimate the precise binding energy of a specific protein complex from first principles, especially at a relatively low computational cost.
To accurately predict the binding energy of two proteins, we need to identify and quantify physical factors that govern binding energy. It has been known (9,10) that major contributors to binding energy are buried surface area (11,12), hot spots (13,14), and allostery (7,15). Some of them are due only to solvation, whereas the others involve specific interactions between protein chains. In this Letter we will analyze the contribution of the solvation factor by investigating the predictive power of PPI binding affinity based solely on the solvation factor using the mean-field approach, and check if this simple model can reveal important chemistry and biology.
Here the solvation factor is modeled by buried surface areas, or changes in accessible surface areas (ΔASAs) during association. It has been reported that ΔASA provides a major contribution to binding free energy, especially when binding is not accompanied by major conformational changes (12). Based on the fact that the contribution to solvation depends on the amino-acid type of residues (13), we classified atomic ΔASAs by their residue types. We have 20 side-chain ΔASA types as well as one backbone ΔASA type; the backbone atoms are considered independently, because their ΔASAs are known to be independently crucial in stabilizing a protein structure (16). The Shrake-Rupley algorithm (17) was employed to compute ASAs, with the probe radius of 1.4 Å. Here we neglect hydrogen atoms.
The target protein set was constructed from 139 complexes extracted from a structure-based benchmark, which provides their corresponding three-dimensional structures and binding affinities (12). Using the fourfold cross-validation method (18), we divided the whole set into four subsets of equal size (Table S1 in the Supporting Material). Then we ran four rounds of training and testing, in each of which the union of three sets serves as a training set and the remaining subset is used as a test set (Fig. S1 in the Supporting Material). In each round, we ran a linear regression using each possible combination of 21 ΔASA terms (that is, 221-1 combinations were investigated for each round), and checked if the combination is “relevant”, based on the correlation coefficient of the regression. A combination is “relevant” if removing any of its constituent ΔASA terms leads to a statistically significant decrease in predictive power compared to random-number terms (Table S5 and Fig. S5).
From each round of different training and test sets, we collected four groups of relevant combinations, and found a common combination, which consists of only three ΔASA terms: ΔASATyr, ΔASASer, and ΔASACys (Table S2). Here
where C = −8.5 kcal/mol, wTyr = −0.0086 kcal/mol/Å2, wSer = −0.014 kcal/mol/Å2, and wCys = −0.032 kcal/mol/Å2. (The numbers have been determined by using the entire dataset.) This model shows the Pearson coefficient R of 0.48 between predicted and observed binding affinities for the whole set of 139 protein complexes, which is unexpectedly high when compared to the known methods, especially considering its simple nature (Table 1 and Fig. S2). The root-mean-squared error is 2.6 kcal/mol, comparable to the root-mean-squared error of 2.25 kcal/mol from ZAPP calculation (19–21). Equivalent error estimates for GA-PLS and BIOQSAR were reported to be 0.8–1.5 kcal/mol (7,8). It should be noted that even though the whole set contains protein complexes with large conformational changes during docking, this model still shows a desirable performance without considering such allosteric effects.
Table 1.
Comparison of the Pearson coefficient R among various methods, where the same data set (12) is used
| Method | R | Feature | Ref. |
|---|---|---|---|
| MARS | 0.52 | Machine learning | (20) |
| ZAPP | 0.63 | Regression with nine terms | (19) |
| GA-PLS | 0.83 | Consideration of allostery | (7) |
| BIOQSAR | 0.82–0.88 | Machine learning | (8) |
| SPA-PP | 0.39 | Statistical potential | (21) |
| ROSETTADOCK | 0.42 | Regression with 11 terms | (21) |
| DFIRE | 0.35 | Statistical potential | (20) |
| PMF | 0.37 | Corrected statistical potential | (20) |
| Interface area | 0.24 | Regression with ΔASAtotal | |
| This work | 0.48 | Solvation only |
This work shows R = 0.48, comparable to traditional methods such as ROSETTADOCK and DFIRE.
We tested the applicability of this simple model to discern structural differences among different types of protein complexes. We extracted representative nonredundant groups (Fig. S6) of various obligatory and transient protein complexes from the PDBePISA database (22) (Table S3): antibody light-heavy chain recognition (LH, 367 complexes), antibody-antigen recognition (AA, 157 complexes), enzyme-inhibitor recognition (EI, 123 complexes), and receptor-substrate recognition (RS, 210 complexes). LH recognition is considered obligatory, while the other three interactions are all known as transient (9,23,24). It has been known that obligatory interactions are generally tighter than the transient interactions (9,23), but we want to quantitatively analyze the differences in binding energies. Our model is used to calculate the binding energy distributions for all four groups (Fig. 1 A).
Figure 1.
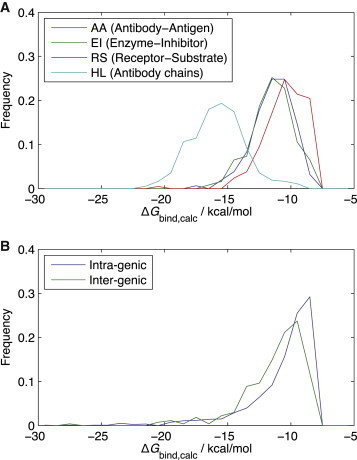
Calculated binding energy distributions in different biochemical contexts and those in different genetic contexts. (A) Binding energy distributions of protein complexes with different biochemical functions: antibody-antigen recognition (AA, blue), enzyme-inhibitor recognition (EI, green), receptor-substrate recognition (RS, red), and heavy-light chain recognition in antibody (HL, cyan). The average binding energies are −11.45, −11.47, −10.52, and −15.78 kcal/mol for AA, EI, RS, and HL complexes, respectively. (B) Binding energy distributions of protein dimers according to genetic origins of components: intragenic (blue) and intergenic (green) interactions from Homo sapiens. The average values are −10.75 kcal/mol for intragenic and −11.28 kcal/mol for intergenic interactions. To see this figure in color, go online.
Note that the distributions generally conform to the previously reported distribution of protein binding energies (25). It is shown that obligatory interactions are stronger than transient ones, as expected. However, among the three transient complexes, the RS complexes turned out to have significantly weaker binding than AA and EI complexes. This quantitative difference can be explained by different natures of AA/EI and RS interactions. The functions of AA/EI binding are mostly to bind to their partners as tightly as possible. In contrast, receptor-substrate binding shows weaker interaction because binding partners should easily associate or dissociate to regulate activity (24). Similar results were attained from more accurate yet computationally extensive ZAPP calculation (Fig. S3 A). We also checked distributions of contact counts, and found that the difference between obligatory and transient interactions is mainly due to the interface area, whereas the difference between AA/EI and RS mostly comes from amino-acid compositions of the interfaces (Fig. S4 A).
Another interesting comparison is between complexes of protein domains coming from the same gene and those from different genes. (To our knowledge, there has been no previous study to compare their binding energy distributions quantitatively.) We focused on the dimers from Homo sapiens because they comprise the largest set in the PDB and created two different nonredundant groups of protein dimers (22) (Table S4). These dimers were classified as either intragenic (1213 complexes) or intergenic (270 complexes). An interaction between two components of a dimer is considered intragenic when they are from the same open reading frame, which is tagged by a unique UniProt ID (26). Otherwise, the interaction is intergenic.
The binding energy distributions of these groups reveal that intergenic interactions are significantly stronger than intragenic ones (Fig. 1 B). The trend was also reproduced by ZAPP calculation (Fig. S3 B). This is presumably due to an entropic cost of finding their binding partners, which must be compensated by stronger binding. In other words, intragenic complexes have their components in spatial proximity when synthesized, while intergenic complexes need to search the subunits to be assembled. From the contact count distributions, we found the reason why intra- and intergenic interactions are different: mainly the interface areas (Fig. S4 B).
In this Letter we have shown that solvation alone, represented by the change in accessible surface area, contributes significantly to binding energy of protein complexes. The simple model has also shown its ability to reveal important aspects of chemistry and biology of PPIs on the whole proteome scale. We expect the simple predictor of PPI binding affinity presented in this study to be used in future proteomics studies of physics and evolution of protein complexes, such as more realistic simulations of mass action dynamics in PPI networks of a variety of organisms (27).
Acknowledgments
We thank Ka Yeon Kook and Juyong Lee for helpful discussions on statistical treatments and Amy I. Gilson and Nicolas Chéron for their help in the preparation of the manuscript. We appreciate Thom Vreven for his help in the ZAPP calculation.
This work was supported by Defense Advanced Research Projects Agency grant No. HR0011-11-C-0093 and National Science Foundation grant No. MCB-1243837.
Supporting Material
References
- 1.Bonetta L. Protein-protein interactions: interactome under construction. Nature. 2010;468:851–854. doi: 10.1038/468851a. [DOI] [PubMed] [Google Scholar]
- 2.Kortemme T., Baker D. A simple physical model for binding energy hot spots in protein-protein complexes. Proc. Natl. Acad. Sci. USA. 2002;99:14116–14121. doi: 10.1073/pnas.202485799. [DOI] [PMC free article] [PubMed] [Google Scholar]
- 3.Guerois R., Nielsen J.E., Serrano L. Predicting changes in the stability of proteins and protein complexes: a study of more than 1000 mutations. J. Mol. Biol. 2002;320:369–387. doi: 10.1016/S0022-2836(02)00442-4. [DOI] [PubMed] [Google Scholar]
- 4.Gao Y., Wang R., Lai L. Structure-based method for analyzing protein-protein interfaces. J. Mol. Model. 2004;10:44–54. doi: 10.1007/s00894-003-0168-3. [DOI] [PubMed] [Google Scholar]
- 5.Huo S., Massova I., Kollman P.A. Computational alanine scanning of the 1:1 human growth hormone-receptor complex. J. Comput. Chem. 2002;23:15–27. doi: 10.1002/jcc.1153. [DOI] [PubMed] [Google Scholar]
- 6.Rajamani D., Thiel S., Camacho C.J. Anchor residues in protein-protein interactions. Proc. Natl. Acad. Sci. USA. 2004;101:11287–11292. doi: 10.1073/pnas.0401942101. [DOI] [PMC free article] [PubMed] [Google Scholar]
- 7.Tian F., Lv Y., Yang L. Structure-based prediction of protein-protein binding affinity with consideration of allosteric effect. Amino Acids. 2012;43:531–543. doi: 10.1007/s00726-011-1101-1. [DOI] [PubMed] [Google Scholar]
- 8.Zhou P., Wang C., Huang J. Biomacromolecular quantitative structure-activity relationship (BIOQSAR): a proof-of-concept study on the modeling, prediction and interpretation of protein-protein binding affinity. J. Comput. Aided Mol. Des. 2013;27:67–78. doi: 10.1007/s10822-012-9625-3. [DOI] [PubMed] [Google Scholar]
- 9.Keskin O., Gursoy A., Nussinov R. Principles of protein-protein interactions: what are the preferred ways for proteins to interact? Chem. Rev. 2008;108:1225–1244. doi: 10.1021/cr040409x. [DOI] [PubMed] [Google Scholar]
- 10.Kastritis P.L., Bonvin A.M.J.J. On the binding affinity of macromolecular interactions: daring to ask why proteins interact. J. R. Soc. Interface. 2013;10:20120835. doi: 10.1098/rsif.2012.0835. [DOI] [PMC free article] [PubMed] [Google Scholar]
- 11.Eisenberg D., McLachlan A.D. Solvation energy in protein folding and binding. Nature. 1986;319:199–203. doi: 10.1038/319199a0. [DOI] [PubMed] [Google Scholar]
- 12.Kastritis P.L., Moal I.H., Janin J. A structure-based benchmark for protein-protein binding affinity. Protein Sci. 2011;20:482–491. doi: 10.1002/pro.580. [DOI] [PMC free article] [PubMed] [Google Scholar]
- 13.Moreira I.S., Fernandes P.A., Ramos M.J. Hot spots—a review of the protein-protein interface determinant amino-acid residues. Proteins. 2007;68:803–812. doi: 10.1002/prot.21396. [DOI] [PubMed] [Google Scholar]
- 14.Carbonell P., Nussinov R., del Sol A. Energetic determinants of protein binding specificity: insights into protein interaction networks. Proteomics. 2009;9:1744–1753. doi: 10.1002/pmic.200800425. [DOI] [PMC free article] [PubMed] [Google Scholar]
- 15.Goh C.-S., Milburn D., Gerstein M. Conformational changes associated with protein-protein interactions. Curr. Opin. Struct. Biol. 2004;14:104–109. doi: 10.1016/j.sbi.2004.01.005. [DOI] [PubMed] [Google Scholar]
- 16.Bolen D.W., Rose G.D. Structure and energetics of the hydrogen-bonded backbone in protein folding. Annu. Rev. Biochem. 2008;77:339–362. doi: 10.1146/annurev.biochem.77.061306.131357. [DOI] [PubMed] [Google Scholar]
- 17.Shrake A., Rupley J.A. Environment and exposure to solvent of protein atoms. Lysozyme and insulin. J. Mol. Biol. 1973;79:351–371. doi: 10.1016/0022-2836(73)90011-9. [DOI] [PubMed] [Google Scholar]
- 18.Clarke B., Fokoué E., Zhang H.H. Springer; New York: 2009. Principles and Theory for Data Mining and Machine Learning. [Google Scholar]
- 19.Vreven T., Hwang H., Weng Z. Prediction of protein-protein binding free energies. Protein Sci. 2012;21:396–404. doi: 10.1002/pro.2027. [DOI] [PMC free article] [PubMed] [Google Scholar]
- 20.Moal I.H., Agius R., Bates P.A. Protein-protein binding affinity prediction on a diverse set of structures. Bioinformatics. 2011;27:3002–3009. doi: 10.1093/bioinformatics/btr513. [DOI] [PubMed] [Google Scholar]
- 21.Yan Z., Guo L., Wang J. Specificity and affinity quantification of protein-protein interactions. Bioinformatics. 2013;29:1127–1133. doi: 10.1093/bioinformatics/btt121. [DOI] [PubMed] [Google Scholar]
- 22.Krissinel E., Henrick K. Inference of macromolecular assemblies from crystalline state. J. Mol. Biol. 2007;372:774–797. doi: 10.1016/j.jmb.2007.05.022. [DOI] [PubMed] [Google Scholar]
- 23.Nooren I.M.A., Thornton J.M. Diversity of protein-protein interactions. EMBO J. 2003;22:3486–3492. doi: 10.1093/emboj/cdg359. [DOI] [PMC free article] [PubMed] [Google Scholar]
- 24.Janin J., Rodier F., Bahadur R.P. Macromolecular recognition in the Protein Data Bank. Acta Crystallogr. D Biol. Crystallogr. 2007;63:1–8. doi: 10.1107/S090744490603575X. [DOI] [PMC free article] [PubMed] [Google Scholar]
- 25.Zhang J., Maslov S., Shakhnovich E.I. Constraints imposed by non-functional protein-protein interactions on gene expression and proteome size. Mol. Syst. Biol. 2008;4:210. doi: 10.1038/msb.2008.48. [DOI] [PMC free article] [PubMed] [Google Scholar]
- 26.UniProt Consortium Reorganizing the protein space at the Universal Protein Resource (UniProt) Nucleic Acids Res. 2012;40:D71–D75. doi: 10.1093/nar/gkr981. [DOI] [PMC free article] [PubMed] [Google Scholar]
- 27.Maslov S., Ispolatov I. Propagation of large concentration changes in reversible protein-binding networks. Proc. Natl. Acad. Sci. USA. 2007;104:13655–13660. doi: 10.1073/pnas.0702905104. [DOI] [PMC free article] [PubMed] [Google Scholar]
Associated Data
This section collects any data citations, data availability statements, or supplementary materials included in this article.