

Abstract
Biophysical understanding of membrane domains requires accurate knowledge of their structural details and elasticity. We report on a global small angle x-ray scattering data analysis technique for coexisting liquid-ordered (Lo) and liquid-disordered (Ld) domains in fully hydrated multilamellar vesicles. This enabled their detailed analysis for differences in membrane thickness, area per lipid, hydrocarbon chain length, and bending fluctuation as demonstrated for two ternary mixtures (DOPC/DSPC/CHOL and DOPC/DPPC/CHOL) at different cholesterol concentrations. Lo domains were found to be ∼10 Å thicker, and laterally up to 20 Å2/lipid more condensed than Ld domains. Their bending fluctuations were also reduced by ∼65%. Increase of cholesterol concentration caused significant changes in structural properties of Ld, while its influence on Lo properties was marginal. We further observed that temperature-induced melting of Lo domains is associated with a diffusion of cholesterol to Ld domains and controlled by Lo/Ld thickness differences.
Introduction
Since the formulation of the raft model in 1997 by Simons and Ikonen (1) significant scientific efforts have been devoted to the characterization of physical properties of liquid-disordered Ld and liquid-ordered Lo domains (2–11). Membrane rafts are thought to be small (nanoscopic) and highly dynamic platforms enriched in sphingolipids and cholesterol, enabling diverse cellular functions, but have so far escaped any direct visualization in live cells (5,12). Hence, the existence of rafts remains a highly controversial issue. For example Frisz et al. (13,14), using secondary ion mass spectrometry on fibroblasts, observed sphingolipid domains, in which cholesterol was evenly distributed throughout the membrane, thus challenging the standard raft hypotheses.
In contrast to natural membranes, domains in lipid-only systems can grow up to several micrometers in size, enabling their detection (e.g., by optical microscopy (15)) and study with respect to the physics pertaining to their stability, size, or effect on protein sorting, to name but a few examples (8). One of the parameters involved in, e.g., protein sorting, is the difference in thickness between the Lo and Ld domains and the corresponding match to the protein’s transmembrane region (see, e.g., Killian (16) and Pabst (17)).
To address these issues, diverse experimental and theoretical techniques have been employed to explore structural and elastic properties of Lo/Ld phases (see, e.g., the literature (18–32)). Scattering experiments are of particular interest in this respect, because they allow for a label-free determination of membrane structure and dynamics (33). However, contrast between Lo and Ld domains is low. This can be addressed, for example, by contrast variation, using neutron scattering (34). In recent years, this technique has been used largely by Katsaras and coworkers, showing, e.g., the coupling of domain size and membrane thickness mismatch between Lo and Ld (35).
Alternatively, early x-ray experiments used Triton X-100 (Dow Chemical, Midland, MI) to separate detergent-resistant from detergent-soluble membranes, respectively (22). However, the application of detergents on membranes may adversely influence the mixing behavior of membrane lipids (36), limiting the applicability of this approach.
Another possibility, which is being explored in this work, makes use of the experimental finding that macroscopic domains are typically in registry in multilamellar systems (see, e.g., Chen et al. (28), Tayebi et al. (37), and Karmakar et al. (38)), meaning: Lo and Ld domains form lamellar lattices with distinct Bragg peaks. The challenges to be met here are 1) overlapping Lo/Ld Bragg reflections, in particular at low scattering angles; and 2) the small number of solid orders (only 2–3) displayed by Ld phases in fully hydrated multilamellar vesicles (MLVs), limiting the structural information content when only Bragg peak intensities are analyzed (39).
The latter issue is particularly well known for single-phase fluid bilayers, and has led to the development of a global SAXS data analysis technique that takes into account both Bragg peaks and diffuse scattering (39). Most recently, we have advanced the technique by incorporating the scattering density profile (SDP) model (40), enabling us to determine membrane structure and bending fluctuations from homogeneous MLVs at high resolution (41).
To access coexisting fluid domains in MLVs, the global SAXS data analysis needs to be further extended. This was achieved in this work by assuming a linear combination of scattering intensities originating from Lo and Ld phases. The method was applied to two ternary mixtures, with the high-melting lipids DPPC (dipalmitoylphosphatidylcholine) or DSPC (distearoylphosphatidylcholine), the low-melting lipid DOPC (dioleoylphosphatidylcholine), and CHOL (cholesterol). Summaries of the studied samples and applied nomenclature are given in Fig. 1 and Table S1 in the Supporting Material.
Figure 1.
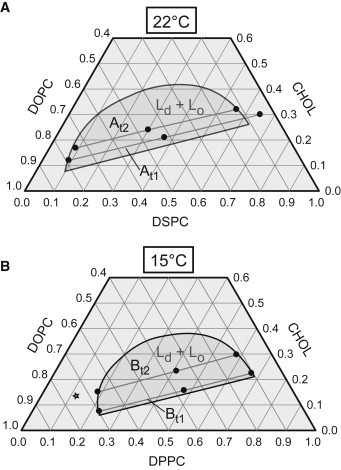
Overview of samples studied in this work. (Solid circles) Their location is shown in previously reported compositional phase diagrams of (A) DOPC/DSPC/CHOL (50) and (B) DOPC/DPPC/CHOL (49). In fluid-fluid phase coexistence regions (dark-shaded areas), demixing into Lo and Ld domains occurs along tielines. Two tielines for each system (At1, At2 and Bt1, Bt2) with three different compositions at the Ld, Lo endpoints and the tieline center were studied (see Table S1 for detailed lipid composition). Note that tieline endpoints for Lo on At1 and Ld on Bt2 (star) are outside previously reported phase boundaries. This is either due to updates in phase boundaries for isolated tielines (At1 (35)) or experiments performed in this study (Bt2, see Results).
We observed distinct structural and elastic properties of Lo and Ld domains as a function of temperature and composition (lipid chain length and cholesterol concentration). Most interestingly, we found that increased cholesterol concentrations reduce the thickness difference between Ld and Lo domains, which leads to a decrease of line tension and in turn promotes the temperature induced melting of Lo domains.
Materials and Methods
Sample preparation
DPPC, DSPC, and DOPC were purchased from Avanti Polar Lipids (Alabaster, AL), and cholesterol was obtained from Sigma-Aldrich (Vienna, Austria). All lipids were used without further purification, with all chemicals being of professional analysis quality. Lipid stock solutions were prepared by dissolving weighted amounts of dry lipid in chloroform/methanol (2:1, v/v) and then mixed at appropriate ratios (see Table S1 for all samples and their corresponding compositions). Subsequently, lipid solutions were dried under a stream of nitrogen and then placed under vacuum for ∼12 h, forming a thin lipid film on the bottom of glass vials. Dry films were hydrated using 18 MΩ/cm water and incubated for 6 h above the main transition temperature of the high-melting lipid (DPPC or DSPC), repetitively cycling vortex-mixing and freeze-thaw procedures using liquid N2. The final lipid concentration for each sample was 50 mg/mL. All samples were prepared at least twice (with a time delay of several weeks) starting from pure lipid powders to check for reproducibility. Lattice constants (d-values) varied by <±0.5%. Furthermore, thin layer chromatography on randomly selected samples revealed no decomposition of the samples into lyso lipids or free fatty acids.
Small angle x-ray scattering
X-ray scattering data were acquired at the Austrian SAXS beamline Elettra Trieste, Trieste, Italy, using 8 keV photons. Diffraction profiles were detected utilizing a Mar300-image-plate detector (MarResearch, Norderstedt, Germany) and calibrated using silver behenate. Lipid dispersions were taken up in 1-mm-thick quartz capillaries and inserted into a multiposition sample holder. All samples were equilibrated for a minimum of 10 min before measurement using a circulating water bath. The exposure time was set to 30 s. Scattering patterns were integrated using the program FIT2D (42). Background scattering originating from capillaries, water, and air was subtracted (43), and data sets were normalized using the transmitted intensity, which was measured by a photodiode placed in the beam stop.
Analysis of coexisting domains
To analyze the scattering profile of MLVs exhibiting Lo/Ld phase coexistence, we adopted the full-q-range model by Heftberger et al. (41) for homogeneous bilayers. For the latter systems, the scattered intensity is given by
| (1) |
where q = 4πsinθ/λ is the scattering vector, λ is the wavelength, 2θ is the scattering angle relative to the incident beam, and Ndiff is the diffuse scattering originating from positionally uncorrelated bilayers. The structure factor S(q) is given by the Caillé theory (39,44–46), yielding access to bending fluctuations via the Caillé parameter
with KC as the bilayer bending rigidity and B as the bulk modulus of interactions (39). The form factor F(q) is the Fourier transform of the electron density profile of a bilayer, described in terms of the SDP model (40).
Neglecting putative cross-correlations between Lo and Ld domains, the scattered intensity of coexisting fluid domains can be modeled by a linear combination of the individual Lo/Ld intensities,
| (2) |
where
and
are the scattering intensities originating from positionally correlated and uncorrelated bilayers, respectively. The subscripts Lo and Ld denote the individual contributions of the domains to S(q) and F(q), and cLd refers to the Ld phase fraction in the sample. Analysis of the scattered intensity of coexisting phases in terms of this model yields bilayer structural parameters and bending fluctuations simultaneously for Lo and Ld. A strict requirement for its application is that domains are in registry in the direction normal to the bilayer plane, meaning: two distinct lamellar lattices need to be observed. This is typically the case for macroscopic domains, observed for example when diunsaturated lipids such as DOPC are used as low-melting membrane component in ternary raftlike mixtures (28,37,38).
The SDP model, used to describe the form factors, parses the bilayer lipids into quasi-molecular fragments and calculates their volume probability distributions. The model was originally designed for determining single lipid component bilayers (40,47). Pan et al. (48) extended the SDP analysis to binary lipid mixtures containing cholesterol. To this end the contribution of cholesterol was merged with that of methylene (CH2) groups, which was recently also applied successfully to homogenous MLVs (41). Because our studied Lo and Ld domains contain different amounts of three lipids, effective lipid molecules were constructed for the SDP description, by first merging the contributions from the unsaturated and saturated lipids and then adding cholesterol to the CH2 regime as described above. Saturated and unsaturated lipids differ with respect to the number of CH2 and methine (CH) groups. Due to the absence of scattering contrast between CH and CH2 for x-rays, these groups can be merged (40,41). Our final parsing approach consisted of five groups for each phase, composed of the following: 1) CholCH3 (Choline methyl), 2) PCN (Phosphate + CH2CH2N), 3) CG (Carbonyl + glycerol) groups, 4) CH2, and 5) CH3 methyl groups at the bilayer center.
This approach is further justified by its compatibility to previously reported molecular dynamics (MD) data (31), as demonstrated in Fig. 2. For details of the functional forms used to describe the individual groups, we refer to the literature (40,41,48). As detailed previously (41), a genetic algorithm was applied for fitting the global model to experimental data.
Figure 2.
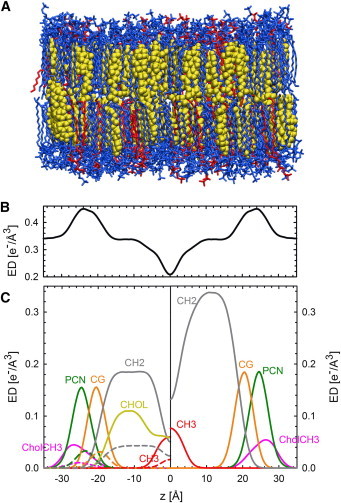
Parsing scheme of ternary lipid mixtures based on MD simulations of an Lo phase of DOPC/DPPC/CHOL (31). (A) Snapshot of the equilibrated system. DPPC lipids, blue; DOPC, red; cholesterol, yellow. (B) Calculated electron density profile. (C) Electron densities of molecular groups, calculated using SIMTOEXP (70). (Left) Individual contributions of DPPC (solid lines) and DOPC (dashed lines) for the CholCH3, PCN, CG, CH2, and CH3 groups. (Yellow line) Contribution of cholesterol. (Right) Condensed parsing scheme after merging individual contributions as detailed in the main text. To see this figure in color, go online.
Membrane structural parameters such as hydrocarbon chain length dC, Luzzati thickness dB, water layer thickness dW, and the area per lipid A = 2VL/dB were defined and calculated from the SDP profiles as described in Heftberger et al. (41). VL is the total lipid volume, which is assumed to be given by the molecular-weighted average
| (3) |
where xi values are the lipid molar ratios in Ld and Lo taken from Uppamoochikkal et al. (49) and Heberle et al. (50), Vi values are the corresponding molecular lipid volumes, and T is the temperature. Temperature-dependent Vi values were calculated according to the method of Koenig and Gawrisch (51), and the volume of cholesterol within lipid bilayers was taken to be 630 Å3 (52). Calculated tieline endpoint VL were in good agreement (<2%) with experimental values determined by dilatometry (Supporting Material). Note that dilatometry yields a globally averaged value for the lipid volume and is thus not able to discern between Lo and Ld in the phase coexistence regime. Thus experimental VL can be obtained for tieline endpoints, only. The temperature dependence of xi was estimated by the lever rule using the experimentally determined Ld and Lo fractions (cLd and 1 − cLd), assuming 1) that the inclination of the tieline remains constant, and 2) that the tieline length changes according to the Lo fraction with temperature (Supporting Material).
Results and Discussion
Establishing the global analysis for two phases
Our strategy to validate this analysis was as follows. 1) We evaluated tieline endpoint SAXS data. At endpoints, either Lo or Ld should exist as a single phase, thus allowing application of our previous analysis for homogeneous MLVs (41). 2) The phase coexistence model was applied to a composition close to the tieline midpoint and the achieved results were compared to endpoint data.
Phase boundaries, in particular, are subject to considerable uncertainties (8,49,53–55), whereas recent tieline orientation data are considered to be more reliable. In this study, we applied previously published compositional phase diagrams from Heberle et al. (50) and Uppamoochikkal et al. (49). Note that Uppamoochikkal et al. (49) used the phase diagram reported by Veatch et al. (54), and constructed tielines using x-ray scattering on oriented lipid films.
Our measurement strategy allowed for an independent check of these data, as follows: 1) Bragg peaks of all samples measured per tieline are required to overlap, if tieline orientation is correct (49); and 2) only a single lamellar lattice should be observed at the phase boundaries.
For all samples, including replicas, Lo/Ld peak positions for tieline midpoints and endpoints matched, reassuring not only tieline orientation data, but also our sample preparation. The Ld endpoints of DOPC/DPPC/CHOL contained significant residual scattering from an Lo phase, revealing errors in the reported phase boundary. However, because Lo peaks overlapped with those of the Lo endpoint, we were able to subtract the Lo contribution (Fig. S1 in the Supporting Material). In independent experiments, using a laboratory x-ray camera, we determined for Bt2 a new Ld endpoint by measuring several samples along the tieline until the Lo contributions vanished. The new endpoint composition is 0.748/0.124/0.128 (Fig. 1); corresponding SAXS data are shown in Fig. S2.
Fig. 3 details the results and analysis of the At1 tieline. The Ld endpoint in this study showed some residual Lo contribution. However, it was small enough to be neglected. Global fits to tieline endpoints and midpoints show that our model is able to capture both the single-phase and two-phase coexistence, respectively. Insets to Fig. 3 show the volume probability distributions of individual quasi-molecular groups (see previous section) for Lo, Ld endpoints and the resulting electron density (ED) profiles for the coexisting case. The absolute ED in the hydrocarbon chain region of the Lo phase is significantly higher than in Ld. This can be explained by the higher amount of cholesterol in the Lo phase, with substantial ED contributions from the sterol ring.
Figure 3.
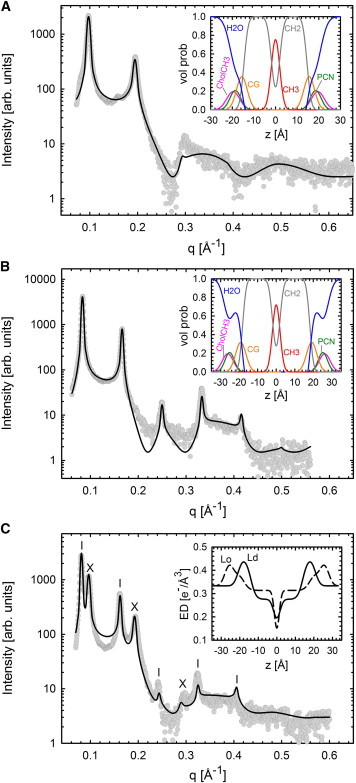
Validation of the global analysis for two coexisting phases for the At1 tieline (T = 22°C). (A and B) Fits to Ld and Lo endpoint data, respectively. (Insets, both panels) Derived volume probability distributions. (C) Best fit to SAXS data at the At1 tieline midpoint. Bragg reflections of Lo (dashes) and Ld (crosses) domains. (Inset) ED profiles for Lo and Ld phases. To see this figure in color, go online.
All structural parameters for coexisting domains agreed remarkably to tieline endpoints (Tables 1 and S2), thereby validating our analysis. For example, the membrane thickness dB for Ld and Lo endpoints is 37.5 and 49.7 Å, respectively. This compares well to dB = 38.1 and 48.6 Å for Ld and Lo in the coexistence regime, meaning: differences are within <1 Å. Note that height differences ΔdB between Ld and Lo domains are in the same range as those reported between detergent-resistant and detergent-soluble membranes (22).
Table 1.
Structural results and bending fluctuations for coexisting Ld/Lo domains
| Term | dB | A | dW | dC | η |
|---|---|---|---|---|---|
| At1(Ld) | 38.5 | 63.1 | 26.6 | 14.5 | 0.091 |
| At1(Lo) | 49.8 | 43.2 | 27.6 | 18.8 | 0.030 |
| At2(Ld) | 39.2 | 60.3 | 26.5 | 14.9 | 0.092 |
| At2(Lo) | 49.2 | 43.1 | 26.8 | 18.5 | 0.029 |
| Bt1(Ld) | 37.9 | 64.9 | 26.0 | 14.2 | 0.074 |
| Bt1(Lo) | 47.2 | 44.4 | 25.1 | 17.7 | 0.021 |
| Bt2(Ld) | 38.9 | 61.2 | 25.8 | 14.7 | 0.068 |
| Bt2(Lo) | 46.4 | 43.5 | 23.3 | 17.3 | 0.024 |
Parameter uncertainties are <2%.
The two-phase analysis was further tested by checking whether a decrease of the hydrocarbon chain length of the mixture’s high-melting lipid leads to reasonable changes in domain structure. Exchanging DSPC with DPPC affected mainly the structure of the Lo phase. Picking for example the t1 tielines, dB decreased by 2.6 Å, whereas only a minor decrease of 0.6 Å was found for Ld. Similar changes were found for other tielines, including dC-values (Table 1). Our findings are in excellent agreement with tieline orientation (Fig. 1); because the high-melting lipid is located in Lo domains, we observe a thinning by exchanging DSPC to DPPC, which contains two CH2 groups less per acyl chain. Kučerka et al. (47) reported a similar thickness difference for pure DSPC and DPPC bilayers. Ld phases contain mainly DOPC and are consequently barely effected by the lipid exchange. Further structural parameters for Ld (Table 1) are close to that of pure DOPC (40).
Finally, we compare areas per lipid, A, which differ significantly between Ld and Lo phases (Table 1). The Ld domains exhibited A values between 60 and 65 Å2, which is in the range of values reported for fluid single lipid bilayers (40,47). Areas are ∼20 Å2 smaller for Lo domains. The main reason for this difference is the condensing effect of cholesterol, which was previously reported for several binary phosphatidylcholine/cholesterol mixtures (48,56–58) and is now also observed for coexisting Lo/Ld domains. Another manifestation of this ordering effect is the decrease of the bending fluctuation parameter from η ∼ 0.08 (Ld) to ∼0.03 (Lo).
Thus, concluding this section: our global SAXS data analysis yields, within typical uncertainties of the SDP model, robust high-resolution results for structure and fluctuations of coexisting Lo/Ld domains. This allows us to obtain reliable insights on changes of these parameters, e.g., as a function of composition or temperature. Results of such experiments are presented in the following sections.
Effect of cholesterol on domains
To study the influence of raising cholesterol concentration, we compare the t1 and t2 tieline midpoints for both ternary mixtures. Scattering profiles and fits are plotted in Fig. 3 (Figs. S3, S4, and S5), while results for structural and elastic parameters are presented in Table 1. For both systems studied, d increased by ∼0.75 Å for Ld domains, but decreased by ∼2 Å for Lo upon increasing cholesterol content. Our analysis revealed that the increase of d for Ld is mainly due to a thickening of its bilayer, whereas only approximately one-third of the decrease of d for Lo can be attributed to dB. A decrease of dB for Lo upon increasing cholesterol concentration may seem counterintuitive, but the marginal additional ordering effect due to more cholesterol is overcompensated by a reduction of the high-melting lipid concentration. Most of the change in d for Lo is due to a decrease of the interstitial water layer (1–2 Å), which may originate either from an increase in net attractive forces, or a decrease in net repulsive forces between Lo domains. This effect cannot be attributed to an increased bending rigidity due to the higher cholesterol content (59), because the fluctuations did not decrease (Table 1). Instead, a decrease of hydration or an increase of van der Waals forces might be the reason.
The area per lipid was found to be smaller for Ld domains of the t2 tielines (Table 1), which can be attributed to the well-known condensing effect of cholesterol (58). For Lo domains, changes for A were found to be insignificant (within experimental uncertainty). However, it is interesting to note that the variation of A for Lo even across DOPC/DPPC/CHOL and DOPC/DSPC/CHOL is within <±2%. This indicates that the average value A ∼ 43.6 Å could be the tightest possible packing of lipids in the Lo phase. More structural data on Lo would certainly be needed to validate this notion.
Temperature dependence of Lo/Ld domains
Starting from the reported compositional phase diagrams (Fig. 1), we increased temperature in steps of 5°C until we reached a homogeneous phase. The transition is observed as a merging of the Lo and Ld lattices into a single Ld phase lattice (Fig. 4). For DOPC/DSPC/CHOL, the transition at TC occurred between 45 and 50°C, and for DOPC/DPPC/CHOL, between 30 and 35°C. Note that our temperature resolution does not allow us to determine TC with high accuracy. Fig. 5 A compares the results for dB of At1 and Bt1. The Lo phase of Bt1 was found to be 3 Å thinner than that of At1. Because changes with temperature are similar for both t1 and t2 tielines (Figs. 5 and S6), we can therefore limit the discussion to the t1 tielines. In the temperature range of 22–45°C dB of Ld domains increased monotonously by ∼1–1.5 Å, whereas dB for Lo decreased at the same time by 2 Å. Close to TC, these changes are significantly accelerated. Above the transition temperature, dB is similar to that of the Ld phase just below TC. Interestingly, dB is approximately equal for DSPC- and DPPC-containing samples above TC, including the t2 tielines (Fig. S6) despite the difference in hydrocarbon chain length.
Figure 4.
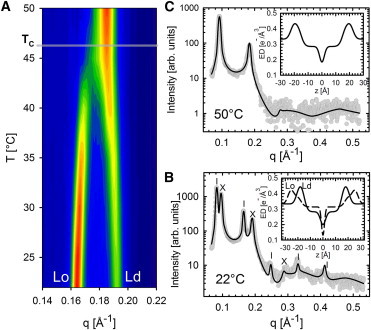
Temperature behavior of DOPC/DSPC/CHOL (tieline t2) as revealed by SAXS. (A) Contour plot of the second-order Bragg reflections indicated as Lo and Ld. Note that the smooth appearance of data is due to an interpolation procedure between the individual frames. The critical temperature TC is between 45 and 50°C. At >TC, only a single lamellar lattice is observed. (B) Measured scattering at 22°C with the indicated Bragg reflections for Lo (dashes) and Ld (crosses) domains. (C) The same, for 50°C. (Solid lines) Best fits. (Insets, both panels) Resulting ED profiles for Lo and Ld phases. To see this figure in color, go online.
Figure 5.
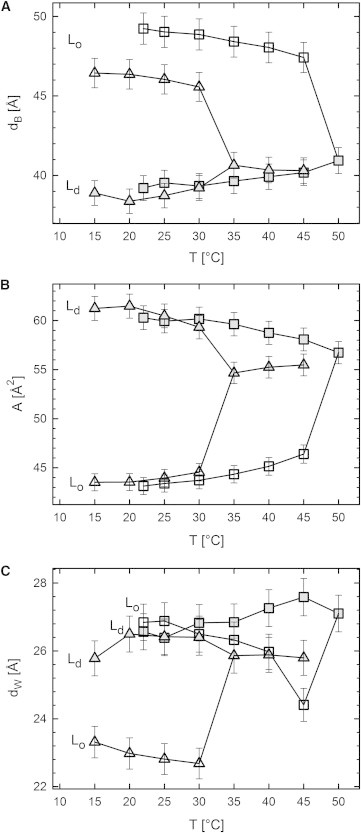
Temperature dependence of structural parameters of DOPC/DSPC/CHOL (squares) and DOPC/DPPC/CHOL (triangles), starting from the t1 tieline midpoints (Fig. 1). (A) Bilayer thickness, (B) area per lipid, and (C) water layer thickness, for Ld (solid symbols) and Lo (open symbols) domains as a function of temperature.
The thickness of single-phase fluid lipid bilayers typically decreases with increasing temperature (47,60,61). Thus, the thickening of the Ld domains upon approaching TC from below is surprising. Davis and Schmidt (23) recently suggested, based on NMR data, that the cholesterol fraction in Lo decreases with temperature. Consequently, Ld would get enriched in cholesterol. Because of the associated condensation effect of cholesterol, one would then expect an increase of the Ld domain thickness. Our results consequently corroborate this scenario.
The area per lipid is inversely proportional to dB. Hence the temperature changes of A are similar to dB, but just with inverted trends, i.e., A decreases for Ld and increases for Lo, as observed in Fig. 5 B. We further note that areas above TC are alike for all systems and tielines studied, which appears reasonable in view of the similar A-values reported for single-component DPPC and DSPC membranes (47). Changes of the water layers in turn appear to be decoupled from the trends of dB and A. We found a general increase of dW for Ld domains and a decrease for Lo domains (Fig. 5 C) below TC, with changes close to TC being more pronounced for the Lo phase. These findings are not straightforward to explain, in particular because the Caillé parameter did not show a strong increase of bending fluctuations for Ld, or decrease for Lo, respectively. Instead, an overall decrease in η was found for Ld (Fig. 6) and an increase in the vicinity of TC for Lo. These two trends can be explained by the temperature-driven diffusion of cholesterol to Ld, as discussed above. Specific changes in dW in turn appear to be caused by other influences on intermembrane interactions. Additional experiments, such as a combination of SAXS with osmotic stress (62), are needed to address this issue properly.
Figure 6.
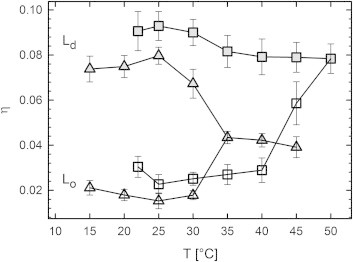
Temperature dependence of bending fluctuations of coexisting DOPC/DSPC/CHOL (squares) and DOPC/DPPC/CHOL (triangles) domains, for t1 tieline compositions (Fig. 1 and Table S1). (Shaded symbols) Results for Ld domain; (open symbols) results for Lo domain.
Melting of Lo domains can be further assessed by cLd, corresponding to the Ld phase fraction (Eq. 2). All studied systems show a steady increase of cLd as TC is approached from below, while the t2 composition of DOPC/DSPC/CHOL exhibited the largest overall Ld fraction (Fig. 7). The increase of cLd also signifies that the Ld tieline endpoints approach the chosen midpoints more rapidly than the Lo endpoints. Hence, the Lo/Ld coexistence regime reduces asymmetrically with temperature, i.e., closes-in faster on the Ld boundary than on the Lo boundary, in agreement with Buboltz et al. (63) (and see the Supporting Material).
Figure 7.
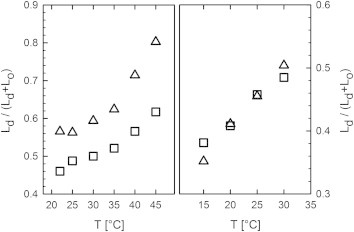
Variation of Ld phase fraction with temperature. (Left) Results for DOPC/DSPC/CHOL. (Right) Results for DOPC/DPPC/CHOL. (Squares) Results for t1 tielines; (triangles) results for t2 tielines.
Finally, it is interesting to compare the relative increase of the Ld fraction in the studied temperature range. For DOPC/DSPC/CHOL, cLd increased with temperature by 16% for the t1 and 25% for the t2 tieline, respectively. Differences are smaller for DOPC/DPPC/CHOL, with ΔcLd = 9% for t1 and 16% for t2, but here changes are more pronounced at higher cholesterol content. Hence, increasing cholesterol concentration appears to promote melting of Lo. This can be understood by reviewing the height differences between Ld and Lo domains (Table 1). For DSPC-containing mixtures, ΔdB =11.3 Å for the t1 tieline and ΔdB =10 Å or t2, whereas ΔdB = 9.7 Å and ΔdB = 7.5 Å for the t1 and t2 tielines in DOPC/DPPC/CHOL. Thus, ΔdB decreases with cholesterol concentration for both systems. The height differences are related to the line tension γ between Ld and Lo domains. In particular, Akimov et al. (30) showed that γ ∝ . Consequently, the cholesterol-induced decrease of ΔdB leads to a lowering of γ, facilitating the melting of Lo domains.
Conclusions
We introduced a global SAXS data analysis technique, which yields structural and elastic properties of coexisting Lo/Ld domains in multilamellar vesicles. The model captures 1) high structural resolution by incorporating the SDP model (40) and 2) bending fluctuations through a Bragg peak line-shape analysis in terms of the Caillé theory structure factor (39). The method has been verified on DOPC/DSPC/CHOL and DOPC/DPPC/CHOL mixtures by comparing tieline endpoint with midpoint data of corresponding phase coexistence samples, and by essaying whether it captures the effects of chain length increase for Lo domains, such as thickness increase or a decrease of lipid area.
We further characterized two tielines for each ternary mixture to study effects of increased cholesterol concentration. Interestingly, additional cholesterol affected mostly structural properties of the Ld phase (increase of dB and dC, decrease of A, and decrease of η), whereas Lo appeared to be already saturated. A further effect of higher cholesterol concentration was a decrease of the thickness difference between Lo and Ld domains, leading to a lowering of line tension and consequently to a destabilization of Lo domains that is somehow analogous to the well-known order/disorder effect of cholesterol in binary lipid mixtures (64). The temperature behavior revealed structural and elastic changes during melting of Lo domains, which suggest that cholesterol diffuses into Ld domains even below TC.
Because of its ability to analyze phase coexistence data without using labels, our technique should be able contribute to resolving several open questions in the field. One of the many controversial issues of raftlike lipid mixtures, for example, is their critical behavior across the transition into a homogeneous phase. According to theory, any defined order parameter should vary ∝(TC – T)β, where the critical exponent β is either 0.125 or 0.325, depending on whether the system follows the two- or three-dimensional Ising model, respectively (23,65–68). Fluorescence microscopy experiments on compositional fluctuations in the vicinity of TC revealed a two-dimensional Ising model-like behavior (65–67). In contrast, atomic force measurements on the height-difference of Lo/Ld (68) and first momenta of NMR spectra (23) reported critical exponents favoring the three-dimensional Ising model. We analyzed the height difference between Lo and Ld phases across TC to determine a critical exponent (Fig. S8). Our results favor the two-dimensional Ising model, but the apparently coarse temperature steps preclude us from any firm statement. Future studies will be designed to exactly address this issue. Another interesting application for our technique will be to predict protein activity and partitioning in domains (17), which can be achieved by adding information on spontaneous curvatures (69) and bending elasticities (31,33) of Lo and Ld domains. This work is underway in our laboratory.
Acknowledgments
We are grateful to George Khelashvili and Milka Doktorova for sharing MD simulation data on Lo phases and for providing us with the MD simulation snapshot. We further thank Frederick A. Heberle, Jianjun Pan, and John Katsaras for valuable discussions.
This work was supported by the Austrian Science Fund FWF, Project No. P24459-B20 (to G.P.).
Editor: Anne Kenworthy.
Footnotes
This is an open access article under the CC BY license (http://creativecommons.org/licenses/by/4.0/).
Supporting Material
References
- 1.Simons K., Ikonen E. Functional rafts in cell membranes. Nature. 1997;387:569–572. doi: 10.1038/42408. [DOI] [PubMed] [Google Scholar]
- 2.Simons K., Toomre D. Lipid rafts and signal transduction. Nat. Rev. Mol. Cell Biol. 2000;1:31–39. doi: 10.1038/35036052. [DOI] [PubMed] [Google Scholar]
- 3.Edidin M. The state of lipid rafts: from model membranes to cells. Annu. Rev. Biophys. Biomol. Struct. 2003;32:257–283. doi: 10.1146/annurev.biophys.32.110601.142439. [DOI] [PubMed] [Google Scholar]
- 4.McMullen T.P.W., Lewis R.N.A.H., McElhaney R.N. Cholesterol-phospholipid interactions, the liquid-ordered phase, and lipid rafts in model and biological membranes. Curr. Opin. Colloid Interface Sci. 2004;8:459–468. [Google Scholar]
- 5.London E. How principles of domain formation in model membranes may explain ambiguities concerning lipid raft formation in cells. Biochim. Biophys. Acta. 2005;1746:203–220. doi: 10.1016/j.bbamcr.2005.09.002. [DOI] [PubMed] [Google Scholar]
- 6.Brown D.A., London E. Structure and function of sphingolipid- and cholesterol-rich membrane rafts. J. Biol. Chem. 2000;275:17221–17224. doi: 10.1074/jbc.R000005200. [DOI] [PubMed] [Google Scholar]
- 7.Brown D.A., London E. Structure and origin of ordered lipid domains in biological membranes. J. Membr. Biol. 1998;164:103–114. doi: 10.1007/s002329900397. [DOI] [PubMed] [Google Scholar]
- 8.Goñi F.M., Alonso A., Thewalt J.L. Phase diagrams of lipid mixtures relevant to the study of membrane rafts. Biochim. Biophys. Acta. 2008;1781:665–684. doi: 10.1016/j.bbalip.2008.09.002. [DOI] [PMC free article] [PubMed] [Google Scholar]
- 9.Marsh D. Liquid-ordered phases induced by cholesterol: a compendium of binary phase diagrams. Biochim. Biophys. Acta. 2010;1798:688–699. doi: 10.1016/j.bbamem.2009.12.027. [DOI] [PubMed] [Google Scholar]
- 10.Marsh D. Cholesterol-induced fluid membrane domains: a compendium of lipid-raft ternary phase diagrams. Biochim. Biophys. Acta. 2009;1788:2114–2123. doi: 10.1016/j.bbamem.2009.08.004. [DOI] [PubMed] [Google Scholar]
- 11.Heberle F.A. Liposomes, Lipid Bilayers and Model Membranes: From Basic Research to Application. CRC Press; Boca Raton, FL: 2014. Liposome-based models for membrane rafts: methodology and applications. [Google Scholar]
- 12.van Meer G., Voelker D.R., Feigenson G.W. Membrane lipids: where they are and how they behave. Nat. Rev. Mol. Cell Biol. 2008;9:112–124. doi: 10.1038/nrm2330. [DOI] [PMC free article] [PubMed] [Google Scholar]
- 13.Frisz J.F., Klitzing H.A., Kraft M.L. Sphingolipid domains in the plasma membranes of fibroblasts are not enriched with cholesterol. J. Biol. Chem. 2013;288:16855–16861. doi: 10.1074/jbc.M113.473207. [DOI] [PMC free article] [PubMed] [Google Scholar]
- 14.Frisz J.F., Lou K., Kraft M.L. Direct chemical evidence for sphingolipid domains in the plasma membranes of fibroblasts. Proc. Natl. Acad. Sci. USA. 2013;110:E613–E622. doi: 10.1073/pnas.1216585110. [DOI] [PMC free article] [PubMed] [Google Scholar]
- 15.Veatch S.L., Keller S.L. Seeing spots: complex phase behavior in simple membranes. Biochim. Biophys. Acta. 2005;1746:172–185. doi: 10.1016/j.bbamcr.2005.06.010. [DOI] [PubMed] [Google Scholar]
- 16.Killian J.A. Hydrophobic mismatch between proteins and lipids in membranes. Biochim. Biophys. Acta. 1998;1376:401–415. doi: 10.1016/s0304-4157(98)00017-3. [DOI] [PubMed] [Google Scholar]
- 17.Pabst G. Coupling of membrane elasticity and structure to protein function. In: Iglic A., Kulkarni C., editors. Vol. 18. Academic Press; London, United Kingdom: 2013. p. 282. (Advances in Planar Lipid Bilayers and Liposomes). [Google Scholar]
- 18.Binder W.H., Barragan V., Menger F.M. Domains and rafts in lipid membranes. Angew. Chem. Int. Ed. Engl. 2003;42:5802–5827. doi: 10.1002/anie.200300586. [DOI] [PubMed] [Google Scholar]
- 19.Veatch S.L., Keller S.L. Organization in lipid membranes containing cholesterol. Phys. Rev. Lett. 2002;89:268101. doi: 10.1103/PhysRevLett.89.268101. [DOI] [PubMed] [Google Scholar]
- 20.Pitcher W.H., 3rd, Keller S.L., Huestis W.H. Interaction of nominally soluble proteins with phospholipid monolayers at the air-water interface. Biochim. Biophys. Acta. 2002;1564:107–113. doi: 10.1016/s0005-2736(02)00405-4. [DOI] [PubMed] [Google Scholar]
- 21.McIntosh T.J., Vidal A., Simon S.A. Sorting of lipids and transmembrane peptides between detergent-soluble bilayers and detergent-resistant rafts. Biophys. J. 2003;85:1656–1666. doi: 10.1016/S0006-3495(03)74595-0. [DOI] [PMC free article] [PubMed] [Google Scholar]
- 22.Gandhavadi M., Allende D., McIntosh T.J. Structure, composition, and peptide binding properties of detergent soluble bilayers and detergent resistant rafts. Biophys. J. 2002;82:1469–1482. doi: 10.1016/S0006-3495(02)75501-X. [DOI] [PMC free article] [PubMed] [Google Scholar]
- 23.Davis J.H., Schmidt M.L. Critical behavior in DOPC/DPPC/cholesterol mixtures: static 2H NMR line shapes near the critical point. Biophys. J. 2014;106:1970–1978. doi: 10.1016/j.bpj.2014.03.037. [DOI] [PMC free article] [PubMed] [Google Scholar]
- 24.Chiang Y.-W., Shimoyama Y., Freed J.H. Dynamic molecular structure of DPPC-DLPC-cholesterol ternary lipid system by spin-label electron spin resonance. Biophys. J. 2004;87:2483–2496. doi: 10.1529/biophysj.104.044438. [DOI] [PMC free article] [PubMed] [Google Scholar]
- 25.Ionova I.V., Livshits V.A., Marsh D. Phase diagram of ternary cholesterol/palmitoylsphingomyelin/palmitoyloleoyl-phosphatidylcholine mixtures: spin-label EPR study of lipid-raft formation. Biophys. J. 2012;102:1856–1865. doi: 10.1016/j.bpj.2012.03.043. [DOI] [PMC free article] [PubMed] [Google Scholar]
- 26.Tokumasu F., Jin A.J., Dvorak J.A. Nanoscopic lipid domain dynamics revealed by atomic force microscopy. Biophys. J. 2003;84:2609–2618. doi: 10.1016/S0006-3495(03)75066-8. [DOI] [PMC free article] [PubMed] [Google Scholar]
- 27.Mills T.T., Tristram-Nagle S., Feigenson G.W. Liquid-liquid domains in bilayers detected by wide angle x-ray scattering. Biophys. J. 2008;95:682–690. doi: 10.1529/biophysj.107.127910. [DOI] [PMC free article] [PubMed] [Google Scholar]
- 28.Chen L., Yu Z., Quinn P.J. The partition of cholesterol between ordered and fluid bilayers of phosphatidylcholine: a synchrotron x-ray diffraction study. Biochim. Biophys. Acta. 2007;1768:2873–2881. doi: 10.1016/j.bbamem.2007.07.023. [DOI] [PubMed] [Google Scholar]
- 29.Bennett W.F.D., Tieleman D.P. Computer simulations of lipid membrane domains. Biochim. Biophys. Acta. 2013;1828:1765–1776. doi: 10.1016/j.bbamem.2013.03.004. [DOI] [PubMed] [Google Scholar]
- 30.Akimov S.A., Kuzmin P.I., Chizmadzhev Y.A. An elastic theory for line tension at a boundary separating two lipid monolayer regions of different thickness. J. Electroanal. Chem. 2004;564:13–18. [Google Scholar]
- 31.Khelashvili G., Kollmitzer B., Harries D. Calculating the bending modulus for multicomponent lipid membranes in different thermodynamic phases. J. Chem. Theory Comput. 2013;9:3866–3871. doi: 10.1021/ct400492e. [DOI] [PMC free article] [PubMed] [Google Scholar]
- 32.Rawicz W., Smith B.A., Evans E. Elasticity, strength, and water permeability of bilayers that contain raft microdomain-forming lipids. Biophys. J. 2008;94:4725–4736. doi: 10.1529/biophysj.107.121731. [DOI] [PMC free article] [PubMed] [Google Scholar]
- 33.Pabst G., Kučerka N., Katsaras J. Applications of neutron and x-ray scattering to the study of biologically relevant model membranes. Chem. Phys. Lipids. 2010;163:460–479. doi: 10.1016/j.chemphyslip.2010.03.010. [DOI] [PubMed] [Google Scholar]
- 34.Pan J., Heberle F.A., Katsaras J. Using small-angle neutron scattering to detect nanoscopic lipid domains. Chem. Phys. Lipids. 2013;170-171:19–32. doi: 10.1016/j.chemphyslip.2013.02.012. [DOI] [PubMed] [Google Scholar]
- 35.Heberle F.A., Petruzielo R.S., Katsaras J. Bilayer thickness mismatch controls domain size in model membranes. J. Am. Chem. Soc. 2013;135:6853–6859. doi: 10.1021/ja3113615. [DOI] [PubMed] [Google Scholar]
- 36.Tsamaloukas A., Szadkowska H., Heerklotz H. Nonideal mixing in multicomponent lipid/detergent systems. J. Phys. Condens. Matter. 2006;18:S1125–S1138. doi: 10.1088/0953-8984/18/28/S02. [DOI] [PubMed] [Google Scholar]
- 37.Tayebi L., Ma Y., Parikh A.N. Long-range interlayer alignment of intralayer domains in stacked lipid bilayers. Nat. Mater. 2012;11:1074–1080. doi: 10.1038/nmat3451. [DOI] [PubMed] [Google Scholar]
- 38.Karmakar S., Sarangi B.R., Raghunathan V.A. Phase behavior of lipid-cholesterol membranes. Solid State Commun. 2006;139:630–634. [Google Scholar]
- 39.Pabst G., Rappolt M., Laggner P. Structural information from multilamellar liposomes at full hydration: full q-range fitting with high quality x-ray data. Phys. Rev. E Stat. Phys. Plasmas Fluids Relat. Interdiscip. Topics. 2000;62(3 Pt B):4000–4009. doi: 10.1103/physreve.62.4000. [DOI] [PubMed] [Google Scholar]
- 40.Kučerka N., Nagle J.F., Katsaras J. Lipid bilayer structure determined by the simultaneous analysis of neutron and x-ray scattering data. Biophys. J. 2008;95:2356–2367. doi: 10.1529/biophysj.108.132662. [DOI] [PMC free article] [PubMed] [Google Scholar]
- 41.Heftberger P., Kollmitzer B., Pabst G. Global small-angle x-ray scattering data analysis for multilamellar vesicles: the evolution of the scattering density profile model. J. Appl. Cryst. 2014;47:173–180. doi: 10.1107/S1600576713029798. [DOI] [PMC free article] [PubMed] [Google Scholar]
- 42.Hammersley A. Grenoble; France: 1997. ESRF Internal Report, ESRF97HA02T, FIT2D: An Introduction and Overview. European Synchrotron Radiation Facility. [Google Scholar]
- 43.Glatter O., Kratky O. Vol. 102. Academic Press; London, United Kingdom: 1982. (Small Angle X-Ray Scattering). [Google Scholar]
- 44.Caillé A. Notes on the distribution of x-rays in smectics [Remarques sur la diffusion des rayons x dans les smectiques A] Acad. Sci. Paris B. 1972;274:891–893. [Google Scholar]
- 45.Zhang R., Suter R.M., Nagle J.F. Theory of the structure factor of lipid bilayers. Phys. Rev. E Stat. Phys. Plasmas Fluids Relat. Interdiscip. Topics. 1994;50:5047–5060. doi: 10.1103/physreve.50.5047. [DOI] [PubMed] [Google Scholar]
- 46.Pabst G., Koschuch R., Laggner P. Structural analysis of weakly ordered membrane stacks. J. Appl. Cryst. 2003;36:1378–1388. [Google Scholar]
- 47.Kučerka N., Nieh M.-P., Katsaras J. Fluid phase lipid areas and bilayer thicknesses of commonly used phosphatidylcholines as a function of temperature. Biochim. Biophys. Acta. 2011;1808:2761–2771. doi: 10.1016/j.bbamem.2011.07.022. [DOI] [PubMed] [Google Scholar]
- 48.Pan J., Cheng X., Katsaras J. Interactions between ether phospholipids and cholesterol as determined by scattering and molecular dynamics simulations. J. Phys. Chem. B. 2012;116:14829–14838. doi: 10.1021/jp310345j. [DOI] [PMC free article] [PubMed] [Google Scholar]
- 49.Uppamoochikkal P., Tristram-Nagle S., Nagle J.F. Orientation of tie-lines in the phase diagram of DOPC/DPPC/cholesterol model biomembranes. Langmuir. 2010;26:17363–17368. doi: 10.1021/la103024f. [DOI] [PMC free article] [PubMed] [Google Scholar]
- 50.Heberle F.A., Wu J., Feigenson G.W. Comparison of three ternary lipid bilayer mixtures: FRET and ESR reveal nanodomains. Biophys. J. 2010;99:3309–3318. doi: 10.1016/j.bpj.2010.09.064. [DOI] [PMC free article] [PubMed] [Google Scholar]
- 51.Koenig B.W., Gawrisch K. Specific volumes of unsaturated phosphatidylcholines in the liquid crystalline lamellar phase. Biochim. Biophys. Acta. 2005;1715:65–70. doi: 10.1016/j.bbamem.2005.07.006. [DOI] [PubMed] [Google Scholar]
- 52.Greenwood A.I., Tristram-Nagle S., Nagle J.F. Partial molecular volumes of lipids and cholesterol. Chem. Phys. Lipids. 2006;143:1–10. doi: 10.1016/j.chemphyslip.2006.04.002. [DOI] [PMC free article] [PubMed] [Google Scholar]
- 53.Davis J.H., Clair J.J., Juhasz J. Phase equilibria in DOPC/DPPC-d62/cholesterol mixtures. Biophys. J. 2009;96:521–539. doi: 10.1016/j.bpj.2008.09.042. [DOI] [PMC free article] [PubMed] [Google Scholar]
- 54.Veatch S.L., Soubias O., Gawrisch K. Critical fluctuations in domain-forming lipid mixtures. Proc. Natl. Acad. Sci. USA. 2007;104:17650–17655. doi: 10.1073/pnas.0703513104. [DOI] [PMC free article] [PubMed] [Google Scholar]
- 55.Veatch S.L., Polozov I.V., Keller S.L. Liquid domains in vesicles investigated by NMR and fluorescence microscopy. Biophys. J. 2004;86:2910–2922. doi: 10.1016/S0006-3495(04)74342-8. [DOI] [PMC free article] [PubMed] [Google Scholar]
- 56.Pan J., Tristram-Nagle S., Nagle J.F. Effect of cholesterol on structural and mechanical properties of membranes depends on lipid chain saturation. Phys. Rev. E Stat. Nonlin. Soft Matter Phys. 2009;80:021931. doi: 10.1103/PhysRevE.80.021931. [DOI] [PMC free article] [PubMed] [Google Scholar]
- 57.McConnell H.M., Radhakrishnan A. Condensed complexes of cholesterol and phospholipids. Biochim. Biophys. Acta. 2003;1610:159–173. doi: 10.1016/s0005-2736(03)00015-4. [DOI] [PubMed] [Google Scholar]
- 58.Hodzic A., Rappolt M., Pabst G. Differential modulation of membrane structure and fluctuations by plant sterols and cholesterol. Biophys. J. 2008;94:3935–3944. doi: 10.1529/biophysj.107.123224. [DOI] [PMC free article] [PubMed] [Google Scholar]
- 59.Pan J., Mills T.T., Nagle J.F. Cholesterol perturbs lipid bilayers nonuniversally. Phys. Rev. Lett. 2008;100:198103. doi: 10.1103/PhysRevLett.100.198103. [DOI] [PMC free article] [PubMed] [Google Scholar]
- 60.Pabst G., Amenitsch H., Rappolt M. Structure and fluctuations of phosphatidylcholines in the vicinity of the main phase transition. Phys. Rev. E Stat. Nonlin. Soft Matter Phys. 2004;70:021908. doi: 10.1103/PhysRevE.70.021908. [DOI] [PubMed] [Google Scholar]
- 61.Pabst G., Katsaras J., Rappolt M. Structure and interactions in the anomalous swelling regime of phospholipid bilayers. Langmuir. 2003;19:1716–1722. [Google Scholar]
- 62.Parsegian V.A., Rand R.P., Rau D.C. Macromolecules and water: probing with osmotic stress. In: Johnson M.L., Ackers G.K., editors. Energetics of Biological Macromolecules, Vol. 259, Methods in Enzymology. Academic Press; London, United Kingdom: 1995. pp. 43–94. [DOI] [PubMed] [Google Scholar]
- 63.Buboltz J.T., Bwalya C., Schutzer M. High resolution mapping of phase behavior in a ternary lipid mixture: do lipid-raft phase boundaries depend on sample-prep procedure? Langmuir. 2007;23:11968–11971. doi: 10.1021/la702490r. [DOI] [PubMed] [Google Scholar]
- 64.Mouritsen O.G., Jørgensen K. Dynamical order and disorder in lipid bilayers. Chem. Phys. Lipids. 1994;73:3–25. doi: 10.1016/0009-3084(94)90171-6. [DOI] [PubMed] [Google Scholar]
- 65.Honerkamp-Smith A.R., Cicuta P., Keller S.L. Line tensions, correlation lengths, and critical exponents in lipid membranes near critical points. Biophys. J. 2008;95:236–246. doi: 10.1529/biophysj.107.128421. [DOI] [PMC free article] [PubMed] [Google Scholar]
- 66.Honerkamp-Smith A.R., Machta B.B., Keller S.L. Experimental observations of dynamic critical phenomena in a lipid membrane. Phys. Rev. Lett. 2012;108:265702. doi: 10.1103/PhysRevLett.108.265702. [DOI] [PMC free article] [PubMed] [Google Scholar]
- 67.Veatch S.L., Cicuta P., Baird B. Critical fluctuations in plasma membrane vesicles. ACS Chem. Biol. 2008;3:287–293. doi: 10.1021/cb800012x. [DOI] [PubMed] [Google Scholar]
- 68.Connell S.D., Heath G., Kisil A. Critical point fluctuations in supported lipid membranes. Faraday Discuss. 2013;161:91–150. doi: 10.1039/c2fd20119d. [DOI] [PubMed] [Google Scholar]
- 69.Kollmitzer B., Heftberger P., Pabst G. Monolayer spontaneous curvature of raft-forming membrane lipids. Soft Matter. 2013;9:10877–10884. doi: 10.1039/C3SM51829A. [DOI] [PMC free article] [PubMed] [Google Scholar]
- 70.Kučerka N., Katsaras J., Nagle J.F. Comparing membrane simulations to scattering experiments: introducing the SIMTOEXP software. J. Membr. Biol. 2010;235:43–50. doi: 10.1007/s00232-010-9254-5. [DOI] [PMC free article] [PubMed] [Google Scholar]
Associated Data
This section collects any data citations, data availability statements, or supplementary materials included in this article.