

Abstract
Radicals, including hydroxyl, superoxide, and nitric oxide, play key signaling roles in vivo. Reaction of these free radicals with a spin trap affords more stable paramagnetic nitroxides, but concentrations in vivo still are so low that detection by electron paramagnetic resonance (EPR) is challenging. Three innovative enabling technologies have been combined to substantially improve sensitivity for imaging spin-trapped radicals at 250 MHz. (i) Spin trapped adducts of BMPO have lifetimes that are long enough to make imaging by EPR at 250 MHz feasible. (ii) The signal-to-noise of rapid scan EPR is substantially higher than for conventional continuous wave EPR. (iii) An improved algorithm permits image reconstruction with a spectral dimension that encompasses the full 50 G spectrum of the BMPO-OH spin-adduct without requiring the very wide sweeps that would be needed for filtered backprojection. A 2D spectral-spatial image is shown for a phantom containing ca. 5 μM BMPO-OH.
Keywords: hydroxyl radical, image reconstruction, rapid-scan EPR, spin-trapping
Magnetic resonance imaging (MRI) is unexcelled in its ability to provide detailed anatomic definition based on protons (hydrogen nuclei), in natural abundance. However, MRI is limited in its ability to identify physiological status of tissues, such as quantifying local oxygen concentration or paramagnetic molecules reflective of signalling or redox processes. In contrast to MRI, electron paramagnetic resonance imaging (EPRI) is an emergent and complementary imaging modality that can visualize physiology. The success of EPRI depends on paramagnetic spin probes that are specific for tissues so that their location and fate may be imaged by EPRI. Pairing EPRI with MRI will provide powerful physiological information by overlaying a detailed anatomical map from MRI with EPRI information that has significant utility in drug development. Potential applications include monitoring treatment response for early indications of efficacy, following disease progression, determining drug/target engagement, developing more predictive biomarkers, and enhancing detection and localization of tumors. To realize these potentials, enhanced sensitivity is required.
Reactive oxygen species (ROS), such as superoxide (O2•-) and nitric oxide (•NO), play vital roles including cellular signalling. In other situations these free radicals initiate oxidative stress. However, the steady-state in vivo concentrations are too low for detection by EPR. Because of non-resonant absorption of electromagnetic radiation at higher frequencies, in vivo spin trapping has been performed at lower frequencies.[1, 2] For instance, spin trapping by 4-POBN/EtOH of hydroxyl radicals produced by γ-irradiation of a mouse tumor has been detected at 250 MHz using continuous wave (CW) EPR.[3] However, the radiation dose required to achieve detection was too high to be of clinical importance.[3]
Spin-trapping is a method in which short-lived free radicals react with either a nitrone or nitroso-compound to form a more stable nitroxide radical (Scheme 1).[4, 5] For many years 5,5-dimethyl-1-pyrroline-N-oxide (DMPO) (Scheme 1) was the nitrone of choice for detecting biologically generated O2•- and HO• because of the characteristic spectra of the adducts DMPO-OOH and DMPO-OH.[6, 7] More recently, a new generation of spin traps has been developed, such as a diethoxyphosphoryl (DEPMPO)[8-10] or 5-tert-butoxycarbonyl-5-methyl-1-pyrroline-N-oxide (BMPO),[9-12] allowing identification of O2•- and HO• in biological milieu, without artifacts that are often associated with experiments using DMPO.
Scheme 1.

Spin trapping of hydroxyl radical with DMPO and BMPO.
In this report we demonstrate that three innovative enabling technologies have been exploited to substantially improve sensitivity, thereby allowing EPR imaging at 250 MHz of 5 μM BMPO-OH. The spin trap BMPO is a solid at ambient temperature that is easier to handle than DMPO, and the distinctive spectra of BMPO adducts are advantageous for in vivo applications.[11-13] Under the conditions of these experiments the half-life of BMPO-OH is about 30 min, which is similar to that of DMPO-OH.[14] The advantages of BMPO-OH relative to DMPO-OH[11] are the first enabling technology that is exploited in this study.
In rapid scan EPR the magnetic field is scanned through resonance in a time that is short relative to electron spin relaxation times.[15] Deconvolution of the rapid-scan signal gives the absorption spectrum, which is equivalent to the first integral of the conventional first-derivative CW spectrum. For a wide range of samples including rapidly-tumbling nitroxides in fluid solution,[16] spin-trapped O2•-,[17] the E′ center in irradiated fused quartz,[18] paramagnetic centers in amorphous hydrogenated silicon,[19] N@C60 diluted in C60,[19] and the neutral single substitutional nitrogen centers (NS0) in diamond,[19] rapid scan EPR provides substantial improvements in signal-to-noise (S/N) relative to CW EPR for the same data acquisition time.[15] The improvement in S/N that can be obtained by recording the projections for EPRI at 250 MHz by rapid scan compared with CW EPR has been demonstrated for phantoms containing multiple nitroxide radicals.[20] To achieve about the same S/N for an image of the phantom required about 10 times as long for CW as for rapid scan.[20] Rapid scan EPR is the second technology exploited in this study to improve sensitivity per unit time.
In EPR images one dimension can be spectral, which means that the image reports the EPR spectrum as a function of position in the object. The spectrum reflects the paramagnetic species that are present in the sample. This spectral dimension could, for example, indicate the relative concentrations of BMPO-OH and BMPO-OOH in various regions of the sample. Most EPR images with a spectral dimension have been reconstructed by filtered backprojection.[21] This reconstruction algorithm requires projections that are at equally spaced angles in the spectral-spatial plane, which are acquired by varying both gradients and sweep widths. The spectrum of BMPO-OH is about 50 G wide (Figure 1). To acquire data that would permit reconstruction by filtered backprojection of an image in which one dimension encompasses the full spectrum of BMPO-OH would require maximum sweep widths in the projections in excess of 100 G. These sweep widths are too large relative to the ca. 90 G center field at 250 MHz. A new image reconstruction algorithm has been demonstrated that permits reconstruction of the full spectrum with much more modest sweep width requirements.[20] This is the third technology advance exploited in this study.
Figure 1.
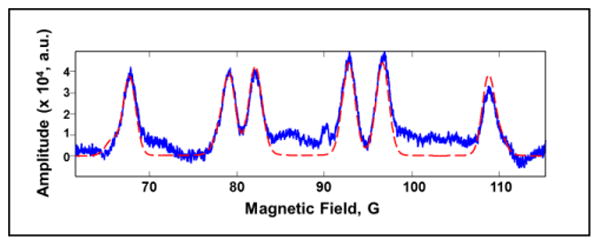
Zero-gradient spectrum of BMPO-OH at 250 MHz (blue) and simulation obtained with the parameters in Table 1 (red). Harmonics of the scan frequency up to fifth order were subtracted from the data.
The feasibility of imaging low concentrations of spin-adducts with BMPO, taking advantage of rapid scan EPR and the recently demonstrated imaging algorithm, is presented here with a 2D spectral-spatial image for a phantom. Two compartments, separated by a 3-mm-thick barrier, contained the same spin trapping solution. Hydroxide radical was generated by irradiation of an H2O2 solution,[7] to achieve a BMPO-OH concentration of about 5 μM. This concentration of spin adduct is about two orders of magnitude lower than the concentrations of 15N and deuterium substituted nitroxides that have been imaged previously at 250 MHz.[22]
The absorption spectrum of BMPO-OH (Figure 1) consists of a distinctive 6-line pattern. The positions of the lines at 250 MHz are shifted significantly from the positions at X-band[11] because the hyperfine splittings are relatively large compared with the 90 G central field at 250 MHz (Figure S1). Similar shifts have been observed for DMPO-OH.[23]
Rapid sinusoidal scans with a frequency of 3.054 kHz were generated with a locally-designed driver.[24] The diameter of the rapid scan coils is about 8.9 cm to ensure uniformity of the oscillating field over the sample. The data acquisition time was about 44 sec for each of 21 projections. The rapid scan signals were deconvolved to obtain the absorption spectra for each projection.[25] Since the goal of the imaging experiment is to define the spatial distribution of the BMPO-OH, comparison of Fourier transforms of spectral slices and simulated spectra followed by thresholding were used as the final step in image processing (Figures S2 and S3). The resulting image is shown in Figure 2. Slices parallel to the x axis of the image are spectral slices though the sample at particular positions in the sample. Slices parallel to the y axis represent the spatial distribution of signal. In the resulting image, the 3-mm spacer between the two compartments is well defined as a dark region in the spatial distribution.
Figure 2.

2-D spectral-spatial image of BMPO-OH in the phantom sample (A), a spectral slice through the image (B) and the error function (C) that was used in the spectral slice fitting routine to distinguish regions that contain BMPO-OH from noise-containing baseline regions.
For this particular phantom a single component is present in the image. For the more general case, more than one radical adduct may be formed. In that situation the analysis model for spectral slices would include two components with adjustable amplitudes or ratios.
The spectral widths for a variety of spin trapped adducts (Table S1) are similar to that for BMPO-OH (Table 1). Thus, the width of the spectral dimension in the image in Figure 2 is sufficient to image a wide range of spin-adducts.
Table 1. Hyperfine Coupling constants (G) for BMPO-OH.
| This work | Ref. [11] | |||
|---|---|---|---|---|
|
| ||||
| 14N | 1H | 14N | 1H | |
| Diastereomer 1 | 14.1 | 12.7 | 13.5 | 12.3 |
| Diastereomer 2 | 14.1 | 16.1 | 13.5 | 15.3 |
The results demonstrate that this combination of new technologies permits imaging of spin-trapped adducts at low enough concentrations to be physiologically useful. The same technologies can also be applied to other nitroxides to enable imaging of important physiologic parameters.
Experimental Section
Experimental Details
BMPO (5-tert-butoxycarbonyl-5-methyl-1-pyrroline-N-oxide) was synthesized as described in the literature.[13] Hydrogen peroxide (30%) was purchased from Sigma-Aldrich (St. Louis, MO). Hydroxyl radical was generated by photolysis of hydrogen peroxide with a medium pressure 450 W Hanovia 679-A36 UV lamp (Fairfield, NJ).[7] Hydrogen peroxide (300 mM) was irradiated in the presence of 50 mM BMPO for 5 minutes. Under these conditions, BMPO-OH has t1/2 ∼30 minutes, which was determined at X-band (9.5 GHz) with a Bruker EMX-plus spectrometer (Bruker, Billerica, MA).
The 250 MHz rapid scan system and cross loop resonator used for data collection and imaging experiments have been described.[22] The spin adduct concentration was estimated to be ca. 5 µM by comparison of the BMPO spectrum at X-band with spectra of nitroxides in solutions at known concentration.
For the phantom, a 3-mm-thick plastic divider was inserted into a 16 mm quartz tube to create two chambers that were filled with an aqueous solution of BMPO-OH, prepared as described above.
For the imaging experiments the power incident on the resonator was about 200 mW, which produces B1 of about 90 mG. The filter setting for the detected signal was 1 MHz. A current of 3 Amp through the rapid scan coils was used to generate sweep widths of 84 G. This sweep width was selected to be wide enough to encompass the full extent of the signal in the presence of the highest gradient. The sinusoidal scan frequency was 3.054 kHz, resulting in a rate at the center of the spectrum of 81 T/s (0.81 MG/s). Twenty one projections were collected with gradients that ranged from -10 G/cm to 10 G/cm in 1 G/cm increments. For each projection there was one trigger for eleven cycles, with a timebase of 50 ns and 65536 points. Each projection was averaged 12288 times, for about 44 s of data acquisition time per projection. The total data acquisition time was about 15 minutes for 21 projections. Total elapsed time from irradiation to completion of the last projection was about 30 minutes.
EPR spectra of BMPO-OH at X-band (9.5 GHz) and at 250 MHz were simulated using EasySpin 5.0 (Figure S1).[26] The X-band spectrum was recorded on a Bruker EMX spectrometer. BMPO-OH in aqueous solution is a mixture of two diastereomers (82% and 18%).[11] In both isomers there are substantial hyperfine couplings to the nitroxide nitrogen and to the α-hydrogen (Table 1). At X-band, perturbation theory to second order was sufficient to reproduce the hyperfine splittings in the experimental spectrum. However, the nitrogen and proton couplings are of similar magnitude, and both are too large relative to the ∼90 G central field to use perturbation calculations even to 5th order. Simulations of the spectrum at 250 MHz required matrix diagonalization, which was accomplished using the rigid lattice model in EasySpin with isotropic g and A values. The X-band and 250 MHz spectra were fit with the same parameters (Table 1), which are in reasonable agreement with the literature. Changing the populations of the diastereomers from the literature values did not result in significant improvements in the simulations.
In the rapid scan experiment the rapidly changing magnetic field generates a background signal at the fundamental scan frequency which was removed from the data as described previously.[27] For the relatively large 84 G sweep widths used in this study the background signal was not precisely sinusoidal, which meant that the background was not fully removed by the standard procedure.[27] For these weak BMPO-OH signals the residual background signals distorts the baseline in the reconstructed image. Because of these low-frequency components in the baseline of the image, the traditional least-square fitting in the magnetic field domain was not useful. Instead, the signal analysis was performed in the Fourier conjugate domain (Figures S2 and S3). Each spectral slice was Fourier transformed. The four lowest-frequency components were deleted in both the transform of the slice and of the simulation, because the intensities at these frequencies are heavily impacted by low frequency background variation. The intensities at frequencies in the Fourier transforms of the slice through the preliminary image and of the simulated spectrum were compared to determine the root mean square error (Figure 2) and the relative signal amplitude. A threshold of 33% of the maximum error was used as the criterion to distinguish a slice that contained only random noise from a slice that contained spectral features. The spectral slices in the final image were calculated as the product of the relative signal amplitude determined in the Fourier domain and the lineshape of the simulated spectra (Figure S2).
Acknowledgments
Partial support of this work by NIH grants NIBIB grant EB000557 (GRE and SSE), K25 EB016040 (MT), and P41 EB002034 to GMR and GRE, H. J. Halpern, PI, is gratefully acknowledged.
Contributor Information
Gerald M. Rosen, Email: grosen@umaryland.edu.
Joseph P. Y. Kao, Email: jkao@umaryland.edu.
Gareth R. Eaton, Email: geaton@du.edu.
References
- 1.Berliner LJ. Biol Magn Reson. Vol. 18. Kluwer Academic; New York: 2003. [Google Scholar]
- 2.Eaton SS, Eaton GR, Berliner LJ. In: Biol Magn Reson. Berliner LJ, editor. Vol. 23. Kluwer Academic/Plenum Press; New York: 2005. [Google Scholar]
- 3.Halpern HJ, Yu C, Barth E, Peric M, Rosen GM. Proc Natl Acad Sci U S. 1995;92:796–800. doi: 10.1073/pnas.92.3.796. [DOI] [PMC free article] [PubMed] [Google Scholar]
- 4.Janzen EG, Blackburn BJ. J Am Chem Soc. 1968;90:5909–5910. [Google Scholar]
- 5.Chalfont GR, Perkins MJ, Horsfield A. J Am Chem Soc. 1968;90:7141–7142. [Google Scholar]
- 6.Harbour JR, Bolton JR. Biochem Biophys Res Commun. 1975;64:803–807. doi: 10.1016/0006-291x(75)90118-7. [DOI] [PubMed] [Google Scholar]
- 7.Finkelstein E, Rosen GM, Rauckman EJ. J Am Chem Soc. 1980;102:4994–4999. [Google Scholar]
- 8.Fréjaville C, Karoui H, Tuccio B, LeMoigne F, Culcasi M, Pietri S, Lauricella R, Tordo P. J Chem Soc Chem Commun. 1994:1793–1794. doi: 10.1021/jm00002a007. [DOI] [PubMed] [Google Scholar]
- 9.Shi H, Timmins G, Monske M, Burdick A, Kalyanaraman B, Liu Y, Clement JL, Burchiel S, Liu KJ. Arch Biochem Biophys. 2005;437:59–68. doi: 10.1016/j.abb.2005.02.028. [DOI] [PubMed] [Google Scholar]
- 10.Keszler A, Kalyanaraman B, Hogg N. Free Rad Biol Med. 2003;35:1149–1157. doi: 10.1016/s0891-5849(03)00497-0. [DOI] [PubMed] [Google Scholar]
- 11.Zhao H, Joseph J, Zhang H, Karoui H, Kalyanaraman B. Free Rad Biol Med. 2001;31:599–601. doi: 10.1016/s0891-5849(01)00619-0. [DOI] [PubMed] [Google Scholar]
- 12.Villamena FA, Zweier JL. J C S Perkin Trans 2. 2002:1340–1344. [Google Scholar]
- 13.Tsai P, Ichikawa K, Mailer C, Pou S, Halpern HJ, Robinson BH, Nielsen RD, Rosen GM. J Org Chem. 2003;68:7811–7817. doi: 10.1021/jo0350413. [DOI] [PubMed] [Google Scholar]
- 14.Marriott PR, Perkins MJ, Griller D. Can J Chem. 1980;58:803–807. [Google Scholar]
- 15.Eaton SS, Quine RW, Tseitlin M, Mitchell DG, Rinard GA, Eaton GR. In: MultiFrequency Electron Paramagnetic Resonance: Data and Techniques. Misra SK, editor. Wiley; 2014. pp. 3–67. [Google Scholar]
- 16.Mitchell DG, Quine RW, Tseitlin M, Eaton SS, Eaton GR. J Magn Reson. 2012;214:221–226. doi: 10.1016/j.jmr.2011.11.007. [DOI] [PubMed] [Google Scholar]
- 17.Mitchell DG, Rosen GM, Tseitlin M, Symmes B, Eaton SS, Eaton GR. Biophys J. 2013;105:338–342. doi: 10.1016/j.bpj.2013.06.005. [DOI] [PMC free article] [PubMed] [Google Scholar]
- 18.Mitchell DG, Quine RW, Tseitlin M, Meyer V, Eaton SS, Eaton GR. Radiat Meas. 2011;46:993–996. doi: 10.1016/j.radmeas.2011.03.035. [DOI] [PMC free article] [PubMed] [Google Scholar]
- 19.Mitchell DG, Tseitlin M, Quine RW, Meyer V, Newton ME, Schnegg A, George B, Eaton SS, Eaton GR. Mol Phys. 2013;111:2664–2673. [Google Scholar]
- 20.Biller JR, Tseitlin M, Quine RW, Rinard GA, Weismiller HA, Elajaili H, Rosen GM, Kao JP, Eaton SS, Eaton GR. J Magn Reson. 2014;242:162–168. doi: 10.1016/j.jmr.2014.02.015. [DOI] [PMC free article] [PubMed] [Google Scholar]
- 21.Eaton GR, Eaton SS. Concepts Magn Reson. 1995;7:49–67. [Google Scholar]
- 22.Biller JR, Tseitlin M, Quine RQ, Rinard GA, Weismiller HA, Elajaili H, Rosen GM, Kao JPY, Eaton SS, Eaton GR. J Magn Reson. 2014;242:162–168. doi: 10.1016/j.jmr.2014.02.015. [DOI] [PMC free article] [PubMed] [Google Scholar]
- 23.Halpern HJ, Pou S, Peric M, Yu C, Barth E, Rosen GM. J Amer Chem Soc. 1993;115:218–223. [Google Scholar]
- 24.Quine RW, Mitchell DG, Eaton SS, Eaton GR. Conc Magn Reson, Magn Reson Engineer. 2012;41B:95–110. [Google Scholar]
- 25.Tseitlin M, Rinard GA, Quine RW, Eaton SS, Eaton GR. J Magn Reson. 2011;208:279–283. doi: 10.1016/j.jmr.2010.11.015. [DOI] [PMC free article] [PubMed] [Google Scholar]
- 26.Stoll S, Schweiger A. J Magn Reson. 2006;178:42–55. doi: 10.1016/j.jmr.2005.08.013. [DOI] [PubMed] [Google Scholar]
- 27.Tseitlin M, Mitchell DG, Eaton SS, Eaton GR. J Magn Reson. 2012;223:80–84. doi: 10.1016/j.jmr.2012.07.023. [DOI] [PMC free article] [PubMed] [Google Scholar]