

Abstract
Divergent transcription, in which reverse-oriented transcripts occur upstream of eukaryotic promoters in regions devoid of annotated genes, has been suggested to be a general property of active promoters. Here we show that the human basal RNA polymerase II transcriptional machinery and core promoter are inherently unidirectional, and that reverse-oriented transcripts originate from their own cognate reverse-directed core promoters. In vitro transcription analysis and mapping of nascent transcripts in cells revealed that sequences at reverse start sites are similar to those of their forward counterparts. The use of DNase I accessibility to define proximal promoter borders revealed that up to half of promoters are unidirectional and that unidirectional promoters are depleted at their upstream edges of reverse core promoter sequences and their associated chromatin features. Divergent transcription is thus not an inherent property of the transcription process, but rather the consequence of the presence of both forward- and reverse-directed core promoters.
Bidirectional transcription of oppositely oriented pairs of genes, each of which appears to be expressed from its own core promoter, is commonly observed, especially in compact genomes of model organisms such as yeast (Adachi and Lieber, 2002; Wakano et al., 2012). In mammals, recent studies have also revealed reverse-direction transcription initiating upstream of many promoters, largely in the absence of an annotated gene in the reverse orientation. This phenomenon is termed divergent transcription (Core et al., 2008; Preker et al., 2008; Seila et al., 2008), and the resulting transcripts have sometimes been included in annotations of long-noncoding RNA (lncRNA)(Sigova et al., 2013). While divergent transcription has been suggested to be a general feature of eukaryotic promoters, its definition often relies upon arbitrary distance cutoffs, yielding numbers that inevitably increase as longer distances are considered. Furthermore, the near absence of divergent transcription in Drosophila melanogaster (Core et al., 2012), which shares many features of transcriptional regulation with other eukaryotes, argues strongly against divergent initiation as being an inherent property of the eukaryotic transcription process in general.
Divergent transcripts are terminated quickly and are subjected to rapid decay through a mechanism involving cleavage/polyadenylation and the nuclear exosome (Almada et al., 2013; Brannan et al., 2012; Ntini et al., 2013), which has been shown to be driven by Nrd1 in yeast (Arigo et al., 2006; Schulz et al., 2013). The process of reverse transcription initiation, on the other hand, remains to be clarified, and many mechanisms have been proposed (Seila et al., 2009). A current model suggests that the presence of CpG islands, possibly combined with weak, forward-directed motifs (such as the TATA box), leads to transcription in both directions (Core et al., 2012; Grzechnik et al., 2014; Lepoivre et al., 2013). While this model could potentially explain the lack of divergent transcription in Drosophila melanogaster (Core et al., 2012), the sequence and chromatin features that mediate the initiation of divergent transcripts have remained largely speculative.
The core promoter is a fundamental regulator of gene expression. These sequences, which encompass the region that is approximately ±50 bp around the start site, contain motifs such as the TATA box, Initiator, and downstream core promoter element (DPE), that are recognized by the basal transcription machinery (Butler and Kadonaga, 2002). While a substantial fraction of the extragenic mammalian genome is transcribed at least at minimal levels (Birney et al., 2007; Carninci et al., 2005; Kapranov et al., 2007; Katayama et al., 2005), it is not known if such transcription is mediated by distinct core promoter sequence elements. Hints at such regulation have recently been described by cap analysis gene expression (CAGE) in enhancer regions, where eRNA start sites show some sequence similarities to those in promoter regions (Andersson et al., 2014), and by ChIP-exo for basal transcription factors in yeast where two distinct PICs were detected at divergent promoters (Rhee and Pugh, 2012).
The formation of chromatin structure that facilitates the function of trans-regulators is thought to be an important step in gene regulation (Thurman et al., 2012). Transcription start sites occur within nucleosome free regions (NFR), which can be detected by their sensitivity to DNase I cleavage and display a large range of lengths (Boyle et al., 2008; Natarajan et al., 2012). At the downstream edges of promoter-associated NFRs, histone H3 that is trimethylated at lysine 4 (H3K4me3) within well-positioned +1 nucleosomes has been shown to stimulate PIC formation (Lauberth et al., 2013). Furthermore, nucleosome positioning and histone modification states can be used to classify promoters associated with different types of transcription initiation patterns (Lenhard et al., 2012; Rach et al., 2011). However, while many histone marks show bimodal ChIP-seq signal patterns around transcription start sites, these patterns can change depending on RNA polymerase II activity (Bonn et al., 2012). Moreover, the relationship between −1 nucleosome modification and divergent transcription remains to be clarified.
In this study, we show that the basal transcription machinery and the vast majority of core promoters are inherently unidirectional both in vitro and in cells. Maps of nascent RNA 5′ends, which were obtained by using 5′-GRO-seq (Lam et al., 2013), revealed that divergent transcripts initiate from their own distinct core promoters adjacent to the edges of NFRs, which contain sequences that are similar to those of their forward counterparts. We used DNase I hypersensitivity to define NFRs and thus the borders of proximal promoters and showed that roughly half of active promoters are intrinsically unidirectional and depleted at their upstream edges for such reverse-directed core promoter sequences. A high-resolution hidden Markov model (HMM) of promoter-associated chromatin marks revealed that divergent promoters show enrichment around the −1 nucleosome of a chromatin state containing H3K4me2, H3K4me3, and H3K27ac, a state that is enriched further downstream in the forward direction. In contrast, while all active promoters are flanked by well-positioned nucleosomes, unidirectional promoters have no preferred chromatin state in their upstream regions. These findings suggest that divergent transcription is the consequence of the presence of both forward- and reverse-directed core promoters that are located at the edges of NFRs.
Results
Inherent unidirectionality of the basal transcription machinery and core promoters
To investigate the mechanism of divergent transcription, we tested the inherent directionality of the human core promoter and the basal transcription machinery. The core promoter is the minimal DNA sequence that is required for the accurate initiation of transcription, and is typically defined as the region that is about +/− 50 bp relative to the transcription start site (TSS). Within the core promoter, DNA sequence elements, such as the TATA box, Inr, DPE, and TCT motifs, interact with the basal transcription factors to recruit RNA polymerase II. To determine the directionality of the human core transcription machinery, different types of core promoters (i.e., TATA-, DPE-, and TCT-dependent promoters) were subjected to in vitro transcription analysis with HeLa S3 nuclear extracts. Accurate transcription initiation was observed in the forward direction but not in the reverse direction (Fig. 1a). In an exceptional case, divergent initiation was observed from a core promoter with a symmetric TATA element and an Inr in both directions (Figure S1a). Otherwise, these findings indicate that human core promoters and basal transcription machinery can be intrinsically unidirectional in nature.
Figure 1. Directional transcription of core promoters.

a, Unidirectional transcription of diverse types of core promoters, ± 50 bp in respect to the +1 TSS (marked by the arrow) in vitro. See also Figure S1. b, Directionality of the core promoter and promoter regions (n = 15,474) as mapped by 5′-GRO-Seq in HeLa S3 cells, plotted as percent antisense activity (5′end read counts in a given antisense window divided by that number plus the counts in the forward TSS cluster) for different windows upstream of forward TSS (see Experimental Procedures). Blue = −50 to +50, orange = −150 to −50, red = −250 to −150, and green = −350 to −250. c, Distribution of distances between divergent pairs of 5′GRO-Seq-defined TSSs (n = 3865). Reverse transcription start sites were mapped relative to their corresponding +1 forward start site.
These biochemical observations were corroborated genome-wide by mapping HeLa S3 cell TSSs via 5′end-selected global run-on followed by sequencing (5′-GRO-seq), which captures initiation events of nascent transcripts at single-nucleotide resolution, irrespective of transcript stability (Kruesi et al., 2013; Lam et al., 2013). After clustering the resulting genome-wide sequence tags, 77.4% (11,985 out of 15,474) of the TSS clusters of annotated genes did not exhibit any reverse direction transcription in the core promoter region (−50 to +50; Figure 1b; blue line). These data thus indicate that most human core promoters are inherently unidirectional both in vitro and in cells.
The locations of reverse direction transcription initiation were found to occur at variable distances from the forward TSSs (Figure 1b). We identified 3,865 divergent promoter pairs, each of which comprises two TSS clusters (each with density signal over background and at least 10 reads; see Experimental Procedures), one associated with an annotated gene (in the forward direction) and one reverse-directed in a non-annotated 5 kb upstream genomic region. The preferred distance between divergent TSS pairs is approximately 200 bp (Figure 1c), which is clearly outside of the forward core promoter region.
Reverse-direction initiation from distinct core promoters at NFR edges
To examine the potential relationship between reverse direction promoters and chromatin structure, we overlaid our 5′-GRO-seq TSS data with the genome-wide HeLa S3 DNase I-seq data from ENCODE (Bernstein et al., 2012; Thurman et al., 2012). We anchored promoters at the midpoint between the forward and reverse TSSs and ordered them by the paired inter-cluster distance and observed a striking pattern in which the variable distances between the two divergent peaks of 5′-GRO-seq signal are entirely filled by DNase I hypersensitive DNA (Figure 2a). Hence, in divergent promoters, initiating RNA polymerase II flanks the borders of nucleosome-free regions (NFRs), consistent with locations where engaged RNA polymerase II (as measured by GRO-seq or TSSa-RNAs) and yeast pre-initiation complexes were shown to accumulate (Core et al., 2008; Rhee and Pugh, 2012; Seila et al., 2008).
Figure 2. Transcription initiation from divergent core promoters occurs at edges of open chromatin.

a, Normalized 5′-GRO-Seq (blue) read 5′end counts and DNaseI-seq (orange) read 5′end counts in bins of 10, ±0.5 kb from the center point of divergent TSS pairs (n = 3865; see Experimental Procedures), ranked from top to bottom by increasing distance between pairs. b, Genomic DNA sequence of divergent TSS pairs centered and ranked as in “a”. Bases ‘A’ and ‘T’ are yellow, bases ‘C’ and ‘G’ are blue. See also Figures S2 and S3. c, TATA-sensitive in vitro transcription of reverse directed core promoters. +1 TSS is marked by the arrow.
The high resolution of the 5′-GRO-seq assay enabled the identification of the most utilized nucleotide (mode) within each TSS cluster (Ni et al., 2010). We reasoned that anchoring plots with respect to these modes might allow us to visualize single nucleotide promoter sequence preferences, and thus gain insights into the specific features of forward and reverse TSSs (Figure 2b). Three immediate observations are apparent. First, it is evident that the increasing width of center-enriched GC content directly corresponds to the NFR (Figure 2b), which is consistent with previous reports showing a direct relationship between GC content and nucleosome positioning (Fenouil et al., 2012). Second, there is a large domain of AT enrichment upstream but not downstream of the NFR, likely reflecting depletion of coding sequence and the recently reported asymmetry of 5′ splice site/cleavage site ratios upstream and downstream of divergent promoters (Almada et al., 2013; Ntini et al., 2013). Third, two symmetric and parallel arches of enriched AT content correspond to the TSS mode (outer arch) and −30 (relative to the TSS mode; inner arch) regions for both the forward and reverse 5′-GRO-seq TSS clusters. Position-specific three-mer frequencies, as well as motif scans for TATA-box and Initiator, suggest that these arches contain initiator-like and TATA-box-like sequences, respectively (Figure S2).
To investigate the core promoter activity of the region that encompasses the reverse direction start sites, DNA sequences from −50 to +50 (relative to the “+1” reverse direction start sites, which we term FR for “forward” transcripts in the reverse direction) were cloned and subjected to in vitro transcription analysis (Figure 2c). Strong, unidirectional (data not shown), and TATA box-dependent transcription was detected. These observations, together with high scores from a computational position-specific TSS sequence model (Frith et al., 2008) (Figure S3), show that the reverse direction, non-annotated TSS clusters result from distinct reverse direction core promoters with DNA sequence elements that are similar to those of their forward, TSS-annotated counterparts. Both the forward and reverse core promoters have their own non-overlapping sequences that are enriched within the edges of open chromatin. This two-core-promoter model is consistent with general transcription factor ChIP-exo studies in yeast (Rhee and Pugh, 2012) and is distinct from previously proposed passive models of mammalian divergent initiation such as the nonspecific transcription resulting from the presence of open chromatin, the enhancement of transcription via the carboxy terminal domain (CTD) of the forward direction polymerase, or the stimulation of reverse transcription via the accumulation of negative supercoiling due to forward direction transcription (Seila et al., 2008, 2009).
Up to half of active promoters are intrinsically unidirectional
Visual inspection of raw 5′GRO-seq data together with DNase I-seq made it clear that NFRs also have the potential to harbor promoter regions where transcription occurs in one direction only (Figure 3a). Such examples, together with the observed relationship between divergent TSS pair distances and DNase I sensitivity (Figure 2a; Figure 3b), provided an opportunity to switch from arbitrary distance cutoffs to a concrete definition of promoter regions (comprising a proximal promoter and its associated TSS clusters) based on functional genome-wide data. To this end, we subjected the DNase I-seq data to peak calling using the recent JAMM algorithm (Ibrahim et al., 2014) (Figure S4a–c) and intersected these highly accurate DHSs with the 5′GRO-seq TSS data. This approach defined 4,378 promoters containing exactly one TSS-annotated 5′-GRO-seq cluster in the forward direction (see Experimental Procedures). Of these 4,378 promoters, 400 (9.1%) had an additional reverse cluster aligning to another annotated TSS (annotated bidirectional; example shown in Figure 3c); 1,741(39.8%) were found to be divergent (i.e., contain a second upstream reverse TSS falling into a non-annotated region); and 2,237 (51.1%) were unidirectional with only one TSS cluster orientated toward the gene.
Figure 3. Examples of divergent, unidirectional, and bidirectional transcription.

Browser snapshots of examples displaying genes where divergent transcription is absent (a; unidirectional), present (b; divergent), or occurring at annotated bidirectional genes (c; bidirectional). Shown is DNaseI-seq signal as generated by JAMM in black and 5′GRO-seq reads in red for the + strand and blue for the − strand.
Our DHS-based promoter region definition thus enabled a comparative analysis of reverse regions – whether or not they are transcribed – for both unidirectional and divergent promoters. We anchored the divergent (Figure 4a) and unidirectional (Figure 4b) promoters based on their DHS centers and ordered them by their DHS widths. Since border proximity of start sites within the DHS was not part of our selection criteria, these plots revealed the symmetric enrichment of 5′-GRO-seq signal around both edges of the divergent promoter DHSs as suggested in Figure 2a, and an asymmetric forward edge-only enrichment for the unidirectional promoters. The experimentally/computationally defined DHS edges extend a consistent ~70 bp average distance downstream of all three 5′-GRO-seq TSS cluster groups (divergent forward and reverse, and unidirectional forward), suggesting that the TSSs are directly adjacent to either the −1 or +1 nucleosomes (Figure S4d–e). ChIP-seq reads for TAF1 or H2AZ verify the lack of transcription initiation upstream of the unidirectional promoters and show strong signal for the +1 and −1 nucleosomes of both promoter groups (Figure 4c). Also, in agreement with a depletion of divergent transcription, the unidirectional promoter DHSs show reduced average signal for TAF1 ChIP-seq, TBP ChIP-seq, and traditional GRO-seq in their reverse regions (Figure S5a–c). Importantly, these data suggest that about half of the expressed, DHS-defined promoters regions are unidirectional, and are in stark contrast to the theory that divergent transcription is a general feature of eukaryotic promoters (Neil et al., 2009; Sigova et al., 2013).
Figure 4. Many promoter DHSs lack core promoter sequences necessary for divergent transcription.

a, b, Normalized 5′-GRO-Seq (blue) read 5′end counts and DNaseI-seq (orange) read 5′end counts in bins of 10 bp, ±1 kb from the center point of divergent (a; n = 1741) and unidirectional (b; n = 2237) promoter DHSs (see Experimental Procedures) ranked from top to bottom by increasing DHS width. See also Figure S4. c, Normalized, fragment-extended H2AZ (top) and TAF1 (bottom) ChIP-seq read counts in bins of 10 bp for divergent (left) and unidirectional (right) DHSs centered and ranked as above. See also Figure S5. d, Predicted TSS scores around corresponding DHS edges resulting from a position-specific Markov chain model (see Experimental Procedures) trained on ±50 nucleotides around divergent forward TSS. Blue = divergent forward, light blue = divergent reverse, red = unidirectional forward, orange = unidirectional reverse. See also Tables S1 and S2.
Why do DHSs associated with unidirectional promoters lack reverse transcription from their upstream edges? Given our previous observations (Figure 2), we wondered, in particular, whether unidirectional promoters contain functional core promoters in the reverse direction. To test this idea, we turned to the position-specific TSS sequence model (Frith et al., 2008). After training the model on different subsets of core promoter sequences +/− 50 bp around the forward TSSs of the divergent promoters (see Experimental Procedures), the model was used to scan the upstream and downstream DHS edges of independent unidirectional and divergent promoters (Figure 4d). The model reported high scores about 70 bp upstream of both edges of the divergent promoter DHSs and the forward edge of unidirectional promoter DHSs, consistent with the relative location of 5′-GRO-seq clusters (Figure S4e; see above). In contrast, the upstream edge of the unidirectional promoter DHSs shows an altogether different pattern of lower scores that are more evenly distributed throughout the window (Figure 4d, orange). Thus, these findings suggest that the unidirectionality of these promoters is due to the lack of a reverse direction core promoter at the upstream edge of the NFR.
Characteristics of divergent and unidirectional promoters
Divergent and unidirectional promoter DHSs show similar frequencies of previously described initiation patterns (Ni et al., 2010) in the forward direction as well as the reverse directions, an observation that suggests mechanistic similarities between forward- and reverse-directed initiation (Figure 5a). In contrast to previously proposed models (Core et al., 2012; Lepoivre et al., 2013), divergent and unidirectional promoters exhibit comparable CpG island (CGI) content (Figure 5b). Furthermore, forward start sites of divergent promoters exhibit a lower percentage of canonical TATA boxes but higher levels of in vivo TBP recruitment than unidirectional promoters (Figure 5c and d). While divergent and unidirectional promoter DHSs show some subtle differences in their size, their overall similarities in DHS width and histone ChIP-seq signal bimodality in HeLa cells (Figure 4c; Figure 5e; Figure S6) suggest that reverse-direction transcriptional activity is not necessary for positioning of the −1 nucleosome as previously postulated (Seila et al., 2009). Of note, the reverse TSSs from the divergent group show fewer TATA-like sequences than the forward TSSs (Figure 5c–d), consistent with their lower scores in the TSS prediction model (Figure S3d). Divergent promoters also show higher expression levels in the forward direction than unidirectional promoters as measured by ENCODE whole cell polyA+ CAGE data (Bernstein et al., 2012) (Figure S5d).
Figure 5. Characteristics of divergent and unidirectional promoters.

a, Percentage of initiation patterns defined by Ni et al. for forward 5′-GRO-seq clusters of the DHS-defined divergent and unidirectional promoter groups and reverse clusters of divergent group. b, Percentage of divergent or unidirectional promoter DHSs intersecting an annotated CpG island (left; see Experimental Procedures). Size distributions of CpG islands that intersect divergent or unidirectional promoter DHSs (right; see Experimental Procedures). c, Percent of forward direction 5′-GRO-seq clusters containing a TATA motif match from −35 to −25 relative to the cluster mode for forward 5′-GRO-seq clusters of divergent and unidirectional promoters and reverse clusters of the divergent group (left; see Experimental Procedures) and the distributions of the corresponding scores (right). d, Positional average fragment-extended ChIP-seq read counts within TBP peak summits as called by SISSRS in bins of 10 nucleotides for TATA-containing and TATA-less forward and reverse core promoter subsets of divergent or forward only for unidirectional promoters (see Experimental Procedures). e, Distributions of DHS widths for unidirectional, divergent, and bidirectional promoter groups. See also Figures S4 and S5 and Table S2.
Unique chromatin environment of divergent promoters
It has been previously proposed that divergent transcription could explain the bimodal distribution of many histone modifications around TSSs (Core et al., 2008; Seila et al., 2008). In this regard, our concrete definitions of both divergent and unidirectional promoters enabled us to ask two questions: first, are there differences between the histone modifications of the +1 versus −1 nucleosomes at divergent promoters; and second, are the modifications of the unidirectional −1 nucleosome different from those of the divergent −1 nucleosome? To address these questions, we employed a Hidden Markov Model framework for a high-resolution, unsupervised clustering of histone modifications in the HeLa genome based on ENCODE HeLa S3 H3K4me1-3 and H3K27ac ChIP-seq datasets (Bernstein et al., 2012) (see Experimental Procedures). We identified eight genome-wide chromatin states: four proximal promoter states described below; an “inactive enhancer” state characterized by H3K4me1 enrichment; an “active enhancer” state with H3K4me1/H3K27ac; a “transcribed enhancer” state with H3K4me1/H3K4me2/H3K27ac, which intersects strongly with enhancer-RNA-based definitions made by the FANTOM5 Consortium (Andersson et al., 2014) (Figure S6a); and a background state that does not show enrichment for any of the analyzed histone modifications (Figure 6a). A meta-analysis of divergent and unidirectional promoters (Figure 6b and 6c) displays a clear cascade of chromatin state enrichments in the forward directions of both groups, where H3K4me3 and H3K27ac are found together at the +1 nucleosome location (“promoter state1”), followed by the gain of H3K4me2 (“promoter state 2”), then the loss of H3K27ac (“promoter state 3”), and finally the loss of H3K4me3 (“promoter state 4”). Indeed, the same cascade can be observed in both directions of annotated bidirectional promoter DHSs (Figure 6d).
Figure 6. Distinct chromatin environment at unidirectional, bidirectional, and divergent promoter DHSs.

a, Chromatin state definitions based on Hidden Markov Model clustering of histone modification ChIP-Seq signal at 10 base pair resolution (see Experimental Procedures). Each state is a multivariate Gaussian distribution. Shown are the distribution mean vectors representing scaled, normalized ChIP-Seq signal. b, c, d, e, Chromatin state coverage ±2kb around the center of divergent promoter DHS (b), unidirectional promoter DHS (c), bidirectional promoter DHS (d), and divergent intergenic DHS (e) at single nucleotide resolution. Grey = DNaseI-seq read 5′end counts, red = Promoter State1, blue = Promoter State 2, green = Promoter State 3, light blue = Promoter State 4, black = Inactive Enhancer, yellow = Active Enhancer, pink = Transcribed Enhancer, orange = Background. See also Figure S6.
It is particularly notable, however, that in the reverse direction of divergent promoters, there is an enrichment of promoter state 2 (H3K4me2-3 and H3K27ac; Figure S6) immediately downstream of the FR TSS at the −1 nucleosome location (Figure 6b). Promoter state 2 is enriched in the forward direction after promoter state 1, a state clearly absent in the reverse direction. Of note, the preference of promoter state 2 is absent at intergenic transcribed enhancers, which are characterized by high levels of H3K4me1-2 and H3K27ac (Figure 6e). There is also a slight enrichment of the transcribed enhancer state (H3K4me1-2 and H3K27ac; Figure S6) around the −2 nucleosome of the divergent promoters; this may be the result of the overlap of promoter states 2 and 3 in that region. The lack of chromatin state preference on the reverse side of the unidirectional DHSs (Figure 6c; Figure S6b), despite detectable average signal for all marks (Figure S6c–f), suggests that the act of reverse transcription leads to the co-occurrence of the modifications in promoter state 2 (H3K4me2, H3K4me3, and H3K27ac) at the −1 nucleosome.
Discussion
We have proposed a delineation of promoter regions based on DNase I hypersensitivity that reflects the local chromatin environment, is based on functional genomic data, and is independent of a selected distance cutoff. The basal RNA polymerase II transcription machinery initiates unidirectionally from core promoter sequences enriched at one (unidirectional) or both (divergent/bidirectional) edges of such regions. This model is in contrast to the hypothesis that a large majority of human promoters are transcribed in both directions. Reverse-directed core promoters are necessary for divergent transcription, with which they stimulate a unique chromatin signature, but not for −1 nucleosome positioning (Figure 7). While other mammalian studies have shown accumulation of RNA polymerase II activity at the edges of the NFR (Core et al., 2008; Seila et al., 2008), the initiating locations were not known since neither traditional GRO-seq nor TSS-associated small RNAs (TSSa-RNAs) detect actual start sites. The model proposed herein is consistent with ChIP-exo based studies in yeast describing pre-initiation complex formation around both edges of the NFR with a corresponding enrichment of core promoter sequence elements (Rhee and Pugh, 2012). The in vitro studies presented above go a step further and validate the capabilities of such reverse core promoter sequences in basal transcription initiation (Figure 2c).
Figure 7. Model of divergent, bidirectional, and unidirectional promoters.
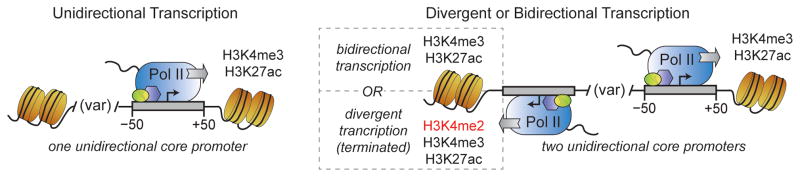
For each type of promoter, +1 and −1 nucleosome positions occur at variable spacing from each other, forward gene transcription initiates just inside the downstream edge of the NFR, and the +1 nucleosome is modified with H3K4me3 and H3K27ac. When transcription initiation occurs from the upstream NFR edge on the opposite strand from the forward gene, the −1 nucleosome gets similarly modified when stable, annotated transcripts are present (for bidirectional promoters), or is enriched for H3K4me2, in addition to H3K4me3 and H3K27ac, when divergent transcription occurs (i.e., when unstable non-coding transcripts are generated).
Our higher estimate of unidirectional promoters compared to previous studies is most likely due to the anchor points and windows considered for measurement. First, while some studies consider windows both upstream and downstream of annotated TSSs to measure “divergent” transcription, this is only necessary to counteract the inaccuracies of such annotations. Since we use data to define our start sites (5′GRO-seq), with genome annotation only serving as a rough guide, we can be confident that our upstream antisense signal is truly “divergent” and excludes downstream “convergent” or “antisense” events. Second, the common practice of using a uniform window size (i.e. +/− 1 or 2 kb around TSSs) for all promoter regions is likely to overestimate divergent activity due to the relationship between reverse TSSs and the NFR (Figure 2a), the typical NFR width of ~250 bp (Figure 5e), and the potential for other independent transcribed proximal regulatory elements and/or RNA gene loci. If applied equally to forward- and reverse-directed transcription, changes in background cutoffs or sequencing depth is likely to change the number of both unidirectional and divergent promoters, while keeping the ratio relatively constant. We tested this idea on previously published exosome-knockdown CAGE data (Ntini et al., 2013), a technique also capable of mapping TSSs of rapidly degraded transcripts (Table S1)., and observed a comparable percentage of unidirectional DHSs (47% by CAGE versus 51% by 5′GRO-seq). It is however possible that HeLa cells display a higher percentage of unidirectional promoters than other cell types, and that some genes may be regulated by unidirectional and divergent alternative promoters.
A small group of core promoters may be intrinsically bidirectional (Figure 1b, Figure S1a). In these cases, it is likely that the core promoter element configuration permits bidirectionality (as evidenced by the “crossing” of the AT-rich sequences in the −30 region at the top of Figure 2b). However, the vast majority of core promoters are inherently unidirectional: of 3,865 divergent TSS pairs, ~95% initiate greater than 50 nucleotides upstream of the forward TSS. While the sequences of reverse-directed core promoters are very similar to those of their forward counterparts, there are differences as evidenced by reduced enrichment of AT content in the −30 region (Figure S2a–b) and lower scores in the TSS prediction model (Figure S3c and d; Figure 4d). This difference may be reflected in the overall lower levels of basal transcription factor recruitment and transcription from reverse-directed core promoters (Figure S4a–c) as well as the lower levels of −1 nucleosome histone modification, compared to the +1 nucleosome, in divergent promoters (Figure S5c–f). Indeed, while forward TSS prediction scores and H3K27ac ChIP-seq signal both correlate with forward 5′-GRO-seq signal, these correlations are slightly reduced on the reverse side of the divergent DHSs (Table S2).
Divergent transcripts are now known to often be terminated quickly and subjected to rapid decay (Almada et al., 2013; Brannan et al., 2012; Ntini et al., 2013). The reported enrichment of AT-rich cleavage/polyadenylation sequences upstream of divergent TSSs, which lead to this termination/decay mechanism, is reflected in the increased “yellow” color (AT content) on the left side of Figure 2b. Connecting these observations with the relative shift of chromatin promoter state 2 upstream versus downstream in divergent promoters (Figure 6b) suggests that the location of histone modifications is sensitive to extended transcription elongation and/or nuclear RNA decay rates. Alternatively, this shift in chromatin states could reflect the subtle differences in the core promoter sequences between the forward and reverse directions (Figure S2a–c; Figure S3c–d). Histone H3K4 methyltransferases are known to be associated with the carboxyl terminal domain of RNA polymerase II (Greer and Shi, 2012; Hsin and Manley, 2012), supporting the observation that the –l nucleosomes of unidirectional promoters lack coordinated histone modification (Figure 6c; Figure S6).
The frequent but not universal presence of reverse-directed core promoters poises them as candidate regulators of forward transcription. Such a regulation may be reflected in the overall higher expression of both bidirectional and divergent promoters, compared to unidirectional promoters, as measured by basal transcription factor recruitment, histone modification levels, and whole cell CAGE tag counts (Figure S5; Figure S6). This points to a possible mechanism whereby reverse-directed core promoters within the upstream edges of divergent or bidirectional promoter DHSs increase local concentrations of initiation machinery, resulting in increased expression of the forward gene (Figure S5d). In this study, we have been able to clarify the functional similarities and differences between unidirectional and divergent promoters, but the underlying reasons, if any should exist, why promoters are unidirectional or divergent remain to be illuminated.
Experimental Procedures
Cell culture conditions
HeLa S3 cells were grown at 37°C in DMEM (Cellgro) supplemented with 10% FBS (Gibco), 50 U Penicillin and 50 μg Streptomycin per mL (Gibco).
In vitro transcription assays
Core promoter sequences, ±50 bp in respect to the +1 TSS, were cloned and transcription reactions were carried out as described previously (Duttke, 2014). Transcripts were subjected to primer extension analysis and separated by urea-polyacrylamide gel electrophoresis.
5′GRO-seq and GRO-seq preparation
5′GRO-seq was performed as described previously (Lam et al., 2013). Briefly, about 107 HeLa S3 nuclei were used for run-on with BrU-labelled NTPs. Fragmented transcripts were incubated with polynucleotide kinase (PNK, NEB) to remove 3′ phosphates. BrU-labelled nascent transcripts were subsequently immunoprecipitated with anti-BrdU agarose beads (Santa Cruz Biotech). For 5′GRO-seq, immunoprecipitated RNA was dephosphorylated with calf intestinal phosphatase (NEB). Then 5′ capped fragments were de-capped with tobacco acid pyrophosphatase (Epicentre). Illumina TruSeq adapters were ligated to the RNA 3′ and 5′ends with truncated mutant RNA ligase 2 (K227Q) and RNA ligase 1 (NEB), respectively. Reverse transcription was performed with Superscript III (Invitrogen) followed by PCR amplification for 12 cycles. Final libraries were size selected on PAGE/TBE gels to 175–225 bp.
GRO-seq was essentially performed as 5′GRO-seq but the immunoprecipitated RNA was directly de-capped with tobacco acid pyrophosphatase (Epicentre) and subsequently kinased with PNK (NEB) prior to adapter ligation.
5′-GRO-seq and GRO-seq analysis
Two replicates of 5′end sequenced reads from the 5′-GRO-seq or traditional GRO-seq protocols were trimmed for adapters using cutadapt (Martin, 2011) and mapped together to the hg19 human genome using Bowtie2 with default settings (Langmead and Salzberg, 2012). Reads that did not map uniquely and reads overlapping rRNA loci were removed, yielding 27,512,149 5′-GRO-seq reads and 21,765,842 traditional GRO-seq reads. Clusters were identified according to the strategy described in Ni et al. (Ni et al., 2010). To annotate the identified clusters, the Genomic Features R package (Lawrence et al., 2013) was used with the UCSC knownGenes table.
DNase-seq and ChIP-seq analysis
All 5 datasets of ENCODE-mapped DNase-seq reads for HeLa-S3 cells were downloaded from the UCSC ENCODE ftp server (Bernstein et al., 2012) and concatenated before peak calling with JAMM v1.0.6 (Ibrahim et al., 2014) (http://code.google.com/p/jamm-peak-finder/, settings: -m narrow -f 1). HeLa-S3 cell TAF1, TBP, and histone modification ChIP-seq raw fastq files were downloaded from the UCSC ENCODE ftp server (Bernstein et al., 2012). Reads were aligned to hg19 genome using Bowtie2 (Langmead and Salzberg, 2012) with default parameters and then filtered for those that did not align uniquely or had more than two mismatches. For TAF1 and TBP, replicate BED files were then concatenated before peaks were called using SISSRS (Narlikar and Jothi, 2012), while JAMM was used for histone modification peak calls that served as input to the HMM (see below and Supplemental Experimental Procedures).
Closest upstream antisense pair assignments
In order to define a set of 5′-GRO-seq cluster pairs that were reciprocally the closest upstream antisense of each other, a combination of BEDTools and custom scripts was used. BEDTools closest command (Quinlan and Hall, 2010) (settings: -S -id -D “a”) was run on the modes of 5′-GRO-seq clusters (the cluster position with the highest read count) using the same file for both inputs. Custom Perl scripts were then used to parse the BEDTools output for only those cluster pairs where both modes were called as closest upstream antisense of each other.
DHS-defined promoter borders
BEDTools (Quinlan and Hall, 2010) intersect command was used to find overlaps between DNaseI-seq peak calls (defining DHSs) and 5′-GRO-seq cluster modes, both described above. DHSs with exactly one intersecting TSS cluster mode were considered unidirectional. DHS with exactly two intersecting 5′-GRO-seq cluster modes, for which the two modes were upstream and antisense of each other, one annotating as TSS and the other as intergenic, were considered divergent. DHSs with more than one intersecting 5′-GRO-seq cluster modes on any one DNA strand, or with two 5′-GRO-seq cluster modes on opposite strands but downstream of each other, were removed from further analysis. Unidirectional classified DHSs intersecting reverse-side annotated TSSs (yet having no 5′GRO-seq clusters) or containing exactly one TSS-annotating cluster mode that was also part of divergent or bidirectional reciprocal closest upstream antisense selections (described above) were considered ambiguous and removed from further analysis.
Plotting
All plots were made using the ggplot2 R package (Wickham, 2009). Anchor points were set by calculating the center point between the 5′-GRO-seq cluster modes of the paired forward/reverse TSS clusters or the center point of DHSs. Strand assignments were made according to the forward gene for divergent cluster pairs or unidirectional promoter DHS. For TSS-TSS or intergenic-intergenic 5′-GRO-seq cluster pairs, the cluster with higher read counts was used for strand assignment. For heat maps, windows were ranked from top to bottom by increasing distance between forward and reverse TSSs, or by DHS width.
Heat map- and meta-analyses
For 5′-GRO-seq and DNaseI-seq heat maps, the number of reads whose 5′end mapped to each position were counted independent of strand and scaled so that the minimum value for each window is 0 and the maximum value is 1. For TAF1 and H2AZ ChIP-seq heat maps, reads were extended by the fragment size calculated by JAMM and the number of extended reads falling in 10 bp bins was plotted as above.
For sequence heat maps, BEDTools getfasta command (Quinlan and Hall, 2010) was used to retrieve the sequence corresponding to each window.
TSS initiation pattern analysis
NarrowPeak, BroadPeak, and WeakPeak initiation patterns as defined previously (Ni et al., 2010) were determined from the 5′-GRO-seq clusters with at least 25 read counts.
Probabilistic model of transcription start sites
We estimated parameters for a previously published position-specific Markov chain TSS model (Frith et al., 2008) (PSMM) using a first-order setting. A 10-fold cross validation scheme of the PSMM (see Supplemental Experimental Procedures) was implemented. Receiver operator characteristic and precision recall curves were generated by defining true positives as the modes of 5′-GRO-seq clusters and true negatives as every other nucleotide in the tested windows, the results plotted for each of the 10 models from the closest upstream antisense selection using the R package ROCR (Sing et al., 2005).
Motif scanning
The TRANSFAC TATA-box binding protein or JASPAR Initiator position weight matrices (M00252) were used with the Scanner Toolset (Megraw et al., 2009) to scan sequences −35 to −25 upstream for TATA and +/− 5 for initiator around the forward or reverse TSS modes of the divergent and unidirectional promoter groups (see Supplemental Experimental Procedures).
CpG island (CGI) analysis
Genomic coordinates of CGI were taken from the UCSC table browser (Kuhn et al., 2013), reportedly calculated according to the criteria of Gardiner-Garden and Frommer (Gardiner-Garden and Frommer, 1987). Either divergent or unidirectional DHSs were intersected with these coordinates using BEDTools intersect (Quinlan and Hall, 2010).
Chromatin State Segmentation
We employed a continuous Hidden Markov Model (HMM), in which state emissions are represented by a multivariate Gaussian distribution fully defined by its means vector, corresponding to the signals’ means of the histone modification tracks (see Supplemental Experimental Procedures), and its co-variance matrix. To learn the emission and transition parameters of the HMM, we employ the Baum-Welch algorithm (Bilmes, 1997; Taramasco and Bauer, 2013), initialized via k-means, on “semi-binarized” signal tracks of chromosome 1 at 10-basepair resolution (see Supplemental Experimental Procedures). The mean vector for each state defines the average ChIP-Seq signals of the histone modification tracks in the corresponding state. We 0-to-1 scale the means across each histone modification to define the prototypical chromatin states shown in Fig. 6a. Finally, we employ the Viterbi decoding algorithm (Taramasco and Bauer, 2013; Viterbi, 1967) to assign a chromatin state to each 10-basepair bin in the genome that had a peak in at least one of the histone modification tracks based on the HMM model learned by the Baum-Welch algorithm. Locations that did not have a peak in any histone modification track are not assigned a state. Book-ended bins that have the same state are merged. The output of this process is genome segmentation into variable-width non-overlapping chromatin states similar to Segway (Hoffman et al., 2012) and ChromHMM (Ernst and Kellis, 2012).
Chromatin State Analysis
Chromatin state coverage plots were calculated by intersecting the promoter regions with state assignments at single-basepair resolution using BEDTools (Quinlan and Hall, 2010) intersect command and plotting the fraction of each position across promoters for each state.
Supplementary Material
Figure S1 | Transcription from a divergent core promoter, related to Figure 1. Human FGB as an example of a divergent core promoter. The polarity depends on the DNA sequence. Promoters were cloned from +50 to −125 (relative to the +1 transcription start site) to allow reverse initiation within the natural sequence. The reverse Inr (rInr) sequence “TCAGAA” was substituted with “TCGGTC” (rInr−) or a consensus Inr “TCAGTC”(rInr+).
Figure S2 | Sequence content of forward and reverse TSSs, related to Figure 2.
a, b, Position-specific threemer counts normalized to total threemer frequencies for forward (a) and reverse (b) direction core promoters −50 to +50 bp around the 5′-GRO-seq cluster modes. c, Percent of forward or reverse TSSs that show motif matches to either initiator (left) or TATA-box (right) in the −35 to −25 or −5 to +5 regions, respectively, from the 5′-GRO-seq cluster modes. Different colors represent different false positive rate (FPR) cutoffs.
Figure S3 | Performance and results of TSS sequence model, related to Figures 2 and 4. a, b, Receiver operator characteristic (a) and precision-recall (b) curves for the sequence model described in Frith et al, 2008, trained and tested with a 10-fold cross validation +/− 50 bp around the mode of the forward TSSs from the divergent promoter pairs described in Figure 2 (see Experimental Procedures). c, Average predicted TSS scores per position for sequences +/− 50 bp around the mode of the corresponding TSSs from the divergent promoter pairs described in Figure 2, or its shuffled control, from the model trained as in “a” and “b” (see Supplemental Experimental Procedures). d, Distributions of 5′GRO-seq cluster mode TSS prediction scores for forward and reverse TSSs.
Figure S4 | DHS peak call accuracy and characteristics, related to Figures 4 and 5. a, b, c, Heat maps of normalized DNaseI-seq read 5′end counts (blue) anchored on each DHS midpoint and ranked by increasing DHS width together with the location of JAMM-called peak edges (black) for divergent (a), unidirectional (b), and bidirectional (c) promoter DHSs. d, Scatter plot of DHS width versus distance between forward and reverse 5′-GRO-seq cluster modes of divergent promoters. e, Boxplots of distance between 5′-GRO-seq cluster modes and corresponding DHS edges, dot = mean.
Figure S5 | Unidirectional promoters lack upstream hallmarks of divergent transcription, related to Figures 4 and 5. a, b, Positional average fragment-extended ChIP-seq read counts within Taf1 (a) and Tbp (b) peak summits as called by SISSRS in bins of 10 nucleotides (see Supplemental Experimental Procedures). c, Positional average of normalized read 5′end counts of traditional GRO-seq for the forward (red and blue) or reverse (orange and light blue) directions of the divergent (red and orange) or unidirectional (blue and light blue) promoters (“normalized counts” refers to 0-to-1 scaling of read counts for every DHS window, see Supplemental Experimental Procedures). d, Distributions of whole HeLa cell, polyA-plus CAGE tag 5′end counts from ENCODE intersecting designated 5′GRO-seq clusters.
Figure S6 | Histone modifications HMM characteristics and analysis, related to Figure 6. a, Chromatin state – Genome Annotation enrichment map (see Supplemental Experimental Procedures). “Genes” are entire UCSC gene lengths, “TSS” are UCSC known gene transcription start sites, “TES” are UCSC known gene transcription end sites, “TSS 4kb” and “TES 4kb” are windows centered around UCSC TSSs and TESs respectively going 2kb upstream and downstream, “F5 Enhancers” are enhancers identified by the Fantom5 consortium for the hg19 genome build, “F5 Enhancers 2k” are windows centered around the midpoints of F5 Enhancers going 1kb downstream and 1kb upstream, “CGI” are UCSC “CpG” islands. b, Percentage of chromatin state intersections at 75 bp downstream of the NFR edges. “No State” refers to those locations that did not intersect any chromatin state. c, d, e, f Average fragment-extended read counts of H3K27ac (c), H3K4me3 (d), H3K4me2 (e), and H3K4me1(f) ChIP-seq in bins of 10 nucleotides for divergent (blue), unidirectional (red), bidirectional (green), and intergenic (light blue) 5′-GRO-seq-containing DHSs (see Experimental Procedures). grey = average DNaseI-seq read 5′end counts for DHSs from all four groups combined.
Table S1 | Comparison of 5′GRO-seq and exosome KD CAGE analyses, related to Figure 4. The same analyses were performed on both datasets using the same DHS peaks calls as described in the Supplemental Experimental Procedures. Margin numbers indicate the number of DHSs that were identified in each group from each dataset. Table numbers indicate the overlap between DHS classes between the two datasets. The most conservative estimate for percentage of unidirectional promoters is 34% (1196/3499) when only considering DHSs with forward gene evidence in both datasets, from which unidirectional DHSs are consistently classified in both datasets and divergent/bidirectional DHSs identified in at least one dataset. It is likely that many of the forward TSS-containing DHSs (unidirectional, divergent, or bidirectional) identified in only one of the two datasets are true; when these are included, we estimate that the true percentage of unidirectional promoters is closer to 44% (3394/7707).
Table S2 | Correlations between 5′GRO-seq and TSS prediction score or H3K27ac ChIP-seq, related to Figure 4.
Spearman Rho correlation values are shown with corresponding p values between 5′GRO-seq read 5′end counts within called clusters (top) and either the TSS prediction score (left top) or H3K27ac ChIP-seq fragment-extended read counts intersecting a window 148 bp downstream of the appropriate DHS peak edge (left bottom).
Table S3 | Final_Cluster Sets.xlsx, related to Figure 1.
5′GRO-seq cluster calls as identified using the strategy described in Ni et al. (Ni et al., 2010) and Supplemental Experimental Procedures.
Acknowledgments
We are grateful to Dr. Carmelo Ferrai for critical reading of the manuscript and to Dr. Neelanjan Mukherjee for useful discussions. J.T.K. is the Amylin Chair in the Life Sciences. S.H.C.D. is the recipient of the University of California at San Diego Molecular Biology/Cancer Center Fellowship. This work was supported by a grant from the National Institute of Health to J.T.K. (R01 GM041249). M.I. is supported by the MDC-NYU graduate program.
Footnotes
Data Accession
The data discussed in this publication have been deposited in NCBI’s Gene Expression Omnibus (Edgar et al., 2002) and are accessible through GEO Series accession number GSE63872 (http://www.ncbi.nlm.nih.gov/geo/query/acc.cgi?acc=GSE63872).
Author Contributions
S.H.C.D. performed all in vitro assays. S.H.C.D and S.H. performed 5′-GRO-seq and GRO-seq assays with guidance and support from C.B. and C.K.G. D.L.C. wrote the program for transcription start site peak calling. M.M.I. performed all peak calling and generated the HMM and its associated analyses. S.A.L. performed all other analyses. S.H.C.D. and J.T.K. initiated the study and S.A.L., M.M.I. and U.O. designed the overall analysis framework. S.A.L., S.H.C.D., M.M.I., J.T.K., and U.O. wrote the manuscript.
Publisher's Disclaimer: This is a PDF file of an unedited manuscript that has been accepted for publication. As a service to our customers we are providing this early version of the manuscript. The manuscript will undergo copyediting, typesetting, and review of the resulting proof before it is published in its final citable form. Please note that during the production process errors may be discovered which could affect the content, and all legal disclaimers that apply to the journal pertain.
References
- Adachi N, Lieber MR. Bidirectional gene organization: a common architectural feature of the human genome. Cell. 2002;109:807–809. doi: 10.1016/s0092-8674(02)00758-4. [DOI] [PubMed] [Google Scholar]
- Almada AE, Wu X, Kriz AJ, Burge CB, Sharp PA. Promoter directionality is controlled by U1 snRNP and polyadenylation signals. Nature. 2013;499:360–363. doi: 10.1038/nature12349. [DOI] [PMC free article] [PubMed] [Google Scholar]
- Andersson R, Gebhard C, Miguel-Escalada I, Hoof I, Bornholdt J, Boyd M, Chen Y, Zhao X, Schmidl C, Suzuki T, et al. An atlas of active enhancers across human cell types and tissues. Nature. 2014;507:455–461. doi: 10.1038/nature12787. [DOI] [PMC free article] [PubMed] [Google Scholar]
- Arigo JT, Eyler DE, Carroll KL, Corden JL. Termination of cryptic unstable transcripts is directed by yeast RNA-binding proteins Nrd1 and Nab3. Molecular Cell. 2006;23:841–851. doi: 10.1016/j.molcel.2006.07.024. [DOI] [PubMed] [Google Scholar]
- Bernstein BE, Birney E, Dunham I, Green ED, Gunter C, Snyder M. An integrated encyclopedia of DNA elements in the human genome. Nature. 2012;489:57–74. doi: 10.1038/nature11247. [DOI] [PMC free article] [PubMed] [Google Scholar]
- Bilmes J. Tech Rep. International Computer Science Insitute; 1997. A gentle tutorial on the EM algorithm and its application to parameter estimation for Gaussian mixture and Hidden Markov Models. ICSI-TR 97. [Google Scholar]
- Birney E, Stamatoyannopoulos JA, Dutta A, Guigó R, Gingeras TR, Margulies EH, Weng Z, Snyder M, Dermitzakis ET, Thurman RE, et al. Identification and analysis of functional elements in 1% of the human genome by the ENCODE pilot project. Nature. 2007;447:799–816. doi: 10.1038/nature05874. [DOI] [PMC free article] [PubMed] [Google Scholar]
- Bonn S, Zinzen RP, Girardot C, Gustafson EH, Perez-Gonzalez A, Delhomme N, Ghavi-Helm Y, Wilczyński B, Riddell A, Furlong EEM. Tissue-specific analysis of chromatin state identifies temporal signatures of enhancer activity during embryonic development. Nature Genetics. 2012;44:148–156. doi: 10.1038/ng.1064. [DOI] [PubMed] [Google Scholar]
- Boyle AP, Davis S, Shulha HP, Meltzer P, Margulies EH, Weng Z, Furey TS, Crawford GE. High-resolution mapping and characterization of open chromatin across the genome. Cell. 2008;132:311–322. doi: 10.1016/j.cell.2007.12.014. [DOI] [PMC free article] [PubMed] [Google Scholar]
- Brannan K, Kim H, Erickson B, Glover-Cutter K, Kim S, Fong N, Kiemele L, Hansen K, Davis R, Lykke-Andersen J, et al. mRNA decapping factors and the exonuclease Xrn2 function in widespread premature termination of RNA polymerase II transcription. Molecular Cell. 2012;46:311–324. doi: 10.1016/j.molcel.2012.03.006. [DOI] [PMC free article] [PubMed] [Google Scholar]
- Butler JEF, Kadonaga JT. The RNA polymerase II core promoter: a key component in the regulation of gene expression. Genes & Development. 2002;16:2583–2592. doi: 10.1101/gad.1026202. [DOI] [PubMed] [Google Scholar]
- Carninci P, Kasukawa T, Katayama S, Gough J, Frith MC, Maeda N, Oyama R, Ravasi T, Lenhard B, Wells C, et al. The transcriptional landscape of the mammalian genome. Science (New York, NY) 2005;309:1559–1563. doi: 10.1126/science.1112014. [DOI] [PubMed] [Google Scholar]
- Core LJ, Waterfall JJ, Lis JT. Nascent RNA sequencing reveals widespread pausing and divergent initiation at human promoters. Science (New York, NY) 2008;322:1845–1848. doi: 10.1126/science.1162228. [DOI] [PMC free article] [PubMed] [Google Scholar]
- Core LJ, Waterfall JJ, Gilchrist Da, Fargo DC, Kwak H, Adelman K, Lis JT. Defining the status of RNA polymerase at promoters. Cell Reports. 2012;2:1025–1035. doi: 10.1016/j.celrep.2012.08.034. [DOI] [PMC free article] [PubMed] [Google Scholar]
- Duttke SHC. RNA Polymerase III Accurately Initiates Transcription from RNA Polymerase II Promoters in Vitro. The Journal of Biological Chemistry. 2014;289:20396–20404. doi: 10.1074/jbc.M114.563254. [DOI] [PMC free article] [PubMed] [Google Scholar]
- Edgar R, Domrachev M, Lash AE. Gene Expression Omnibus: NCBI gene expression and hybridization array data repository. Nucleic Acids Research. 2002;30:207–210. doi: 10.1093/nar/30.1.207. [DOI] [PMC free article] [PubMed] [Google Scholar]
- Ernst J, Kellis M. ChromHMM: automating chromatin-state discovery and characterization. Nature Methods. 2012;9:215–216. doi: 10.1038/nmeth.1906. [DOI] [PMC free article] [PubMed] [Google Scholar]
- Fenouil R, Cauchy P, Koch F, Descostes N, Cabeza JZ, Innocenti C, Ferrier P, Spicuglia S, Gut M, Gut I, et al. CpG islands and GC content dictate nucleosome depletion in a transcription-independent manner at mammalian promoters. Genome Research. 2012;22:2399–2408. doi: 10.1101/gr.138776.112. [DOI] [PMC free article] [PubMed] [Google Scholar]
- Frith MC, Valen E, Krogh A, Hayashizaki Y, Carninci P, Sandelin A. A code for transcription initiation in mammalian genomes. Genome Research. 2008;18:1–12. doi: 10.1101/gr.6831208. [DOI] [PMC free article] [PubMed] [Google Scholar]
- Gardiner-Garden M, Frommer M. CpG islands in vertebrate genomes. Journal of Molecular Biology. 1987;196:261–282. doi: 10.1016/0022-2836(87)90689-9. [DOI] [PubMed] [Google Scholar]
- Greer EL, Shi Y. Histone methylation: a dynamic mark in health, disease and inheritance. Nature ReviewsGenetics. 2012;13:343–357. doi: 10.1038/nrg3173. [DOI] [PMC free article] [PubMed] [Google Scholar]
- Grzechnik P, Tan-Wong SM, Proudfoot NJ. Terminate and make a loop: regulation of transcriptional directionality. Trends in Biochemical Sciences. 2014;39:319–327. doi: 10.1016/j.tibs.2014.05.001. [DOI] [PMC free article] [PubMed] [Google Scholar]
- Hoffman MM, Buske OJ, Wang J, Weng Z, Bilmes JA, Noble WS. Unsupervised pattern discovery in human chromatin structure through genomic segmentation. Nature Methods. 2012;9:473–476. doi: 10.1038/nmeth.1937. [DOI] [PMC free article] [PubMed] [Google Scholar]
- Hsin JP, Manley JL. The RNA polymerase II CTD coordinates transcription and RNA processing. Genes & Development. 2012;26:2119–2137. doi: 10.1101/gad.200303.112. [DOI] [PMC free article] [PubMed] [Google Scholar]
- Ibrahim MM, Lacadie SA, Ohler U. JAMM: A Peak Finder for Joint Analysis of NGS Replicates. Bioinformatics (Oxford, England) 2014 doi: 10.1093/bioinformatics/btu568. [DOI] [PubMed] [Google Scholar]
- Kapranov P, Cheng J, Dike S, Nix Da, Duttagupta R, Willingham AT, Stadler PF, Hertel J, Hackermüller J, Hofacker IL, et al. RNA maps reveal new RNA classes and a possible function for pervasive transcription. Science (New York, NY) 2007;316:1484–1488. doi: 10.1126/science.1138341. [DOI] [PubMed] [Google Scholar]
- Katayama S, Tomaru Y, Kasukawa T, Waki K, Nakanishi M, Nakamura M, Nishida H, Yap CC, Suzuki M, Kawai J, et al. Antisense transcription in the mammalian transcriptome. Science (New York, NY) 2005;309:1564–1566. doi: 10.1126/science.1112009. [DOI] [PubMed] [Google Scholar]
- Kruesi WS, Core LJ, Waters CT, Lis JT, Meyer BJ. Condensin controls recruitment of RNA polymerase II to achieve nematode X-chromosome dosage compensation. eLife. 2013;2:e00808. doi: 10.7554/eLife.00808. [DOI] [PMC free article] [PubMed] [Google Scholar]
- Kuhn RM, Haussler D, Kent WJ. The UCSC genome browser and associated tools. Briefings in Bioinformatics. 2013;14:144–161. doi: 10.1093/bib/bbs038. [DOI] [PMC free article] [PubMed] [Google Scholar]
- Lam MTY, Cho H, Lesch HP, Gosselin D, Heinz S, Tanaka-Oishi Y, Benner C, Kaikkonen MU, Kim AS, Kosaka M, et al. Rev-Erbs repress macrophage gene expression by inhibiting enhancer-directed transcription. Nature. 2013;498:511–515. doi: 10.1038/nature12209. [DOI] [PMC free article] [PubMed] [Google Scholar]
- Langmead B, Salzberg SL. Fast gapped-read alignment with Bowtie 2. Nature Methods. 2012;9:357–359. doi: 10.1038/nmeth.1923. [DOI] [PMC free article] [PubMed] [Google Scholar]
- Lauberth SM, Nakayama T, Wu X, Ferris AL, Tang Z, Hughes SH, Roeder RG. H3K4me3 interactions with TAF3 regulate preinitiation complex assembly and selective gene activation. Cell. 2013;152:1021–1036. doi: 10.1016/j.cell.2013.01.052. [DOI] [PMC free article] [PubMed] [Google Scholar]
- Lawrence M, Huber W, Pagès H, Aboyoun P, Carlson M, Gentleman R, Morgan MT, Carey VJ. Software for computing and annotating genomic ranges. PLoS Computational Biology. 2013;9:e1003118. doi: 10.1371/journal.pcbi.1003118. [DOI] [PMC free article] [PubMed] [Google Scholar]
- Lenhard B, Sandelin A, Carninci P. Metazoan promoters: emerging characteristics and insights into transcriptional regulation. Nature ReviewsGenetics. 2012;13:233–245. doi: 10.1038/nrg3163. [DOI] [PubMed] [Google Scholar]
- Lepoivre C, Belhocine M, Bergon A, Griffon A, Yammine M, Vanhille L, Zacarias-Cabeza J, Garibal MA, Koch F, Maqbool MA, et al. Divergent transcription is associated with promoters of transcriptional regulators. BMC Genomics. 2013;14:914. doi: 10.1186/1471-2164-14-914. [DOI] [PMC free article] [PubMed] [Google Scholar]
- Martin M. Cutadapt removes adapter sequences from high-throughput sequencing reads. EMBnet Journal. 2011 http://journal.embnet.org/index.php/embnetjournal/article/view/200/479.
- Megraw M, Pereira F, Jensen ST, Ohler U, Hatzigeorgiou AG. A transcription factor affinity-based code for mammalian transcription initiation. Genome Research. 2009;19:644–656. doi: 10.1101/gr.085449.108. [DOI] [PMC free article] [PubMed] [Google Scholar]
- Narlikar L, Jothi R. ChIP-Seq data analysis: identification of protein-DNA binding sites with SISSRs peak-finder. Methods in Molecular Biology (Clifton, NJ) 2012;802:305–322. doi: 10.1007/978-1-61779-400-1_20. [DOI] [PMC free article] [PubMed] [Google Scholar]
- Natarajan A, Yardimci GG, Sheffield NC, Crawford GE, Ohler U. Predicting cell-type-specific gene expression from regions of open chromatin. Genome Research. 2012;22:1711–1722. doi: 10.1101/gr.135129.111. [DOI] [PMC free article] [PubMed] [Google Scholar]
- Neil H, Malabat C, d’Aubenton-Carafa Y, Xu Z, Steinmetz LM, Jacquier A. Widespread bidirectional promoters are the major source of cryptic transcripts in yeast. Nature. 2009;457:1038–1042. doi: 10.1038/nature07747. [DOI] [PubMed] [Google Scholar]
- Ni T, Corcoran DL, Rach Ea, Song S, Spana EP, Gao Y, Ohler U, Zhu J. A paired-end sequencing strategy to map the complex landscape of transcription initiation. Nature Methods. 2010;7:521–527. doi: 10.1038/nmeth.1464. [DOI] [PMC free article] [PubMed] [Google Scholar]
- Ntini E, Järvelin AI, Bornholdt J, Chen Y, Boyd M, Jørgensen M, Andersson R, Hoof I, Schein A, Andersen PR, et al. Polyadenylation site-induced decay of upstream transcripts enforces promoter directionality. Nature Structural & Molecular Biology. 2013;20:923–928. doi: 10.1038/nsmb.2640. [DOI] [PubMed] [Google Scholar]
- Preker P, Nielsen J, Kammler S, Lykke-Andersen S, Christensen MS, Mapendano CK, Schierup MH, Jensen TH. RNA exosome depletion reveals transcription upstream of active human promoters. Science (New York, NY) 2008;322:1851–1854. doi: 10.1126/science.1164096. [DOI] [PubMed] [Google Scholar]
- Quinlan AR, Hall IM. BEDTools: a flexible suite of utilities for comparing genomic features. Bioinformatics (Oxford, England) 2010;26:841–842. doi: 10.1093/bioinformatics/btq033. [DOI] [PMC free article] [PubMed] [Google Scholar]
- Rach Ea, Winter DR, Benjamin AM, Corcoran DL, Ni T, Zhu J, Ohler U. Transcription initiation patterns indicate divergent strategies for gene regulation at the chromatin level. PLoS Genetics. 2011;7:e1001274. doi: 10.1371/journal.pgen.1001274. [DOI] [PMC free article] [PubMed] [Google Scholar]
- Rhee HS, Pugh BF. Genome-wide structure and organization of eukaryotic preinitiation complexes. Nature. 2012;483:295–301. doi: 10.1038/nature10799. [DOI] [PMC free article] [PubMed] [Google Scholar]
- Schulz D, Schwalb B, Kiesel A, Baejen C, Torkler P, Gagneur J, Soeding J, Cramer P. Transcriptome surveillance by selective termination of noncoding RNA synthesis. Cell. 2013;155:1075–1087. doi: 10.1016/j.cell.2013.10.024. [DOI] [PubMed] [Google Scholar]
- Seila AC, Calabrese JM, Levine SS, Yeo GW, Rahl PB, Flynn Ra, Young Ra, Sharp Pa. Divergent transcription from active promoters. Science (New York, NY) 2008;322:1849–1851. doi: 10.1126/science.1162253. [DOI] [PMC free article] [PubMed] [Google Scholar]
- Seila AC, Core LJ, Lis JT, Sharp Pa. Divergent transcription: a new feature of active promoters. Cell Cycle (Georgetown, Tex) 2009;8:2557–2564. doi: 10.4161/cc.8.16.9305. [DOI] [PubMed] [Google Scholar]
- Sigova AA, Mullen AC, Molinie B, Gupta S, Orlando DA, Guenther MG, Almada AE, Lin C, Sharp PA, Giallourakis CC, et al. Divergent transcription of long noncoding RNA/mRNA gene pairs in embryonic stem cells. Proceedings of the National Academy of Sciences of the United States of America. 2013;110:2876–2881. doi: 10.1073/pnas.1221904110. [DOI] [PMC free article] [PubMed] [Google Scholar]
- Sing T, Sander O, Beerenwinkel N, Lengauer T. ROCR: visualizing classifier performance in R. Bioinformatics (Oxford, England) 2005;21:3940–3941. doi: 10.1093/bioinformatics/bti623. [DOI] [PubMed] [Google Scholar]
- Taramasco O, Bauer S. RHmm: Hidden Markov Models simulations and estimations. 2013 https://r-forge.r-project.org/R/?group_id=85.
- Thurman RE, Rynes E, Humbert R, Vierstra J, Maurano MT, Haugen E, Sheffield NC, Stergachis AB, Wang H, Vernot B, et al. The accessible chromatin landscape of the human genome. Nature. 2012;489:75–82. doi: 10.1038/nature11232. [DOI] [PMC free article] [PubMed] [Google Scholar]
- Viterbi A. Error bounds for convolutional codes and an asymptotically optimum decoding algorithm. IEEE Transactions on Information Theory. 1967;13:260–269. [Google Scholar]
- Wakano C, Byun JS, Di LJ, Gardner K. The dual lives of bidirectional promoters. Biochimica Et Biophysica Acta. 2012;1819:688–693. doi: 10.1016/j.bbagrm.2012.02.006. [DOI] [PMC free article] [PubMed] [Google Scholar]
- Wickham H. ggplot2: Elegant Graphics for Data Analysis. Springer Science & Business Media; 2009. [Google Scholar]
Associated Data
This section collects any data citations, data availability statements, or supplementary materials included in this article.
Supplementary Materials
Figure S1 | Transcription from a divergent core promoter, related to Figure 1. Human FGB as an example of a divergent core promoter. The polarity depends on the DNA sequence. Promoters were cloned from +50 to −125 (relative to the +1 transcription start site) to allow reverse initiation within the natural sequence. The reverse Inr (rInr) sequence “TCAGAA” was substituted with “TCGGTC” (rInr−) or a consensus Inr “TCAGTC”(rInr+).
Figure S2 | Sequence content of forward and reverse TSSs, related to Figure 2.
a, b, Position-specific threemer counts normalized to total threemer frequencies for forward (a) and reverse (b) direction core promoters −50 to +50 bp around the 5′-GRO-seq cluster modes. c, Percent of forward or reverse TSSs that show motif matches to either initiator (left) or TATA-box (right) in the −35 to −25 or −5 to +5 regions, respectively, from the 5′-GRO-seq cluster modes. Different colors represent different false positive rate (FPR) cutoffs.
Figure S3 | Performance and results of TSS sequence model, related to Figures 2 and 4. a, b, Receiver operator characteristic (a) and precision-recall (b) curves for the sequence model described in Frith et al, 2008, trained and tested with a 10-fold cross validation +/− 50 bp around the mode of the forward TSSs from the divergent promoter pairs described in Figure 2 (see Experimental Procedures). c, Average predicted TSS scores per position for sequences +/− 50 bp around the mode of the corresponding TSSs from the divergent promoter pairs described in Figure 2, or its shuffled control, from the model trained as in “a” and “b” (see Supplemental Experimental Procedures). d, Distributions of 5′GRO-seq cluster mode TSS prediction scores for forward and reverse TSSs.
Figure S4 | DHS peak call accuracy and characteristics, related to Figures 4 and 5. a, b, c, Heat maps of normalized DNaseI-seq read 5′end counts (blue) anchored on each DHS midpoint and ranked by increasing DHS width together with the location of JAMM-called peak edges (black) for divergent (a), unidirectional (b), and bidirectional (c) promoter DHSs. d, Scatter plot of DHS width versus distance between forward and reverse 5′-GRO-seq cluster modes of divergent promoters. e, Boxplots of distance between 5′-GRO-seq cluster modes and corresponding DHS edges, dot = mean.
Figure S5 | Unidirectional promoters lack upstream hallmarks of divergent transcription, related to Figures 4 and 5. a, b, Positional average fragment-extended ChIP-seq read counts within Taf1 (a) and Tbp (b) peak summits as called by SISSRS in bins of 10 nucleotides (see Supplemental Experimental Procedures). c, Positional average of normalized read 5′end counts of traditional GRO-seq for the forward (red and blue) or reverse (orange and light blue) directions of the divergent (red and orange) or unidirectional (blue and light blue) promoters (“normalized counts” refers to 0-to-1 scaling of read counts for every DHS window, see Supplemental Experimental Procedures). d, Distributions of whole HeLa cell, polyA-plus CAGE tag 5′end counts from ENCODE intersecting designated 5′GRO-seq clusters.
Figure S6 | Histone modifications HMM characteristics and analysis, related to Figure 6. a, Chromatin state – Genome Annotation enrichment map (see Supplemental Experimental Procedures). “Genes” are entire UCSC gene lengths, “TSS” are UCSC known gene transcription start sites, “TES” are UCSC known gene transcription end sites, “TSS 4kb” and “TES 4kb” are windows centered around UCSC TSSs and TESs respectively going 2kb upstream and downstream, “F5 Enhancers” are enhancers identified by the Fantom5 consortium for the hg19 genome build, “F5 Enhancers 2k” are windows centered around the midpoints of F5 Enhancers going 1kb downstream and 1kb upstream, “CGI” are UCSC “CpG” islands. b, Percentage of chromatin state intersections at 75 bp downstream of the NFR edges. “No State” refers to those locations that did not intersect any chromatin state. c, d, e, f Average fragment-extended read counts of H3K27ac (c), H3K4me3 (d), H3K4me2 (e), and H3K4me1(f) ChIP-seq in bins of 10 nucleotides for divergent (blue), unidirectional (red), bidirectional (green), and intergenic (light blue) 5′-GRO-seq-containing DHSs (see Experimental Procedures). grey = average DNaseI-seq read 5′end counts for DHSs from all four groups combined.
Table S1 | Comparison of 5′GRO-seq and exosome KD CAGE analyses, related to Figure 4. The same analyses were performed on both datasets using the same DHS peaks calls as described in the Supplemental Experimental Procedures. Margin numbers indicate the number of DHSs that were identified in each group from each dataset. Table numbers indicate the overlap between DHS classes between the two datasets. The most conservative estimate for percentage of unidirectional promoters is 34% (1196/3499) when only considering DHSs with forward gene evidence in both datasets, from which unidirectional DHSs are consistently classified in both datasets and divergent/bidirectional DHSs identified in at least one dataset. It is likely that many of the forward TSS-containing DHSs (unidirectional, divergent, or bidirectional) identified in only one of the two datasets are true; when these are included, we estimate that the true percentage of unidirectional promoters is closer to 44% (3394/7707).
Table S2 | Correlations between 5′GRO-seq and TSS prediction score or H3K27ac ChIP-seq, related to Figure 4.
Spearman Rho correlation values are shown with corresponding p values between 5′GRO-seq read 5′end counts within called clusters (top) and either the TSS prediction score (left top) or H3K27ac ChIP-seq fragment-extended read counts intersecting a window 148 bp downstream of the appropriate DHS peak edge (left bottom).
Table S3 | Final_Cluster Sets.xlsx, related to Figure 1.
5′GRO-seq cluster calls as identified using the strategy described in Ni et al. (Ni et al., 2010) and Supplemental Experimental Procedures.