Abstract
Background
Previous research has shown variations in quality of care and patient outcomes under different primary care models. The objective of this study was to use previously validated, evidence-based performance indicators to measure quality of asthma care over time and to compare quality of care between different primary care models.
Methods
Data were obtained for years 2006 to 2010 from the Ontario Asthma Surveillance Information System, which uses health administrative databases to track individuals with asthma living in the province of Ontario, Canada. Individuals with asthma (n=1,813,922) were divided into groups based on the practice model of their primary care provider (i.e., fee-for-service, blended fee-for-service, blended capitation). Quality of asthma care was measured using six validated, evidence-based asthma care performance indicators.
Results
All of the asthma performance indicators improved over time within each of the primary care models. Compared to the traditional fee-for-service model, the blended fee-for-service and blended capitation models had higher use of spirometry for asthma diagnosis and monitoring, higher rates of inhaled corticosteroid prescription, and lower outpatient claims. Emergency department visits were lowest in the blended fee-for-service group.
Conclusions
Quality of asthma care improved over time within each of the primary care models. However, the amount by which they improved differed between the models. The newer primary care models (i.e., blended fee-for-service, blended capitation) appear to provide better quality of asthma care compared to the traditional fee-for-service model.
Electronic supplementary material
The online version of this article (doi:10.1186/s12875-015-0232-y) contains supplementary material, which is available to authorized users.
Keywords: Asthma, Quality of care, Performance measures, Health indicators, Health services use
Background
Common worldwide challenges to the delivery of primary care have included limited time spent with patients, minimal funding and physician shortages. Primary care systems have attempted to alleviate the burden of some of these issues, and as a result different primary models have been implemented around the world, leading to an increased number of group-based practices and changes to remuneration. Recent primary care changes in Ontario, Canada have moved away from the traditional fee-for-service model, towards models that emphasize patient enrolment and provision of packaged services, such as blended fee-for-service, blended capitation and salaried models. These models are thought to provide a more comprehensive approach to patient care. Since this transition, much research has focused on structural aspects of the new models, such as patient enrolment or number of services provided. More recently, there has been an interest in the quality of care provided by these models. Russell et al. examined performance indicators specific to diabetes, congestive heart failure and coronary artery disease and found that physicians under salaried models provided superior quality of care to patients with those conditions [1]. Liddy et al. also found quality of diabetes treatment to be better in salaried models, whereas quality of preventative measures, such as smoking cessation, was better among blended capitation models [2].
Recently in Ontario, there has been a focus on improving the quality of asthma care. For example, the Primary Care Asthma Program has been implemented in over one-hundred primary care locations with the aim of providing tools to guide practitioners and patients in more effectively managing asthma [3-5]. However, despite these recent endeavours to improve the future quality of asthma care, little is known about the current quality of asthma care in Ontario, particularly among different primary care models. As Ontario is still in the process of a primary care change, a better understanding of quality of care among primary care models for particular conditions typically cared for at the primary care level, such as asthma, are of interest. The objective of this study was to use previously validated, evidence-based performance indicators to measure quality of asthma care over time and to compare quality of care between different primary care models.
Methods
Study population
The Ontario Asthma Surveillance Information System (http://www.sickkids.ca/Research/OASIS) is a population-based, longitudinal surveillance system that identifies and tracks individuals living with asthma in Ontario, Canada using four health administrative databases housed at the Institute for Clinical Evaluative Sciences (details in Additional file 1). Linkage of datasets using an encrypted version of the unique health insurance number given to all Ontario residents allows for examination of individuals’ complete health services use across health care domains. Health services claims identified from the databases from fiscal year 2006 (April 1, 2006 - March 31, 2007) to fiscal year 2010 (April 1, 2010 - March 31, 2011) were included. A previously validated case definition of asthma was used to identify individuals with asthma, and included those who have had at least two primary care visit claims for asthma in two consecutive years and/or at least one hospitalization for asthma [6,7]. This definition has been shown to have 89% sensitivity and 72% specificity in children (under 18 years old) and 83.8% sensitivity and 76.5% specificity in adults [6,7].
Outcome measures – asthma performance indicators
Quality of primary care was measured using six validated, evidence-based asthma performance indicators from the linked databases described above [8]. Outcome measures included four process-related indicators: spirometry for diagnosis, spirometry for monitoring, reliever and controller medication prescription; and two outcome-related indicators: primary care visits and emergency department visits for asthma.
Spirometry for diagnosis was calculated as the percent of cases in which testing was performed in those ≥7years of age within 3.5 years of the presumed asthma diagnosis date (1 year prior and 2.5 years post asthma diagnosis) [9]. Spirometry for monitoring was calculated as the percent of cases in which testing was performed in those ≥7 years of age in the past 12 months. It has been suggested that pulmonary function measures should be followed over the patient’s lifetime to detect a decline of lung function and to track the rate of decline longitudinally.
Medication reliever and controller prescription indicators were calculated as the percent of individuals with asthma who were prescribed, respectively, short-acting β2-agonists (SABA) and inhaled corticosteroids (ICS) in the previous 12 months. It should be noted that while ICS remains the first-line controller therapy for all ages as recommended in most asthma management guidelines, physicians may adjust the ICS dose or discontinue ICS depending on levels of asthma control. Canadian Guidelines suggests that very mild, intermittent asthma may be treated with SABA as needed [10]. Medication data was only available for persons >65 years of age (12.1% of the asthma population in this study) and others eligible for the Ontario Drug Benefits Program, which includes those living in long-term care homes, those enrolled in home care programs, those with high drug costs relative to their income, and those receiving social assistance. Thus, findings of medication use should be interpreted with caution.
While many physicians diagnose individuals as having asthma based on the symptoms they present, such as wheezing, shortness of breath or cough, asthma guidelines recommend that asthma be diagnosed using spirometry. Once diagnosed, asthma is to be controlled with daily (versus intermittent) ICS use, thus we considered higher rates of spirometry and ICU prescription to reflect higher quality of care [11]. In contrast, lower SABA prescription rates were generally considered to reflect better asthma control and consequently higher quality of care. The number of canisters filled was calculated by total amount paid divided by unit cost of the respective medication. Less than or equal to 4 canisters per patient per year was thought to reflect better asthma control and ≥13 canisters per patient per year was thought to reflect poorer asthma control [12,13]. It should be noted that low use of SABA may also reflect suboptimal medical care or patient adherence in some cases, thus SABA findings should be interpreted with caution.
Primary care visits for asthma and emergency department visits for asthma were calculated per 100 patients with asthma in the past 12 months.
International Classification of Diseases (ICD) codes were used in the creation of the study population and to identify asthma health services use; specifically, ICD-9 (493) and ICD-10 (J45, J46) codes were used.
Predictor variables – primary care practice models
The Ontario Ministry of Health and Long-Term Care (MOHLTC) has set criteria for each type of primary care practice model used by family medicine physicians in the delivery of care [2]. Physicians are remunerated either by fee-for-service or by one of the patient enrolment models: blended fee-for-service, blended capitation, or salary. Fee-for-service billing involves payment for every item or unit of care that physicians provide for their patients; physicians remunerated by fee-for-service may practice independently (solo) or be affiliated with a group (non-solo). The blended fee-for-service model remunerates physicians primarily through fee-for-service, but also includes incentives and bonuses for services to enrolled patients. The blended capitation model remunerates physicians based on number of enrolled patients, and on providing a basket of services to enrolled patients based on age and sex. Each additional service would be paid for by fee-for-service. Physicians working under the salaried model are remunerated based on the number of physicians within a group that provide services to a specific community. The definitions of practice models used came from the MOHLTC, and have been used previously by others [14]. Specific details can be found on the Health Force Ontario website: www.healthforceontario.ca/en/Home/Physicians/Training_|_Practising_in_Ontario/Physician_Roles/Family_Practice_Models/Family_Practice_Compensation_Models. These categories are mutually exclusive; physicians can only be listed in one model at any given time. All models were in effect for the entirety of the study period.
Physician demographic data came from the Institute for Clinical Evaluative Sciences (ICES) Physician Database. Fee-for-service practitioners were identified using Ontario Health Insurance Plan data and the ICES Physician Database, whereas physicians in the blended fee-for-service and blended capitation models were identified using Client Agency Program Enrolment data tables. Less than 1% of the study population failed to be linked to a practice model. Lack of access to community health centre data (one group within the salaried model) prevented the inclusion of the 73 community health centres in Ontario, which serviced approximately 4% of the population. Due to small sample sizes and a unique, potentially biasing geographic location, the Rural Northern Physician Group (the other group within the salaried model) was not included in this study. As community health centres and Rural Northern Physicians Groups are the only groups in Ontario under the salaried physician model, this study does not include data on the salaried model.
Covariates and potential confounders
Potential confounding factors were adjusted for in a multivariable analysis [15]. Patient factors included sex, age group, socioeconomic status (inferred from neighbourhood income, as derived from postal codes and census data) and rurality (determined using postal code and based on living in a municipality with fewer than 10,000 people). Since some patients with asthma may also have chronic obstructive pulmonary disease (COPD) that may influence disease management [16], co-diagnosis of COPD was included as a covariate in the multivariable analysis. Individuals were defined as having COPD if they were ≥35 years of age and had at least one COPD hospitalization and/or one COPD ambulatory care claim (85% sensitivity & 78% specificity) [17]. Physician factors included sex, age, years practicing medicine and whether or not training occurred in Canada. Volume of registered asthma patients was also considered.
Statistical analysis
A retrospective population-based cross-sectional study design was used. Six asthma indicator trends over time were described overall and stratified by primary care practice models. The equivalence test [18] was used to evaluate differences between groups for each of the patient and physician characteristics. All variables listed in Table 1 were included in the multivariable regression analysis. Two-level Poisson regression models with GEE (Generalized Estimating Equations) were used to account for clustering of patients within primary care models as well as individuals’ variation across study years. We modeled the effects of primary care models while adjusting for over-dispersion (details in Additional file 2), and physician and patient characteristics on each of the asthma performance indicators. Poisson regression risk ratios were presented with 95% confidence intervals. For comparisons, fee-for-service physicians were used as the reference group because they reflected the original model of health care remuneration used in Ontario. Analyses were performed using SAS version 9.2 [19].
Table 1.
Characteristics of patient population and physician by practice models
| Overall | Fee-for-service | Blended fee-for-service | Blended capitation | |||||
|---|---|---|---|---|---|---|---|---|
| Number | % | Number | % | Number | % | Number | % | |
| 2006 | ||||||||
| Patient characteristics | ||||||||
| Number of asthma patients | 1675282 | 292222 | 17.4 | 1089808 | 65.1 | 293252 | 17.5 | |
| Female | 890927 | 53.2 | 143906 | 49.2 | 585260 | 53.7 | 161761 | 55.2 |
| Age groups (years) | ||||||||
| 0-4 | 96542 | 5.8 | 33587 | 11.5 | 50034 | 4.6 | 12921 | 4.4 |
| 5-14 | 368576 | 22.0 | 76955 | 26.3 | 232332 | 21.3 | 59289 | 20.2 |
| 15-64 | 1016084 | 60.7 | 151812 | 52.0 | 680563 | 62.4 | 183709 | 62.6 |
| 65+ | 194080 | 11.6 | 29868 | 10.2 | 126879 | 11.6 | 37333 | 12.7 |
| Means ± SD | 32.8 ± 22.8 | 28.9 ± 23.3 | 33.5 ± 22.6 | 34.2 ± 22.9 | ||||
| SES by income quintiles | ||||||||
| Quintile 1 - Low | 336646 | 20.1 | 67381 | 23.1 | 213563 | 19.6 | 55702 | 19.0 |
| Quintile 2 | 335756 | 20.0 | 59583 | 20.4 | 217530 | 20.0 | 58643 | 20.0 |
| Quintile 3 | 335221 | 20.0 | 55365 | 18.9 | 222161 | 20.4 | 57695 | 19.7 |
| Quintile 4 | 336365 | 20.1 | 54480 | 18.6 | 220976 | 20.3 | 60909 | 20.8 |
| Quintile 5 - High | 325477 | 19.4 | 54038 | 18.5 | 212220 | 19.5 | 59219 | 20.2 |
| Missing | 5817 | 0.3 | 1375 | 0.5 | 3358 | 0.3 | 1084 | 0.4 |
| Rural residence | 174688 | 10.4 | 24219 | 8.3 | 90771 | 8.3 | 59698 | 20.4 |
| Physician characteristics | ||||||||
| Number of physicians | 11700 | 5526 | 47.2 | 4603 | 39.3 | 1571 | 13.4 | |
| Female | 4105 | 35.1 | 1816 | 32.9 | 1710 | 37.1 | 579 | 36.9 |
| Mean age ± SD | 49.6 ± 12.4 | 50.8 ± 14.4 | 48.9 ± 10.4 | 47.8 ± 9.9 | ||||
| Mean years in practice ± SD | 23.7 ± 11.9 | 24.7 ± 13.2 | 23.3 ± 10.7 | 21.9 ± 10.3 | ||||
| Trained in Canada | 8154 | 69.7 | 3444 | 62.3 | 3371 | 73.2 | 1339 | 85.2 |
| Number of asthma patients on roster | ||||||||
| ≤200 | 2570 | 22.0 | 1792 | 32.4 | 570 | 12.4 | 208 | 13.2 |
| 201-375 | 2983 | 25.5 | 1114 | 20.2 | 1352 | 29.4 | 517 | 32.9 |
| ≥376 | 6147 | 52.5 | 2620 | 47.4 | 2681 | 58.2 | 846 | 53.9 |
| 2010 | ||||||||
| Patient characteristics | ||||||||
| Number of asthma patients | 1813922 | 190656 | 10.5 | 844836 | 46.6 | 778430 | 42.9 | |
| Female | 961173 | 53.0 | 90427 | 47.4 | 443166 | 52.5 | 427580 | 54.9 |
| Age groups (years) | ||||||||
| 0-4 | 77534 | 4.3 | 20852 | 10.9 | 33098 | 3.9 | 23584 | 3.0 |
| 5-14 | 322417 | 17.8 | 48422 | 25.4 | 152475 | 18.0 | 121520 | 15.6 |
| 15-64 | 1193641 | 65.8 | 102771 | 53.9 | 559602 | 66.2 | 531268 | 68.2 |
| 65+ | 220330 | 12.1 | 18611 | 9.8 | 99661 | 11.8 | 102058 | 13.1 |
| Means ± SD | 34.5 ± 22.5 | 28.6 ± 23.1 | 34.5 ± 22.3 | 35.9 ± 22.4 | ||||
| SES by income quintiles | ||||||||
| Quintile 1 - low | 347895 | 19.2 | 41894 | 22.0 | 169429 | 20.1 | 136572 | 17.5 |
| Quintile 2 | 356347 | 19.6 | 37922 | 19.9 | 171875 | 20.3 | 146550 | 18.8 |
| Quintile 3 | 365799 | 20.2 | 36844 | 19.3 | 176756 | 20.9 | 152199 | 19.6 |
| Quintile 4 | 380224 | 21.0 | 37315 | 19.6 | 175459 | 20.8 | 167450 | 21.5 |
| Quintile 5 - high | 357418 | 19.7 | 35785 | 18.8 | 148943 | 17.6 | 172690 | 22.2 |
| Missing | 6239 | 0.3 | 896 | 0.5 | 2374 | 0.3 | 2969 | 0.4 |
| Rural residence | 181703 | 10.0 | 12740 | 6.7 | 41459 | 4.9 | 127504 | 16.4 |
| Physician characteristics | ||||||||
| Number of Physicians | 12418 | 5112 | 41.2 | 3487 | 28.1 | 3819 | 30.8 | |
| Female | 4854 | 39.1 | 1886 | 36.9 | 1377 | 39.5 | 1591 | 41.7 |
| Mean age ± SD | 50.6 ± 12.5 | 51.2 ± 14.4 | 51.3 ± 11.3 | 49.2 ± 10.6 | ||||
| Mean years in practice ± SD | 24.7 ± 12.4 | 25.1 ± 13.7 | 25.6 ± 11.6 | 23.2 ± 11.2 | ||||
| Trained in Canada | 8679 | 69.9 | 3305 | 64.7 | 2187 | 62.7 | 3187 | 83.5 |
| Number of asthma patients on roster | ||||||||
| ≤200 | 2695 | 21.7 | 1516 | 29.7 | 576 | 16.5 | 603 | 15.8 |
| 201-375 | 3451 | 27.8 | 1043 | 20.4 | 963 | 27.6 | 1445 | 37.8 |
| ≥376 | 6272 | 50.5 | 2553 | 49.9 | 1948 | 55.9 | 1771 | 46.4 |
Ethics statement
The study was approved by the institutional review boards at The Hospital for Sick Children, Toronto, Ontario. For the purposes of this research informed consent was not required. The Institute for Clinical Evaluative Sciences (ICES) is named as a prescribed entity in Section 45 of the Personal Health Information Protection Act (PHIPA – Regulation 329/04, Section 18). Under this designation, ICES can receive and use health information without consent for purposes of analysis and compiling statistical information about the Ontario health care system.
Results
Study population
Patient and physician characteristics for 2006 and 2010 are shown in Table 1. The majority of patients with asthma were managed by blended fee-for-service physicians. Patient characteristics appear to differ across practice models for sex, age, and rural residence. The fee-for-service model had a smaller percentage of female patients and a larger percentage of younger patients. Detailed data by narrower age groups are provided in Additional file 3. The blended capitation model consisted of more patients living in rural areas. With regard to physician characteristics, the blended capitation model contained more physicians who were trained in Canada. The blended fee-for-service and blended capitation models were more likely to have higher number of asthma patients on their roster than fee-for-service physicians. The proportions of female physicians did not differ across practice models.
Overall trends of asthma care measured by asthma performance indicators
As seen in Table 2, between 2006 and 2010 there was an overall and gradual increase in the use of spirometry for diagnosis and monitoring of patients with asthma. However, despite this increase in use, in 2010 only half (52.5%) of all asthma diagnoses were confirmed by spirometry, and only 19.1% of asthma patients were monitored annually with spirometry. Overall prescriptions for ICS increased and prescriptions for SABA remained relatively stable over the study period. The percentage of patients being prescribed ≤4 SABA canisters per year increased over time, whereas the percentage of patients being prescribed 13 to 20 and >20 canisters per year decreased over time. Asthma primary care and emergency department visits decreased over time. Primary care and emergency department visits also decreased over time for non-asthma related issues, but not to the same extent as the decline in asthma-specific visits.
Table 2.
Overall percent distributions of asthma indicators, 2006 to 2010
| 2006 | 2007 | 2008 | 2009 | 2010 | 2006 to 2010 | ||||||||
|---|---|---|---|---|---|---|---|---|---|---|---|---|---|
| Asthma indicators | % | 95% CI | % | 95% CI | % | 95% CI | % | 95% CI | % | 95% CI | % change | 95% CI | p-value for trend |
| Process-related indicators | |||||||||||||
| Use of spirometry | |||||||||||||
| To diagnose asthma | 46.8 | (46.2, 47.5) | 48.8 | (48.1, 49.5) | 49.9 | (49.2, 50.7) | 51.0 | (50.3, 51.8) | 52.5 | (51.6, 53.5) | 12.2 | (10.3, 14.0) | <0.001 |
| To monitor asthma | 16.4 | (16.2, 16.5) | 17.0 | (16.9, 17.2) | 17.2 | (17.1, 17.4) | 17.7 | (17.6, 17.9) | 19.1 | (18.9, 19.2) | 16.5 | (15.2, 17.8) | <0.001 |
| Asthma medication prescriptions (in patients ≥65 years old) | |||||||||||||
| Inhaled corticosteroids | 72.9 | (72.1, 73.7) | 74.2 | (73.3, 75.0) | 74.7 | (73.8, 75.5) | 75.2 | (74.4, 76.1) | 76.6 | (75.8, 77.5) | 5.1 | (4.3, 6.0) | <0.001 |
| Short acting β2-agonist | 60.5 | (59.7, 61.2) | 60.7 | (59.9, 61.4) | 58.2 | (57.4, 58.9) | 57.8 | (57.0, 58.5) | 58.5 | (57.8, 59.3) | −3.3 | (−4.3, −2.1) | <0.001 |
| ≤4 canisters per year | 56.6 | (55.7, 57.6) | 57.7 | (56.7, 58.6) | 60.5 | (59.5, 61.5) | 61.2 | (60.2, 62.3) | 61.6 | (60.6, 62.7) | 8.8 | (7.3, 10.5) | <.0001 |
| 5-12 canisters per year | 30.3 | (29.6, 31.0) | 30.4 | (29.7, 31.1) | 29.3 | (28.6, 30.0) | 29.0 | (28.3, 29.7) | 29.4 | (28.7, 30.1) | −3.0 | (−5.5, −0.2) | 0.0008 |
| 13-20 canisters per year | 8.7 | (8.3, 9.1) | 8.2 | (7.9, 8.6) | 7.3 | (7.0, 7.7) | 7.1 | (6.8, 7.5) | 6.5 | (6.2, 6.9) | −25.3 | (−29.4, −20.0) | <.0001 |
| >20 canisters per year | 4.4 | (4.1, 4.6) | 3.7 | (3.5, 4.0) | 2.9 | (2.7, 3.1) | 2.7 | (2.5, 2.9) | 2.4 | (2.2, 2.6) | −45.5 | (−50.5, −39.5) | <.0001 |
| Outcome-related indicators | |||||||||||||
| Asthma specific health services use | |||||||||||||
| Primary care visits | 20.8 | (20.8, 20.9) | 20.0 | (19.9, 20.1) | 18.4 | (18.3, 18.5) | 17.5 | (17.4, 17.5) | 17.1 | (17.0, 17.1) | −17.8 | (−18.4, −17.7) | <0.001 |
| Emergency department visits | 2.4 | (2.4, 2.4) | 2.2 | (2.2, 2.2) | 1.9 | (1.9, 1.9) | 1.8 | (1.8, 1.8) | 1.7 | (1.7, 1.7) | −29.2 | (−30.0, −27.9) | <0.001 |
| Other health services use | |||||||||||||
| Primary care visits | 86.2 | (86.1, 86.4) | 84.9 | (84.8, 85.0) | 83.4 | (83.3, 83.6) | 83.8 | (83.7, 83.9) | 83.1 | (83.0, 83.2) | −3.6 | (−3.9, 3.4) | <0.0001 |
| Emergency department visits | 26.1 | (26.0, 26.1) | 25.9 | (25.9, 26.0) | 25.8 | (25.7, 25.8) | 25.7 | (25.6, 25.8) | 25.9 | (25.8, 26.0) | −0.8 | (−1.1, 0.0) | <0.0001 |
Note: p-value is based on the Cochran-Armitage test for trend for multiple proportions.
Crude comparisons of asthma performance indicators by primary care practice models
Evaluation of asthma performance indicators demonstrated marked differences over time and among primary care models (Figures 1, 2, 3, 4, 5 and 6). Use of spirometry for asthma diagnosis and monitoring increased over time in all groups; however the increase in the fee-for-service group was the smallest over time for both diagnosis and monitoring (Figures 1 and 2). Use of spirometry for both diagnosis and monitoring was highest over time in the blended capitation group and lowest over time in the fee-for-service group. ICS prescription appears to have increased in the blended-fee-for-service group, while remaining about the same in the other two groups over time; ICS prescription is consistently lower in the fee-for-service group (Figure 3). SABA prescriptions decreased slightly over time in each of the groups (Figure 4a). Prescription of ≤4 SABA canisters per year increased in all groups over time (Figure 4b). Prescription of ≥13 SABA canisters per year decreased in all groups over time (Figure 4c). Primary care and emergency department visits for asthma decreased over time among each of the groups (Figures 5 and 6). Primary care visits were highest in all years for patients in the fee-for-service group, and lowest in the blended capitation group (Figure 5). Emergency department visits were lowest in all years in the blended fee-for-service group (Figure 6).
Figure 1.
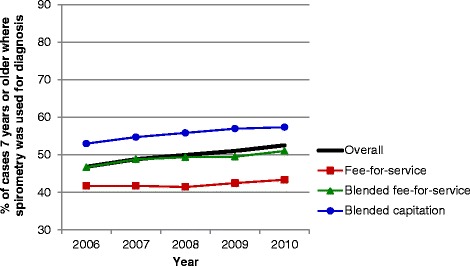
Spirometry used to establish diagnosis of asthma. Note: Spirometry was performed on those ≥7 years of age within 3.5 years of the diagnosis date.
Figure 2.
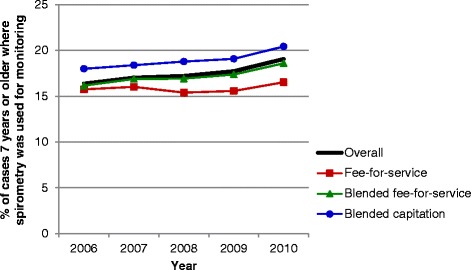
Spirometry used to monitor asthma. Note: Spirometry testing was performed on those ≥7 years of age in the past 12 months.
Figure 3.
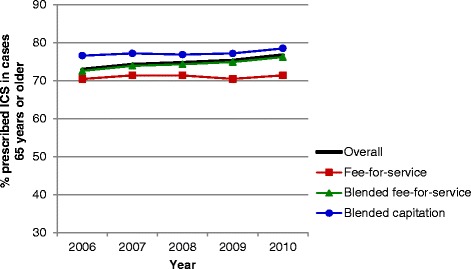
Inhaled corticosteroid use in the past 12 months for asthma patients >65 years of age. Note: ICS = inhaled corticosteroids.
Figure 4.
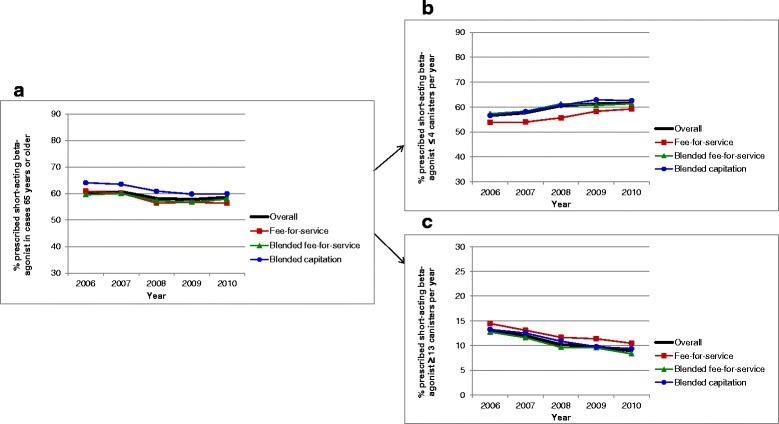
Short-acting β2-agonist use. a. Short-acting β2-agonist use in the past 12 months for asthma patients >65 years of age. b. Short-acting β2-agonist use ≤4 canisters in the past 12 months for asthma patients >65 years of age. c. Short-acting β2-agonist use ≥13 canisters in the past 12 months for asthma patients >65 years of age
Figure 5.
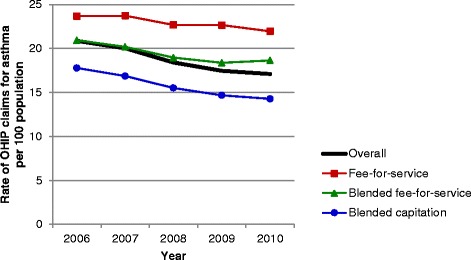
The rate of primary care visit claims for asthma in the past 12 months. Note: OHIP = Ontario Health Insurance Plan.
Figure 6.
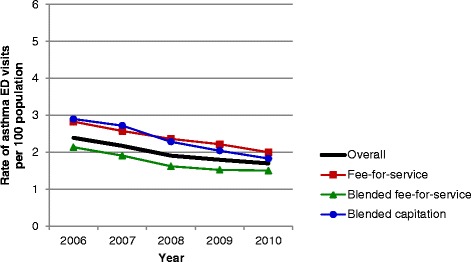
The rate of emergency department visits for asthma in the past 12 months. Note: ED = emergency department.
Asthma performance adjusted for potential confounders
As seen in Figure 7, compared to the fee-for-service model, the blended fee-for-service model had higher rates of spirometry use for diagnosis (adjusted risk ratio [RR] = 1.14), spirometry use for monitoring (RR = 1.07), ICS prescriptions (RR = 1.05), and lower rates of SABA prescription (RR = 0.97). In terms of outcome indicators, it had lower rates of emergency department visits (RR = 0.92) and slightly lower rates of outpatient claims (RR = 0.97).
Figure 7.
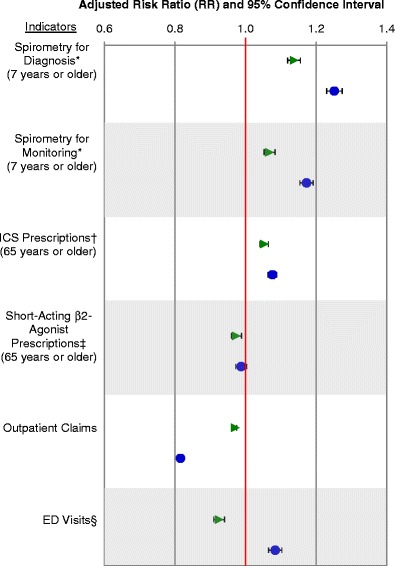
Adjusted risk ratios of asthma performance indicators comparing primary care practices using fee-for-service practices as a reference. Note: API=asthma performance indicator. *Performed on those ≥7 years of age, †ICS = inhaled corticosteroids (data only available for persons ≥65 years of age and others eligible for the Ontario Drug Benefits Program), ‡Short-acting β2-agonist data only available for persons ≥65 years of age and others eligible for the Ontario Drug Benefits Program, §ED = emergency department. Green triangle = blended fee-for-service practices. Blue circles = blended capitation practices.
Compared to fee-for-service models, the blended capitation model also had higher rates of spirometry use for diagnosis (RR = 1.25), spirometry for monitoring (RR = 1.17), and ICS prescriptions (RR = 1.08). Their rate of SABA prescription did not differ from the fee-for-service model. In terms of outcome indicators, their rate of outpatient claims (RR = 0.82) are much lower than both the fee-for-service and blended fee-for-service models, but their patients’ rates of emergency department visits (RR = 1.08) were higher than both the fee-for-service and blended fee-for-service models.
Discussion
Overall, quality of asthma care, as represented by performance indicators, has improved over time. In general, patient enrolment models (i.e., blended fee-for-service and blended capitation models) appear to provide higher quality of asthma care compared to traditional fee-for-service models based on the analysis of asthma performance indicators. The blended-fee-for service group stood out from both the fee-for-service and blended capitation in terms of outcome indicators, namely by having a lower rate of emergency department visits.
While the blended capitation model had higher rates of use of spirometry for diagnosis and monitoring, and higher rates of ICS prescriptions, they had lower rates of outpatient visits and higher rates of emergency department visits. These findings may be related to the fact that the blended capitation model had more patients living in rural areas. However, these results stood out even after adjusting for patient characteristics. Thus, we can suggest other factors that may have played a role, such as co-morbidities, poor compliance to medication, limited access to primary care because of geographic location or office hours, poor availability of after-hours medical assistance, patient education, or limitations of the process indicators to measure all variables involved with quality of care.
Recent studies in Ontario have also shown quality of care to be affected by primary care delivery models. Glazier et al. also observed that patients followed by physicians paid by the blended capitation model had higher than expected emergency department visits than fee-for-service physicians, whereas the patients in the salaried model were sicker but had substantially lower emergency department visit rates than expected [20]. The study by Glazier et al. showed that different primary care models served different patient populations, with non-salaried health centre physicians caring for more advantaged populations, and salaried physicians caring for more disadvantaged populations. These data suggest that pay structure may not be the only reason for differences in quality of care – individual patient characteristics not measured with administrative data, specific geographical location and practice infrastructure may partially explain the observed differences. Further, the use of performance indicators may be influenced by financial incentives within the different models.
These findings are relevant on an international level, where there is a trend towards payment tied to performance and bundled primary care systems. In the United Kingdom, primary care has moved towards group-based practices with pay-for-performance compensation, in which performance is measured using a number of quality indicators [21]. In the United States, where compensation is predominantly fee-for-service, policy recommendations have suggested a shift towards more bundled payment systems, in which payment is also tied to performance [22].
Despite an overall increase in quality of asthma care over time, there remains much room for improvement. National guidelines recommend that all asthma cases should be diagnosed using spirometry (in individuals old enough to reliably perform spirometry); however, our findings show that only half of patients with asthma had their asthma diagnosed using spirometry. Furthermore, guidelines describe the necessity of regular monitoring of asthma using spirometry, yet less than one-fifth of patients in our study underwent spirometry in the past year.
A few limitations of this study should be noted. The health administrative data definition of asthma may be subject to potential misclassification when compared to clinical evaluation by a physician, compounded by the fact that physicians do not always accurately diagnose asthma. When physicians submit claims, they enter an asthma diagnostic code. This is often based on patient symptoms, such as wheeze and cough, and can be subject to error. Further, as a large number of individuals were older than 65 years of age, it is possible that they had COPD in addition to asthma, or that the symptoms they were presenting with were those of COPD, thus there is the potential for misclassification or type 2 error. While some studies have shown asthma to be overdiagnosed by physicians, others have shown it to be underdiagnosed; it is therefore not clear how such possible misdiagnosis influenced our results [23-25]. Other research comparing asthma health administrative and survey data and found that, while there were differences in absolute values, health administrative data were consistent over time and therefore reliable for studying trends [26].
As suggested by Devlin and Sarma [27], physicians may self-select into different primary care models based on personal preferences and unobserved characteristics leading to potential selection bias. We included physician characteristics in our regression analysis to help reduce, though not eliminate, selection bias. In future, formal approaches such as propensity score matching used by Kantarevic et al. [28] or the difference-in-difference matching strategy employed by Kantarevic et al. [29] and Li et al. [30] should be considered to control for potential selection bias through the inclusion of physician individual fixed effects.
We were unable to include indicators for the entire population for analysis (e.g., prescription drug data was only available for individuals 65 years or older). In addition, data were available on dispensing practices but not on whether participants adhered to taking the medication. Further, use of portable peak expiratory flow meters as an objective measure of lung function to diagnose and monitor asthma was not captured by administrative billing data.
While this is not a randomized control trial, and we cannot guarantee that patient and physician groups were similar, we did adjust for many patient and physician characteristics in our analyses. Further to the discussion of differences between models, it cannot be determined with certainty whether or not more frequent use of indicators resulted in better patient outcomes.
Conclusions
Quality of asthma care has improved over time. Patient enrolment models appear to provide higher quality of asthma care processes compared to traditional fee-for-service model. Future improvements in quality of asthma care should focus on increasing the use of spirometry for asthma diagnosis and monitoring. Future research should continue to use administrative data to track asthma indicators on a population level to provide a foundation for continuous quality improvement in the provision of asthma care, as well as examine the direct relationship between use of asthma indicators and patient outcomes.
Acknowledgements
The project was funded by the Canadian Institutes of Health Research, Government of Ontario, and the Public Health Agency of Canada. The opinions, results and conclusions reported in this paper are those of the authors and do not necessarily represent those of the Canadian Institutes of Health Research, the Public Health Agency of Canada, the Government of Ontario or the Ministry of Health and Long-Term Care. Data were provided by the Institute for Clinical Evaluative Sciences. No endorsement by the Institute for Clinical Evaluative Sciences is intended or should be inferred. Dr. Gershon is supported by the Physicians' Services Incorporated Foundation Graham Farquharson Knowledge Translation Fellowship.
Abbreviations
- COPD
Chronic obstructive pulmonary disease
- GEE
Generalized estimating equations
- ICD
International Classification of Diseases
- ICES
Institute for Clinical Evaluative Sciences
- ICS
Inhaled corticosteroids
- MOHLTC
The Ontario Ministry of Health and Long-Term Care
- SABA
Short-acting β2-agonists
- RR
Adjusted risk ratio
Additional files
Ontario Asthma Surveillance Information System Administrative Databases.
Method Details.
Detailed age distribution of patient population by practice models.
Footnotes
Competing interests
The authors declare that they have no competing interests.
Authors’ contributions
TT, MDL, AK, IT, MBS and AG were involved in the study concept and design. TT contributed to acquisition of data, and drafted the manuscript. TT, JG and JZ participated in the analysis and interpretation of data. All authors: TT, MDL, AK, IT, MBS, JG, JZ, JS, LF and AG revised the manuscript critically for important intellectual content and approved the final version submitted for publication.
Contributor Information
Teresa To, Email: teresa.to@sickkids.ca.
Jun Guan, Email: jun.guan@ices.on.ca.
Jingqin Zhu, Email: jingqin.zhu@sickkids.ca.
M Diane Lougheed, Email: lougheed@KGH.KARI.NET.
Alan Kaplan, Email: for4kids@gmail.com.
Itamar Tamari, Email: itamar.tamari@stonegatechc.org.
Matthew B Stanbrook, Email: matthew.stanbrook@uhn.ca.
Jacqueline Simatovic, Email: jacqueline.simatovic@sickkids.ca.
Laura Feldman, Email: l.feldman@mail.utoronto.ca.
Andrea S Gershon, Email: Andrea.gershon@ices.on.ca.
References
- 1.Russell GM, Dahrouge S, Hogg W, Geneau R, Muldoon L, Tuna M. Managing chronic disease in ontario primary care: the impact of organizational factors. Ann Fam Med. 2009;7(4):309–318. doi: 10.1370/afm.982. [DOI] [PMC free article] [PubMed] [Google Scholar]
- 2.Family Practice Compensation Models. [http://www.healthforceontario.ca/en/Home/Physicians/Training_%7C_Practising_in_Ontario/Physician_Roles/Family_Practice_Models/Family_Practice_Compensation_Models]
- 3.To T, Cicutto L, Degani N, McLimont S, Beyene J. Can a community evidence-based asthma care program improve clinical outcomes? A longitudinal study. Med Care. 2008;46(12):1257–1266. doi: 10.1097/MLR.0b013e31817d6990. [DOI] [PubMed] [Google Scholar]
- 4.To T, McLimont S, Wang C, Cicutto L. How much do health care providers value a community-based asthma care program? – a survey to collect their opinions on the utilities of and barriers to its uptake. BMC Health Serv Res. 2009;9(77):8. doi: 10.1186/1472-6963-9-77. [DOI] [PMC free article] [PubMed] [Google Scholar]
- 5.To T, Daly C, Feldman R, McLimont S. Results from a community-based program evaluating the effect of changing smoking status on asthma symptom control. BMC Public Health. 2012;12:293. doi: 10.1186/1471-2458-12-293. [DOI] [PMC free article] [PubMed] [Google Scholar]
- 6.To T, Dell S, Dick PT, Cicutto L, Harris JK, MacLusky IB, et al. Case verification of children with asthma in Ontario. Pediatr Allergy Immunol. 2006;17(1):69–76. doi: 10.1111/j.1399-3038.2005.00346.x. [DOI] [PubMed] [Google Scholar]
- 7.Gershon AS, Wang C, Guan J, Vasilevska-Ristovska J, Cicutto L, To T. Identifying patients with physician diagnosed asthma in health administrative databases. Can Respir J. 2009;16(6):183–188. doi: 10.1155/2009/963098. [DOI] [PMC free article] [PubMed] [Google Scholar]
- 8.To T, Guttmann A, Lougheed MD, Gershon AS, Dell SD, Stanbrook MB, et al. Evidence-based performance indicators of primary care for asthma: a modified RAND Appropriateness Method. Int J Qual Health Care. 2010;22(6):476–485. doi: 10.1093/intqhc/mzq061. [DOI] [PubMed] [Google Scholar]
- 9.Gershon AS, Victor JC, Guan J, Aaron SD, To T. Pulmonary function testing in the diagnosis of asthma: a population study. Chest. 2012;141(5):1190–1196. doi: 10.1378/chest.11-0831. [DOI] [PubMed] [Google Scholar]
- 10.Lougheed M, Lemière C, Dell S, Ducharme F, Fitzgerald J, Leigh R, et al. Canadian Thoracic Society Asthma Management Continuum–2010 Consensus Summary for children six years of age and over, and adults. Can Respir J. 2010;17(1):15–24. doi: 10.1155/2010/827281. [DOI] [PMC free article] [PubMed] [Google Scholar]
- 11.Lougheed MD, Lemiere C, Ducharme FM, Licskai C, Dell SD, Rowe BH, et al. Canadian Thoracic Society 2012 guideline update: Diagnosis and management of asthma in preschoolers, children and adults. Can Respir J. 2012;19(2):38. doi: 10.1155/2012/635624. [DOI] [PMC free article] [PubMed] [Google Scholar]
- 12.Lynd L, Sandford A, Kelly E, Paré P, Bai T, Fitzgerald J, et al. Reconcilable differences: a cross-sectional study of the relationship between socioeconomic status and the magnitude of short-acting beta-agonist use in asthma. Chest. 2004;126(4):1161–1168. doi: 10.1378/chest.126.4.1161. [DOI] [PubMed] [Google Scholar]
- 13.Lynd L, Guh D, Paré P, Anis A. Patterns of inhaled asthma medication use: a 3-year longitudinal analysis of prescription claims data from British Columbia, Canada. Chest. 2002;122(6):1973–1981. doi: 10.1378/chest.122.6.1973. [DOI] [PubMed] [Google Scholar]
- 14.Glazier R, Zagorski B, Rayner J. ICES Investigative Report. Toronto: Institute for Clinical Evaluative Sciences; 2012. Comparison of Primary Care Models in Ontario by Demographics, Case Mix and Emergency Department Use, 2008/09 to 2009/10. [Google Scholar]
- 15.Matheson FI, Moineddin R, Dunn JR, Creatore MI, Gozdyra P, Glazier RH. Urban neighborhoods, chronic stress, gender and depression. Soc Sci Med. 2006;63(10):2604–2616. doi: 10.1016/j.socscimed.2006.07.001. [DOI] [PubMed] [Google Scholar]
- 16.Gershon A, Guan J, Wang C, Victor J, To T. Describing and quantifying asthma comorbidity [corrected]: a population study. PLoS ONE. 2012;7(5):e34967. doi: 10.1371/journal.pone.0034967. [DOI] [PMC free article] [PubMed] [Google Scholar]
- 17.Gershon A, Wang C, Guan J, Vasilevska-Ristovska J, Cicutto L, To T. Identifying individuals with physician diagnosed COPD in health administrative databases. COPD. 2009;6(5):388–394. doi: 10.1080/15412550903140865. [DOI] [PubMed] [Google Scholar]
- 18.Jennison C, Turnbull B. Sequential equivalence testing and repeated confidence intervals, with applications to normal and binary responses. Biometrics. 1993;49(1):31–43. doi: 10.2307/2532600. [DOI] [PubMed] [Google Scholar]
- 19.SAS Institute Inc . SAS/STAT User's Guide, Version 9. 2006. [Google Scholar]
- 20.Glazier RH, Zagorski BM, Rayner J. Comparison of Primary Care Models in Ontario by Demographics, Case Mix and Emergency Department Use, 2008/09 to 2009/10. Toronto: Institute for Clinical Evaluative Sciences; 2012. [Google Scholar]
- 21.Roland M. Linking physicians' pay to the quality of care - a major experiment in the United Kingdom. N Engl J Med. 2004;351:1448–1454. doi: 10.1056/NEJMhpr041294. [DOI] [PubMed] [Google Scholar]
- 22.Shih A, Davis K, Schoenbaum S, Gauthier A, Nuzum R, McCarthy D. The Commonwealth Fund. 2008. Organizing the U.S. Health Care Delivery System for High Performance. [Google Scholar]
- 23.Aaron SD, Vandemheen KL, Boulet LP, McIvor RA, Fitzgerald JM, Hernandez P, et al. Overdiagnosis of asthma in obese and nonobese adults. CMAJ. 2008;179(11):1121–1131. doi: 10.1503/cmaj.081332. [DOI] [PMC free article] [PubMed] [Google Scholar]
- 24.Stupka E, de Shazo R. Asthma in seniors: Part 1. Evidence for underdiagnosis, undertreatment, and increasing morbidity and mortality. Am J Med. 2009;122(1):6–11. doi: 10.1016/j.amjmed.2008.09.022. [DOI] [PubMed] [Google Scholar]
- 25.Quinn K, Shalowitz M, Berry C, Mijanovich T, Wolf R. Racial and ethnic disparities in diagnosed and possible undiagnosed asthma among public-school children in Chicago. Am J Public Health. 2006;96(9):1599–1603. doi: 10.2105/AJPH.2005.071514. [DOI] [PMC free article] [PubMed] [Google Scholar]
- 26.Huzel L, Roos LL, Anthonisen NR, Manfreda J. Diagnosis asthma: The fit between survey and administrative database. Can Respir J. 2002;9(6):407–412. doi: 10.1155/2002/921497. [DOI] [PubMed] [Google Scholar]
- 27.Devlin RA, Sarma S. Do physicians remuneration schemes matter? The case of Canadian family physicians. J Health Econ. 2008;27:1168–1181. doi: 10.1016/j.jhealeco.2008.05.006. [DOI] [PubMed] [Google Scholar]
- 28.Kantarevic J, Kralj B, Weinkauf D. Enhanced fee-for-service model and physician productivity: evidence from Family Health Groups in Ontario. J Health Econ. 2011;30(1):99–111. doi: 10.1016/j.jhealeco.2010.10.005. [DOI] [PubMed] [Google Scholar]
- 29.Kantarevic J, Kralj B. Link between pay for performance incentives and physician payment mechanisms: evidence from the diabetes management incentive in ontario. Health Econ. 2013;22(12):1417–1439. doi: 10.1002/hec.2890. [DOI] [PubMed] [Google Scholar]
- 30.Li J, Hurley J, Decicca P, Buckley G. Physician response to pay-for-performance: evidence from a natural experiment. Health Econ. 2013. [DOI] [PubMed]


