

Abstract
Objective
Our main objective was to compare the regulation of cortisol production within omental (Om) and abdominal subcutaneous (Abd sc) human adipose tissue.
Methods and Procedures
Om and Abd sc adipose tissue were obtained at surgery from subjects with a wide range of BMI. Hydroxysteroid dehydrogenase (HSD) activity (3H-cortisone and 3H-cortisol interconversion) and expression were measured before and after organ culture with insulin and/or dexamethasone.
Results
Type 1 HSD (HSD1) mRNA and reductase activity were mainly expressed within adipocytes and tightly correlated with adipocyte size within both depots. There was no depot difference in HSD1 expression or reductase activity, while cortisol inactivation and HSD2 mRNA expression (expressed in stromal cells) were higher in Om suggesting higher cortisol turnover in this depot. Culture with insulin decreased HSD reductase activity in both depots. Culture with dexamethasone plus insulin compared to insulin alone increased HSD reductase activity only in the Om depot. This depot-specific increase in reductase activity could not be explained by an alteration in HSD1 mRNA or protein, which was paradoxically decreased. However, in Om only, hexose-6-phosphate dehydrogenase (H6PDH) mRNA levels were increased by culture with dexamethasone plus insulin compared to insulin alone, suggesting that higher nicotinamide adenine dinucleotide phosphate-oxidase (NADPH) production within the endoplasmic reticulum (ER) contributed to the higher HSD reductase activity.
Discussion
We conclude that in the presence of insulin, glucocorticoids cause a depot-specific increase in the activation of cortisone within Om adipose tissue, and that this mechanism may contribute to adipocyte hypertrophy and visceral obesity.
INTRODUCTION
Evidence from clinical and animal model studies implicate glucocorticoids in the pathogenesis of obesity, especially visceral obesity (1–3). The prereceptor metabolism of glucocorticoids is catalyzed by 11β-hydroxysteroid dehydrogenases (HSDs). Type 1 HSD (HSD1) is highly expressed in human adipose tissue and acts in vivo as a reductase, converting inactive cortisone to active cortisol (4,5) thereby amplifying glucocorticoid action. Most studies show that HSD1 mRNA expression and reductase activity measured in tissue homogenates are higher in the abdominal subcutaneous (Abd sc) adipose tissue of obese compared to nonobese subjects (3,4,6,7). Measurement of HSD activity in intact tissue, as opposed to tissue homogenates, is important because the direction of the HSD reaction depends on the production of its cofactor, nicotinamide adenine dinucleotide phosphate-oxidase (NADPH), by hexose-6-phosphate dehydrogenase (H6PDH) within the lumen of the endoplasmic reticulum (ER) where it acts (8). Cortisol inactivation can also be catalyzed by HSD2, which is reportedly expressed at low levels in human adipose tissue (7). This study therefore examined the interconversion of cortisone and cortisol as well as the expression of HSD1 and 2 in human adipose tissues as a function of obesity.
It is logical to postulate that higher cortisol synthesis in visceral fat depots contributes to the preferential expansion of this depot. Consistent with this idea, HSD reductase activity was higher in stromal cultures derived from human omental (Om) compared to Abd sc adipose tissue (9,10). However, no difference was detected in studies of fresh tissue (4,11). An in situ hybridization study (12) and our own data reported herein show that adipocytes are the main site of adipose tissue expression of HSD1 mRNA. Thus, it is logical to express data on HSD activity in adipose tissue on a per adipocyte basis and assess its activity in relation to adipocyte size (13), and this was a goal of this study.
Little is known with regard to mechanisms regulating HSD activity and expression in human adipose tissues. Limited evidence suggests a role for insulin and glucocorticoid (7). Cultured preadipocytes derived from Om compared to Abd sc studied prior to differentiation were more responsive to the effect of cortisol plus insulin to increase in HSD reductase activity; however, the relevance to mature adipose tissue is unclear. In this study, we tested the hypothesis that intact fragments of Om were more responsive to the glucocorticoid regulation of HSD1 mRNA expression and reductase activity. Glucocorticoid effects were studied in the absence and presence of insulin, because these hormones act synergistically to regulate adipocyte function (14–17), and insulin decreases HSD reductase activity in in vivo studies (18).
METHODS AND PROCEDURES
Subjects
Adipose tissue was obtained during intraabdominal surgeries for morbid obesity or gynecological abnormalities. By medical history, all patients were free of diabetes, and endocrine or inflammatory diseases. Three individuals had lost substantial weight as a result of prior obesity surgeries but were weight stable for at least 1 month prior to surgery. Subjects taking β-blockers, but not other antihypertensives, were excluded. Surgeries took place at the St. Peters Medical Center (New Brunswick, NJ) and the University of Maryland Medical Center (Baltimore, MD). All subjects gave informed consent as approved by Institutional Review Board of Rutgers University, St. Peters Hospital, and/or the University of Maryland at Baltimore. Subject characteristics are listed in Table 1.
Table 1.
Characteristics of subjects
| Age (years) | BMI (kg/m2) | Adipocyte weight (μg lipid/cell)
|
||
|---|---|---|---|---|
| Om | sc | |||
| Women (pre) n = 14 (9W, 5AA) | 40 ± 1.3 (35–47) | 39.6 ± 3.5 (23.0–61.0) | 0.61 ± 0.10 (0.23–1.21) | 0.76 ± 0.11* (0.30–1.34) |
| Women (post) n = 11(10W, 1AA) | 57 ± 1.6 (49–63) | 34.8 ± 3.2 (24.7–53.8) | 0.38 ± 0.07 (0.09–0.63) | 0.47 ± 0.08* (0.19–0.81) |
| Men n = 9 (9W) | 35 ± 3.6 (19–47) | 53.0 ± 3.8 (30.0–64.0) | 0.68 ± 0.10 (0.21–1.17) | 0.68 ± 0.11 (0.26–1.25) |
AA, African American; Om, omental; sc, subcutaneous; W, white.
P < 0.05, depot difference.
Adipose tissue handling and culture
Adipose tissue was obtained and processed for incubations, organ culture, and preparation of cell fractions as previously described (19).
Measurement of cortisol and cortisone interconversion
Adipose tissue fragments (totaling 50–100 mg) were incubated with 20 nmol/l 3H-cortisol or 3H-cortisone for 90 min in 1 ml of M199 buffered with bicarbonate and 4-(2-hydroxyethyl)-1-piperazineethansulfonic acid under an atmosphere of 95% O2:5% CO2. The media were extracted with ethyl acetate and counts in cortisol and cortisone were determined by high-performance liquid chromatography (20). The data were calculated as % conversion per 50 mg tissue or per 105 adipocytes. Preliminary experiments showed that the conversion of 3H-cortisone to 3H-cortisol was linear with time up to 3 h of incubation (up to a conversion rate of ~30%), and the % conversion was similar at concentrations of 20 and 200 nmol/l cortisone or cortisol. Our preliminary experiments also showed that % conversion of 3H-cortisone to 3H-cortisol was proportional to tissue weight between 25 and 100 mg tissue.
Adipocyte size and number
Mean adipocyte size (lipid weight) was determined using photomicrographs or by Coulter counting (21,22). These methods provided comparable results (23), so all data were pooled.
HSD1 and 2, and H6PDH mRNA expression
Total RNA was extracted from adipose tissue, fractionated adipocytes, or stromal vascular cells using modified method of Chomczynski and Sacchi (24). Expression of HSD1, 2, and H6PDH mRNAs was measured with quantitative real-time PCR. Applied Biosystems (ABI, Foster City, CA) Taqman PCR kits with commercially available assay-on- demand primers were used on an ABI PRISM HT-7900 Sequence Detection System. Cyclophilin A mRNA was used as an internal standard, as it did not vary with level of obesity or fat cell size relative to 18S ribosomal RNA levels (25). Threshold cycle (Ct) values were obtained and relative gene expression was calculated using the formula (1/2)Ct target gene-Ct cyclophilin A×100. For the absolute quantitation of HSD1 and 2 in each depot in a subset of Om and sc samples, copy numbers of HSD1, 2, and 18S mRNAs were obtained using a standard curve generated with HSD1 and HSD2 cDNA templates (cloned into pcDNA3.1).
Western blotting
Adipose tissue lysates (before and after culture) were prepared as described previously (26). Approximately 50–80 μg of total protein was subjected to 10% sodium dodecyl sulfate-polyacrylamide gel electrophoresis and transferred to poly vinyledene fluoride followed by immunoblot analysis with rabbit anti-human 11β-HSD1 antibody and mouse anti-human a-tubulin antibody (Sigma, St. Louis, MO) as a loading control.
Statistics
The effects of depot and hormones were determined by analysis of variance with repeated measures using SPSS v13 (SPSS, Chicago, IL). Post-hoc paired t-tests were used to compare individual means when overall F values or interactions were statistically significant. Pearson’s regression coefficients were analyzed using Prism software (GraphPad software, San Diego, CA) and slopes of regression lines were compared using a paired t-test. The effects of race, sex, and BMI on the comparison of HSD expression in Om and Abd sc were analyzed using a linear model with SPSS v13 (SPSS).
RESULTS
Similar HSD1 expression and conversion of cortisone to cortisol in Om and Abd sc adipose tissue, but higher HSD2 and inactivation of cortisol in Om
Contrary to expectation, HSD1 mRNA levels trended higher in Abd sc than Om (Figure 1a) (P = 0.06 in a linear model that included race, BMI, and sex). Relative expression of HSD2 mRNA was about 2.7-fold higher in Om than Abd sc (P < 0.025), independent of race, BMI, or sex. To rule out the possibility that a difference in the efficiency of the real-time PCR for HSD1 and 2 contributed to our finding of relatively high HSD2 relative to HSD1, in subset of 13 Om and Abd sc samples (6 men and 7 women, BMI; 47 ± 4.3 (23–64), age; 39 ± 3.1 (19–59)), we quantitated the absolute amount of HSD1 and HSD2 mRNA levels using standard curves prepared from HSD1 and 2 cDNA plasmids. This analysis verified that there was ~2.4- and 2.9-fold more HSD1 than HSD2 in Abd sc and Om, respectively (each P < 0.01, data not shown). Consistent with higher expression of HSD1 than HSD2, the reductase activity (3H-cortisone to 3H-cortisol) was greater than the dehydrogenase activity (3H-cortisol to 3H-cortsone) (two-way ANOVA, P < 0.001; Figure 1b, normalized to tissue weight and Figure 1c, normalized to cell number).
Figure 1.

Comparison of HSD1 and 2 mRNA levels and interconversion of 3H-cortisol and 3H-cortisone in omental (Om, open bars) and abdominal subcutaneous (sc, black bars) adipose tissues. (a) Paired Om and sc human adipose tissue samples from 26 subjects (7 men and 19 women, BMI: 39.8 ± 2.6 (23–64). Age: 45.6 ± 2.5 (19–63)) were obtained and relative expression levels of HSD1 and 2 quantified relative to cyclophilin A with quantitative real-time PCR. Data were analyzed by two-way ANOVA followed by paired t-test. *P < 0.05, depot effect. (b and c) HSD1 reductase activity was assessed in intact fragments of paired Om and sc adipose tissues by measuring the conversion of 3H-cortisone to cortisol during a 90-min incubation in a subset of subjects (6 men, 15 women, BMI: 42.4 ± 3.1 (23–64), age: 43.9 ± 3.1 (19–63)). Data were expressed per (b) 50 mg adipose tissue or (c) 105 cells and analyzed by two-way ANOVA followed by paired t-test. **P < 0.01 (depot effect). (d) Comparison of the correlation between HSD1 mRNA levels and 3H-cortisone to 3H-cortisol conversion in Om and sc human adipose tissue (age: 45.4 ± 3.6 (34–63), BMI: 39.8 ± 3.7 (23–64), 4 men and 11 women). The slopes of the relationship were significantly greater in Om than sc (Om; 4.55 ± 1.67 (mean ± s.d.) vs. sc; 1.26 ± 0.38, P < 0.05, n = 15). HSD1, type 1 hydroxysteroid dehydrogenase; PPIA, cyclophilin A.
Intact fragments of Om and Abd sc adipose tissue converted nearly identical amounts of 3H-cortisone to 3H-cortisol during a 90-min incubation, regardless of whether data were expressed per gram of tissue (Figure 1b) or per adipocyte (Figure 1c). Consistent with the finding of higher HSD2 mRNA levels in Om than Abd sc, the rate of inactivation of cortisol to cortisone was significantly higher in Om. Additionally, as shown in Figure 1d, HSD1 mRNA levels and the conversion of cortisone to cortisol were highly correlated within both depots. The slopes of the relationship significantly differed between depots, such that there was higher HSD reductase activity for a given level of HSD1 mRNA in Om than Abd sc (Om; 4.55 ± 1.67 vs. Abd sc; 1.26 ± 0.38, P < 0.05, n = 15). HSD2 mRNA levels did not correlate with HSD dehydrogenase activity in either depot (data not shown).
HSD1 mRNA was expressed almost exclusively in the adipocytes, while HSD2 mRNA was expressed in the stromal fraction
Adipose tissue is composed of adipocytes and stromal cells. To determine the site of HSD expression, adipose cell fractions were separated by collagenase digestion. HSD1 mRNA expression was found almost exclusively in the adipocyte fraction of both Om and Abd sc, while the HSD2 mRNA was found predominately in the stromal fraction (Figure 2a,b). Consistent with these data, virtually all of the cortisone reductase activity was recovered in the adipocyte fraction (Figure 2c).
Figure 2.

Comparison of (a) HSD1 and (b) HSD 2 mRNA levels in adipose tissue, adipocytes (fat cells (FCs)) or stromal vascular cells (SVCs). Adipocytes and SVCs were prepared by collagenase digestion of human omental and subcutaneous adipose tissue (1 man and 6 women, BMI = 35.3 ± 2.4 (25–41), age = 47.7 ± 6.3 (26–63)). Relative expression levels of (a) HSD1 and (b) HSD2 were quantified relative to the control cyclophilin A by quantitative real-time PCR. (c) HSD reductase activity in tissue fragments, adipocyte or SVCs. Reductase activity of HSD1 was assessed by measuring the conversion of 3H-cortisone to 3H-cortisol in tissue fragments and cell fractions (n = 2). Data for tissue and cell fractions were normalized to tissue or adipocyte lipid. HSD1, type 1 hydroxysteroid dehydrogenase.
HSD1 expression levels and reductase activity in tissue fragments were proportional to adipocyte size
HSD1 mRNA levels were tightly correlated with adipocyte size within both Om and Abd sc (Figure 3a), and there was no significant difference in the slopes of the relationship. Similarly, the rate of conversion of cortisone to cortisol (HSD reductase activity) was tightly correlated with adipocyte size in both depots (Figure 3b). When HSD reductase activity was expressed relative to tissue weight the correlation became weaker, but remained significant in Om, with a similar trend in Abd sc (Figure 3c). BMI did not significantly correlate with HSD1 mRNA levels (data not shown), but it did correlate with HSD reductase activity per adipocyte (Figure 3d). The cortisol inactivation to cortisone or the HSD2 mRNA level was not related to adipocyte size in Om or Abd sc (data not shown).
Figure 3.

HSD1 expression and reductase activity are positively associated with adipocyte size and obesity (BMI). (a) Correlation between adipocytes size (FCS, expressed as average adipocyte weight (μg lipid/adipocyte)) and HSD1 mRNA levels in omental (Om) and abdominal subcutaneous (Abd sc) human adipose tissue. (b) Correlation between fat cell size (FCS) and % conversion of 3H-cortisone to 3H-cortisol expressed per 105 adipocytes in Om and Abd sc. (c) Correlation of adipocyte size and % conversion of 3H-cortisone to 3H-cortisol per 50 mg of tissue in Om and Abd sc. (d) Correlation between BMI (kg/m2) and 3H-cortisone to 3H-cortisol per 105 adipocytes in Om and Abd sc. Data are from 22 subjects (6 men and 16 women), BMI: 40.6 ± 2.8 (23–64), age: 46 ± 2.8 (19–63). Individual numbers (n) are given on each figure, because not all parameters were measured in all subjects. HSD1, type 1 hydroxysteroid dehydrogenase.
Culture with insulin plus dexamethasone results in a depot difference in HSD activity
Organ culture of Om fat for 7 days under basal conditions (no hormones) leads to a spontaneous increase in HSD reductase activity (Figure 4) and HSD1 mRNA levels (Figure 5) compared to the initial values. In contrast, culture under basal conditions did not increase HSD reductase activity in Abd sc. In both depots, culture with insulin, compared to basal conditions, decreased both HSD reductase activity and HSD1 mRNA levels. Culture of Om with dex alone did not alter cortisone conversion to cortisol compared to the high levels observed under basal conditions, but the activity was higher than initial (fresh values, 03) or after culture with insulin. Insulin did not alter dex-stimulated HSD reductase activity in Om or Abd sc. Importantly, culture with the combination of dex and insulin compared to insulin alone led to a significant twofold increase in HSD reductase activity in Om, but not in Abd sc, resulting in significant depot difference (P < 0.01, paired t-test) under this physiologically relevant condition. HSD reductase activity in the Om depot was also significantly higher than that in Abd sc after culture in basal and dex alone conditions (each P < 0.01 by paired t-tests).
Figure 4.

Depot difference in the effect of culture with insulin and/or dexamethasone on type 1 hydroxysteroid dehydrogenase reductase activity in omental and subcutaneous human adipose tissue. Adipose tissue from total 20 subjects (7 men, 13 women, BMI: 45.7 ± 3.4 (25–64), age: 43.5 ± 3.4 (19–63)) was placed in organ culture in the conditions of basal (B), without any hormones), 7 nmol/l insulin (I), 25 nmol/l dexamethasone (D), or the combination of insulin plus dexamethasone (ID) for 6–7 days. % conversion of 3H-cortisone to 3H-cortisol or 3H-cortisol to 3H-cortisone was determined before (fresh; 0′) and after culture during a 90-min incubation (in the absence of I and D). Data were analyzed by two-way ANOVA followed by paired t-test. Bars with different letters are significantly different from each other (P < 0.05). #P < 0.05 basal vs. insulin alone by paired t-test. After culture, the depot differences in activity within hormonal condition were all significant by paired t-tests, P < 0.01, except for the insulin alone condition.
Figure 5.
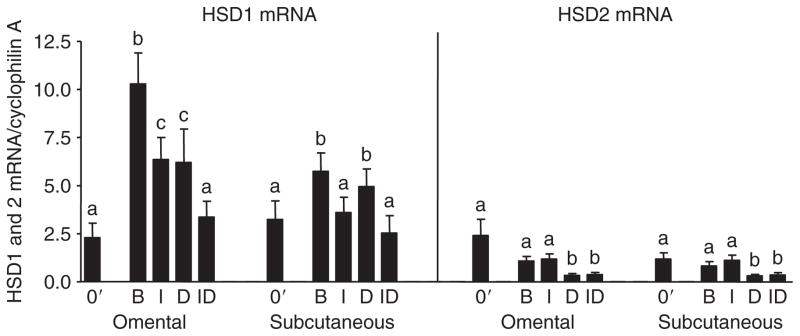
Effect of culture with insulin and dexamethasone on type 1 hydroxysteroid dehydrogenase (HSD1) and 2 mRNA levels in omental and abdominal subcutaneous adipose tissue. Adipose tissue from a subset of subjects described in Figure 4 (total 12 subjects (6 men, 6 women, BMI averaged 42.9 ± 3.6; range 25.2–58, age averaged 46.7 ± 4.3, range 19–63)) was used to assess relative expression levels of HSD1 and 2 before (0′) and after culture with quantitative real-time PCR. Data were analyzed by two-way ANOVA followed by paired t-test. Bars with different letter are significantly different from each other (P < 0.05). B, basal; D, dexamethasone; I, insulin; ID, insulin plus dexamethasone.
A subgroup analysis of the data on cultured adipose tissue indicated that the stimulatory effect of dex plus insulin (compared to insulin alone) on HSD reductase activity in Om was highly significant in the six severely obese premenopausal women (P < 0.05) and seven severely obese men (P < 0.05) and, therefore, the response is not modulated by sex. However, the stimulatory effect of dex (in the presence of insulin) was not consistent in the seven nonobese subjects (women with a mean BMI of 28 ± 1, two premenopausal, five postmenopausal) studied (data not shown). Additional Om adipose samples from nonobese pre-menopausal women will be needed to determine whether the lack of effect of dex in these subjects is a function of menopause, hormone replacement therapy, or level of obesity.
In both Om and Abd sc, chronic dex treatment in the presence of insulin decreased the inactivation of cortisol to cortisone by half compared to the insulin alone or zero time (prior to culture) values (all comparisons P < 0.02), in parallel to a decrease in HSD2 mRNA (P < 0.01). In Abd sc but not Om, culture with insulin significantly increased HSD dehydrogenase activity (cortisol to cortisone conversion). Thus in Abd sc, insulin suppressed cortisol synthesis from cortisone while increasing its inactivation.
Alterations in HSD1 expression after culture are due to changes at the level of the adipocyte
To determine whether the increase in HSD reductase activity after organ culture was associated with the adipocyte or stromal fraction of adipose tissue, cultured adipose tissue was subjected to collagenase digestion. After culture with the combination of insulin and dex, HSD1 mRNA (n = 3) and reductase activity (n = 2) remained predominantly associated with the adipocyte fraction (>90%) as it was prior to culture (data not shown). HSD2 mRNA and dehydrogenase activity were also associated with the stromal cell fraction after culture. Thus, the changes in HSD reductase activity in adipose tissue after culture were due to changes at the level of mature, floating adipocytes.
Dex-induced alterations in HSD reductase activity are due to post-translational events
The changes in HSD reductase activity in Om were not always paralleled by alterations in HSD1 mRNA. Culture under basal conditions increased HSD1 mRNA expression in Om (approximately fourfold) and Abd sc (approximately twofold) (Figure 5), while it increased HSD reductase activity in Om to a lesser extent (~30%) and had no effect in Abd sc (Figure 4). In both depots, the expression level of HSD1 mRNA was similar after culture with insulin plus dex compared to that observed in fresh tissue. Further, in Om, HSD1 mRNA levels were decreased by culture with dex plus insulin compared to insulin alone, while the reductase activity was paradoxically doubled. These data suggest that a post-transcriptional mechanism exists in Om, but not in Abd sc, to increase HSD reductase activity after chronic exposure to glucocorticoids in the presence of insulin.
To uncover mechanisms regulating the depot-specific response of HSD activity to glucocorticoids, changes in HSD1 protein expression were also assessed. Changes in HSD1 protein expression determined by western blotting generally reflected changes in HSD1 mRNA levels. In both depots, culture with dex decreased HSD protein levels as expected from the decline in HSD1 mRNA expression (Figure 6). The difference was also significant in both depots when dex was added in the presence of insulin. In addition, insulin added in the absence of dex suppressed HSD1 protein levels in both depots, in parallel to declines in mRNA and reductase activity. Further, insulin added in the presence of dex also decreased HSD1 protein levels by ~50% compared to dex alone. The higher HSD1 reductase activity in Om after culture with insulin plus dex compared to insulin alone despite the lower mass of HSD1 protein could be due to higher NAPDH generation within the ER. Consistent with this hypothesis, we found that culture with insulin plus dex compared to insulin alone increased H6PDH mRNA levels (Figure 7). In contrast, this upregulation of H6PDH expression by dex (in the presence of insulin) did not occur in Abd sc.
Figure 6.

Effect of culture with insulin and dexamethasone on type 1 hydroxysteroid dehydrogenase (HSD1) protein expression in omental (Om) and abdominal subcutaneous (Abd sc) human adipose tissue. Adipose tissue homogenates were prepared from Om and Abd sc adipose tissue after culture with insulin and/or dexamethasone (as described in the legend to Figure 4) and subjected to immunoblot analysis using rabbit anti-human 11β-HSD1 antibody and mouse anti-human α-tubulin antibody. Data are mean ± s.e.m. of five paired (Om and Abd sc) samples from severely obese subjects (a subset of subject described in Figure 4, 1 man, 4 women). ANOVA revealed significant main effects of dexamethasone (P < 0.005) and depot (P < 0.005), and a trend toward an insulin effect, with no interactions. *Dex effect (B vs. D or I vs. ID) by post-hoc t-test, P ≤ 0.05; $insulin effect B vs. I, P < 0.1; †P < 0.05, insulin effect—D vs. ID). Depot differences were significant by post-hoc tests for B (P < 0.05), I (P < 0.02), and ID (P < 0.001) conditions. B, basal; D, dexamethasone; I, insulin; ID, insulin plus dexamethasone.
Figure 7.

Depot difference in the regulation of hexose-6-phosphate dehydrogenase (H6PDH) mRNA levels in omental and abdominal subcutaneous human adipose tissue. Relative expression levels of H6PDH mRNA levels were determined with quantitative real-time PCR after organ culture (basal (B), without any hormones), 7 nmol/l insulin (I), 25 nmol/l dexamethasone (D), or the combinations of insulin plus dexamethasone (ID)) in a subset of subjects described in Figure 4 (5 men, 3 women, BMI = 49 ± 3.7; 28–58, age = 40 ± 4.7; 19–59). *P < 0.05, paired t-test on log-transformed values, insulin alone vs. insulin plus dex.
DISCUSSION
We found that HSD1 mRNA levels and its reductase activity in intact fragments of Om and Abd sc human adipose tissue were proportional to adipocyte size, but did not differ between the depots. Organ-culture studies suggested that in response to systemic hypercortisolemia plus hyperinsulinemia, the depot-specific upregulation of HSD reductase activity in Om may enhance cortisol synthesis within this depot, and this mechanism may contribute to the development of visceral obesity in response to stress. Furthermore, our data show that post-translational mechanisms contribute to the higher activity of HSD reductase in Om adipose tissue cultured with insulin and dexamethasone (compare to insulin alone) and may be related to a higher expression of H6PDH mRNA.
HSD activity is proportional to adipocyte size
Our results support the conclusion that adipose HSD reductase activity was increased in obesity, independent of using tissue weight or adipocyte number in the denominator, although the correlation was much stronger on a per adipocyte basis. Thus, our data suggest that higher HSD reductase activity in enlarged adipocytes of obese humans may contribute to the higher synthesis of cortisol in adipose tissue of obese subjects in vivo (27). Previous studies on the relationship of obesity to adipose HSD1 reductase activity are conflicting (3,4,7,28), and our data suggest that this could be due to the homogenate assay used in prior studies or the denominator used for expression of the results (relative to tissue protein). In agreement with our results, Michailidou et al. (29) recently reported a strong positive correlation between HSD1 mRNA levels and adipocyte size in Om adipose tissue. However, they did not detect this correlation in Abd sc adipocytes from another group of subjects, perhaps due to a small sample size.
Cortisol inactivation was higher in Om
Although HSD2 expression in adipose tissue was thought to be minor (7), we found significantly higher expression of HSD2 mRNA levels in Om than Abd sc. Rates of cortisol inactivation in Om were also higher than Abd sc, suggesting a functional role for HSD2 in Om. Interestingly, in contrast to HSD1, HSD2 mRNA and dehydrogenase activity were found in stromal cells of adipose tissue, suggesting that the turnover of cortisol is increased within Om adipose tissue and this may limit its concentration within its local paracrine environment. Alternatively, or in addition, higher HSD2 activity in the vasculature may prevent excessive spillover of cortisol into the circulation. It will be important to determine the stromal cell type that expresses HSD2 to understand fully the physiological implications of this finding.
Although we found in preliminary experiments that the conversion of 3H-cortisone to 3H-cortisol was linear with time, it is possible that the higher rate of cortisol inactivation (via the higher HSD2 activity) in Om may have contributed to our finding that net conversion of 3H-cortisone to 3H-cortisol did not differ between Om and Abd sc. Nevertheless, the similar net conversion of cortisone to cortisol in intact tissue fragments from both depots is likely to be physiologically relevant in the control of cortisol availability to the glucocorticoid receptor.
Culture with glucocorticoids elicits a depot difference in cortisone conversion to cortisol in adipose tissue of obese humans
Although there was no difference at baseline HSD reductase activity or HSD1 expression, in agreement with prior reports (4,11), culture with dex plus insulin, compared to insulin alone, increased activity only in Om. This increase in cortisol production in Om could be considered a feed-forward regulation, as a glucocorticoid analog (dex) increases production of more glucocorticoid (cortisol).
The “stimulatory effect of dex” compared to insulin alone on HSD reductase activity was consistently observed only in Om adipose tissue of severely obese men and women (13/13). This response was not consistently observed in Om from overweight to obese postmenopausal women. Although it is not possible to determine from these data whether the lack of responsiveness to dexamethasone is due to the lower BMI or postmenopausal status of this group, these data suggest that Om adipose tissue of the severely obese are particularly responsive to glucocorticoids, and that this may contribute to the development or maintenance of their visceral fat stores. Further studies are needed to investigate cortisol and cortisone metabolism in adipose tissue of subjects characterized with respect to level of visceral adiposity and in relation to timing of fat redistribution during menopause or other stressors that result in transient hypercortisolemia.
Dexamethasone-induced increases in HSD reductase activity in tissues fragments is due to post-transcriptional mechanisms
The increase in HSD reductase activity by dex (comparing insulin plus dex vs. insulin alone) in intact Om tissue fragments occurred despite a ~50% decrease in HSD1 mRNA and protein. In Abd sc adipose tissue, HSD1 reductase activity did not change with dex treatment, but HSD1 protein declined by 50%. Thus, in both depots, culture with dex plus insulin compared to insulin alone leads to higher HSD reductase specific activity, presumably due to post-translational mechanisms. Because our measurements of activity were made in intact tissue, the higher activity could reflect changes in either HSD1 enzyme specific activity or an alteration in NADPH availability within the ER lumen where HSD1 acts (30,31). Consistent with the latter possibility, we found higher H6PDH mRNA expression in Om adipose tissue cultured with dex plus insulin compared to insulin alone. Assuming this increase in H6PDH mRNA translates into a similar increase in H6PDH activity, the higher NADPH availability within the ER likely contributes to the observed increase in HSD1 reductase activity. Similarly, Bujalska et al. observed a correlation between HSD reductase activity and H6PDH mRNA levels in cultures of newly differentiated human adipocytes (30). Some other means of regulation of HSD reductase activity, such as multimerization of HSD1, is also possible (30,31). We also found that the slopes of the regression lines correlating HSD1 mRNA and reductase activity in Om and Abd sc differed significantly, such that in Om, activity was higher for a given level of HSD1 mRNA, suggesting that HSD1 specific activity in situ may differ in Om and Abd sc. Additional studies of depot differences in H6PDH activity and HSD1 protein levels are needed to verify this hypothesis.
Insulin suppression of HSD activity is paralleled by alterations in HSD1 mRNA and protein
In the absence of dex, insulin suppressed HSD reductase activity measured in both Om and Abd sc adipose tissue in parallel to declines in HSD1 mRNA and protein content. In the presence of dex, insulin decreased HSD1 protein in both depots. In Abd sc, this downregulation of HSD1 protein expression by insulin may limit glucocorticoid-induced increases in HSD activity, and thereby contribute to depot differences in HSD reductase activity in response to hypercortisolemia.
Our data suggest that adipocytes from obese individuals are not resistant to insulin with respect to the ability of chronic exposure to downregulate HSD1 expression. This observation is consistent with in vivo studies (18,27). However, a recent study by Walker’s group (32) documented an acute rise in in vivo cortisol synthesis in adipose tissue after a meal. Further studies on the short- and long-term insulin regulation of depot-specific regulation of HSD activity are clearly needed.
Depot difference in HSD expression after basal culture
We also observed an increase in HSD reductase activity and HSD1 mRNA after the “unphysiological” condition of basal (no hormones) culture for 7 days that was most marked in Om. We speculate that the resulting depot difference in HSD expression after basal culture may result from greater quantities of inflammatory cytokines produced in Om cultures (33,34), as these are known to stimulate HSD1 expression (35). Further studies are needed to assess the role of inflammatory cytokines in the regulation of HSD expression, but it is interesting to note that unlike the depot difference elicited by culture with insulin plus dex, it is not associated with any alteration in enzyme specific activity.
In conclusion, we demonstrated that the expression of HSD1 mRNA and the ability of human adipose tissue to convert inactive cortisone to cortisol is proportional to adipocyte size in both Om and Abd sc human adipose tissue. However, on average, there was no depot difference. Our data also point out the potential importance of depot differences in cortisol inactivation and HSD2 expression in visceral adipose tissues in regulating the local adipose microenvironment and cell type specific availability of cortisol. The lack of a depot difference in HSD1 mRNA expression or reductase activity in subjects maintaining a stable body weight indicates that increased local production of cortisol is unlikely to contribute importantly to Om adipose tissue function under these steady state conditions. However, our organ-culture studies suggest that dynamic increases in systemic hypercortisolemia combined with hyperinsulinemia, e.g., as would occur in response to stress or overfeeding, may lead to depot-specific upregulation of HSD reductase activity which in turn may contribute to the development of visceral obesity.
Acknowledgments
This work was supported in part by research grants from Merck (to S.K.F.), National Institutes of Health DK52398 (to S.K.F.) and DK072488 (Clinical Nutrition Research Unit of Maryland, S.K.F.), and the Geriatric Research and Education Clinical Center, Baltimore VA Medical Center.
Footnotes
DISCLOSURE
S.K.F received a research grant from Merck. A.H.-V., B.L.D., A.S., and S.S.M. are employees of Merck.
References
- 1.Tomlinson JW, Walker EA, Bujalska IJ, et al. 11beta-hydroxysteroid dehydrogenase type 1: a tissue-specific regulator of glucocorticoid response. Endocr Rev. 2004;25:831–866. doi: 10.1210/er.2003-0031. [DOI] [PubMed] [Google Scholar]
- 2.Masuzaki H, Paterson J, Shinyama H, et al. A transgenic model of visceral obesity and the metabolic syndrome. Science. 2001;294:2166–2170. doi: 10.1126/science.1066285. [DOI] [PubMed] [Google Scholar]
- 3.Lindsay RS, Wake DJ, Nair S, et al. Subcutaneous adipose 11 beta-hydroxysteroid dehydrogenase type 1 activity and messenger ribonucleic acid levels are associated with adiposity and insulinemia in Pima Indians and Caucasians. J Clin Endocrinol Metab. 2003;88:2738–2744. doi: 10.1210/jc.2002-030017. [DOI] [PubMed] [Google Scholar]
- 4.Tomlinson JW, Sinha B, Bujalska I, Hewison M, Stewart PM. Expression of 11beta-hydroxysteroid dehydrogenase type 1 in adipose tissue is not increased in human obesity. J Clin Endocrinol Metab. 2002;87:5630–5635. doi: 10.1210/jc.2002-020687. [DOI] [PubMed] [Google Scholar]
- 5.Stewart PM. Tissue-specific Cushing’s syndrome, 11beta-hydroxysteroid dehydrogenases and the redefinition of corticosteroid hormone action. Eur J Endocrinol. 2003;149:163–168. doi: 10.1530/eje.0.1490163. [DOI] [PubMed] [Google Scholar]
- 6.Rask E, Walker BR, Söderberg S, et al. Tissue-specific changes in peripheral cortisol metabolism in obese women: increased adipose 11beta-hydroxysteroid dehydrogenase type 1 activity. J Clin Endocrinol Metab. 2002;87:3330–3336. doi: 10.1210/jcem.87.7.8661. [DOI] [PubMed] [Google Scholar]
- 7.Engeli S, Böhnke J, Feldpausch M, et al. Regulation of 11beta-HSD genes in human adipose tissue: influence of central obesity and weight loss. Obes Res. 2004;12:9–17. doi: 10.1038/oby.2004.3. [DOI] [PubMed] [Google Scholar]
- 8.Hewitt KN, Walker EA, Stewart PM. Minireview: hexose-6-phosphate dehydrogenase and redox control of 11{beta}-hydroxysteroid dehydrogenase type 1 activity. Endocrinology. 2005;146:2539–2543. doi: 10.1210/en.2005-0117. [DOI] [PubMed] [Google Scholar]
- 9.Bujalska IJ, Kumar S, Stewart PM. Does central obesity reflect “Cushing’s disease of the omentum”? Lancet. 1997;349:1210–1213. doi: 10.1016/S0140-6736(96)11222-8. [DOI] [PubMed] [Google Scholar]
- 10.Bujalska IJ, Kumar S, Hewison M, Stewart PM. Differentiation of adipose stromal cells: the roles of glucocorticoids and 11beta-hydroxysteroid dehydrogenase. Endocrinology. 1999;140:3188–3196. doi: 10.1210/endo.140.7.6868. [DOI] [PubMed] [Google Scholar]
- 11.Desbriere R, Vuaroqueaux V, Achard V, et al. 11beta-hydroxysteroid dehydrogenase type 1 mRNA is increased in both visceral and subcutaneous adipose tissue of obese patients. Obesity (Silver Spring) 2006;14:794–798. doi: 10.1038/oby.2006.92. [DOI] [PubMed] [Google Scholar]
- 12.Paulmyer-Lacroix O, Boullu S, Oliver C, Alessi MC, Grino M. Expression of the mRNA coding for 11beta-hydroxysteroid dehydrogenase type 1 in adipose tissue from obese patients: an in situ hybridization study. J Clin Endocrinol Metab. 2002;87:2701–2705. doi: 10.1210/jcem.87.6.8614. [DOI] [PubMed] [Google Scholar]
- 13.Arner P, Ostman J. Relationship between the tissue level of cyclic AMP and the fat cell size of human adipose tissue. J Lipid Res. 1978;19:613–618. [PubMed] [Google Scholar]
- 14.Russell CD, Petersen RN, Rao SP, et al. Leptin expression in adipose tissue from obese humans: depot-specific regulation by insulin and dexamethasone. Am J Physiol. 1998;275:E507–E515. doi: 10.1152/ajpendo.1998.275.3.E507. [DOI] [PubMed] [Google Scholar]
- 15.Fried SK, Russell CD, Grauso NL, Brolin RE. Lipoprotein lipase regulation by insulin and glucocorticoid in subcutaneous and omental adipose tissues of obese women and men. J Clin Invest. 1993;92:2191–2198. doi: 10.1172/JCI116821. [DOI] [PMC free article] [PubMed] [Google Scholar]
- 16.Trujillo ME, Sullivan S, Harten I, et al. Interleukin-6 regulates human adipose tissue lipid metabolism and leptin production in vitro. J Clin Endocrinol Metab. 2004;89:5577–5582. doi: 10.1210/jc.2004-0603. [DOI] [PubMed] [Google Scholar]
- 17.Ottosson M, Vikman-Adolfsson K, Enerback S, Olivecrona G, Bjorntorp P. The effects of cortisol on the regulation of lipoprotein lipase activity in human adipose tissue. J Clin Endocrinol Metab. 1994;79:820–825. doi: 10.1210/jcem.79.3.8077367. [DOI] [PubMed] [Google Scholar]
- 18.Basu R, Singh RJ, Basu A, et al. Splanchnic cortisol production occurs in humans: evidence for conversion of cortisone to cortisol via the 11-beta hydroxysteroid dehydrogenase (11beta-hsd) type 1 pathway. Diabetes. 2004;53:2051–2059. doi: 10.2337/diabetes.53.8.2051. [DOI] [PubMed] [Google Scholar]
- 19.Yang RZ, Lee MJ, Hu H, et al. Acute-phase serum amyloid A: an inflammatory adipokine and potential link between obesity and its metabolic complications. PLoS Med. 2006;3:e287. doi: 10.1371/journal.pmed.0030287. [DOI] [PMC free article] [PubMed] [Google Scholar]
- 20.Hermanowski-Vosatka A, Balkovec JM, Cheng K, et al. 11beta-HSD1 inhibition ameliorates metabolic syndrome and prevents progression of atherosclerosis in mice. J Exp Med. 2005;202:517–527. doi: 10.1084/jem.20050119. [DOI] [PMC free article] [PubMed] [Google Scholar]
- 21.Hirsch J, Gallian E. Methods for the determination of adipose cell size in man and animals. J Lipid Res. 1968;9:110–119. [PubMed] [Google Scholar]
- 22.Maroni BJ, Haesemeyer R, Wilson LK, DiGirolamo M. Electronic determination of size and number in isolated unfixed adipocyte populations. J Lipid Res. 1990;31:1703–1709. [PubMed] [Google Scholar]
- 23.Lavau M, Susini C, Knittle J, Blanchet-Hirst S, Greenwood MR. A reliable photomicrographic method to determining fat cell size and number: application to dietary obesity. Proc Soc Exp Biol Med. 1977;156:251–256. doi: 10.3181/00379727-156-39916. [DOI] [PubMed] [Google Scholar]
- 24.Chomczynski P, Sacchi N. Single-step method of RNA isolation by acid guanidinium thiocyanate-phenol-chloroform extraction. Anal Biochem. 1987;162:156–159. doi: 10.1006/abio.1987.9999. [DOI] [PubMed] [Google Scholar]
- 25.Gabrielsson BG, Olofsson LE, Sjögren A, et al. Evaluation of reference genes for studies of gene expression in human adipose tissue. Obes Res. 2005;13:649–652. doi: 10.1038/oby.2005.72. [DOI] [PubMed] [Google Scholar]
- 26.Trujillo ME, Lee MJ, Sullivan S, et al. Tumor necrosis factor alpha and glucocorticoid synergistically increase leptin production in human adipose tissue: role for p38 mitogen-activated protein kinase. J Clin Endocrinol Metab. 2006;91:1484–1490. doi: 10.1210/jc.2005-1901. [DOI] [PubMed] [Google Scholar]
- 27.Sandeep TC, Andrew R, Homer NZ, et al. Increased in vivo regeneration of cortisol in adipose tissue in human obesity and effects of the 11beta-hydroxysteroid dehydrogenase type 1 inhibitor carbenoxolone. Diabetes. 2005;54:872–879. doi: 10.2337/diabetes.54.3.872. [DOI] [PubMed] [Google Scholar]
- 28.Rask E, Olsson T, Söderberg S, et al. Tissue-specific dysregulation of cortisol metabolism in human obesity. J Clin Endocrinol Metab. 2001;86:1418–1421. doi: 10.1210/jcem.86.3.7453. [DOI] [PubMed] [Google Scholar]
- 29.Michailidou Z, Jensen MD, Dumesic DA, et al. Omental 11beta-hydroxysteroid dehydrogenase 1 correlates with fat cell size independently of obesity. Obesity (Silver Spring) 2007;15:1155–1163. doi: 10.1038/oby.2007.618. [DOI] [PubMed] [Google Scholar]
- 30.Bujalska IJ, Draper N, Michailidou Z, et al. Hexose-6-phosphate dehydrogenase confers oxoreductase activity upon 11 beta-hydroxysteroid dehydrogenase type 1. J Mol Endocrinol. 2005;34:675–684. doi: 10.1677/jme.1.01718. [DOI] [PubMed] [Google Scholar]
- 31.Hosfield DJ, Wu Y, Skene RJ, et al. Conformational flexibility in crystal structures of human 11beta-hydroxysteroid dehydrogenase type I provide insights into glucocorticoid interconversion and enzyme regulation. J Biol Chem. 2005;280:4639–4648. doi: 10.1074/jbc.M411104200. [DOI] [PubMed] [Google Scholar]
- 32.Wake DJ, Homer NZ, Andrew R, Walker BR. Acute in vivo regulation of 11beta-hydroxysteroid dehydrogenase type 1 activity by insulin and intralipid infusions in humans. J Clin Endocrinol Metab. 2006;91:4682–4688. doi: 10.1210/jc.2006-0819. [DOI] [PubMed] [Google Scholar]
- 33.Fain JN, Madan AK, Hiler ML, Cheema P, Bahouth SW. Comparison of the release of adipokines by adipose tissue, adipose tissue matrix, and adipocytes from visceral and subcutaneous abdominal adipose tissues of obese humans. Endocrinology. 2004;145:2273–2282. doi: 10.1210/en.2003-1336. [DOI] [PubMed] [Google Scholar]
- 34.Fried SK, Bunkin DA, Greenberg AS. Omental and subcutaneous adipose tissues of obese subjects release interleukin-6: depot difference and regulation by glucocorticoid. J Clin Endocrinol Metab. 1998;83:847–850. doi: 10.1210/jcem.83.3.4660. [DOI] [PubMed] [Google Scholar]
- 35.Tomlinson JW, Moore J, Cooper MS, et al. Regulation of expression of 11beta-hydroxysteroid dehydrogenase type 1 in adipose tissue: tissue-specific induction by cytokines. Endocrinology. 2001;142:1982–1989. doi: 10.1210/endo.142.5.8168. [DOI] [PubMed] [Google Scholar]