Abstract
All cancers contain an admixture of rapidly and slowly proliferating cancer cells. This proliferative heterogeneity complicates the diagnosis and treatment of cancer patients because slow proliferators are hard to eradicate, can be difficult to detect, and may cause disease relapse sometimes years after apparently curative treatment. While clonal selection theory explains the presence and evolution of rapid proliferators within cancer cell populations, the circumstances and molecular details of how slow proliferators are produced is not well understood. Here, a β1-integrin/FAK/mTORC2/AKT1-associated signaling pathway is discovered that can be triggered for rapidly proliferating cancer cells to undergo asymmetric cell division and produce slowly proliferating AKT1low daughter cells. In addition, evidence indicates that the proliferative output of this signaling cascade involves a proteasome-dependent degradation process mediated by the E3 ubiquitin ligase TTC3. These findings reveal that proliferative heterogeneity within cancer cell populations, in part, is produced through a targetable signaling mechanism, with potential implications for understanding cancer progression, dormancy, and therapeutic resistance.
Introduction
In cell culture, dividing cancer cells usually produce two daughter cells that divide again in relative synchrony within a few hours of each other. Occasionally, however, a cancer cell divides to produce progeny that are asynchronous with respect to the next cell cycle, with one daughter cell having a markedly slower cell division time than the other, on the order of days. We recently found that this proliferative heterogeneity correlates with cancer cells asymmetrically suppressing AKT protein kinase levels by about ninety percent during mitosis just before cytokinesis (1). These rare asymmetries produce one AKTnormal daughter cell that rapidly enters the next cell cycle and another AKTlow cell that remains dormant for a more prolonged time before dividing again. Slowly cycling AKTlow cells reduce their production of reactive oxygen species (i.e., ROSlow), down-regulate proliferation proteins (e.g., MKI67low, MCM2low), suppress multiple nuclear histone marks similar to quiescent cell populations (e.g., H3K9me2low), and transcriptionally up-regulate the HES1 transcription factor that may mark exit from the cell cycle into G0 (i.e., HES1high) (1). Since AKTlow cells do eventually divide, converting to an AKTnormal proliferative phenotype over time, we tentatively have used the term “G0-like” to describe this temporary and reversible cell state. Significantly, we have also found AKTlow cancer cells within actual human breast tumors where they appear highly resistant to prolonged treatment with combination chemotherapy using adriamycin, cyclophosphamide, and paclitaxel, suggesting these these slow proliferators may constitute an important but unappreciated reservoir of treatment resistance in patients with breast cancer. We therefore reasoned that understanding more precisely how AKTlow cancer cells arise at a molecular level might provide fundamental insight into cancer biology with potential clinical relevance.
Materials & Methods
Cell culture
HCT116 colon and MCF7 breast were purchased from the American Type Culture Collection (ATCC) where they were authenticated. HCT116-AKT1/2−/− cells were purchased from Horizon Discovery (Cambridge, UK) where they were authenticated. MCF7 cells were maintained in DMEM, 10% FCS, 40mM glutamine, 100 U/mL penicillin, and 100 μg/mL streptomycin. HCT116 and HCT116-AKT1/2−/− cells were maintained in McCoy’s 5α medium supplemented with 10% FCS, 100 U/mL penicillin, and 100 μg/mL streptomycin. Cells were grown in a humidified atmosphere at 37°C and 5% CO2.
Generation of AKT1 mutant cell lines
pDD AKT1(WT) and pMSCV-puro-Ctag-mCherry were gifts from Joan Brugge (Harvard Medical School). AKT1(WT) cDNA was purified using PCR after cutting PDD AKT1(WT) with restriction enzymes BamHI and XhoI. Following purification, the product was ligated into pMSCVpuro-C-tag-mCherry cut with BglII and SalI. All the AKT1mutants were generated using the QuikChange site directed mutagenesis kit (Agilent technologies) and the product was ligated into pMSCVpuro- C-tag-mCherry. The resulting vector pMSCV-puro-AKT1-mCherry was sub-cloned into DH5α competent cells (Invitrogen). Sequencing verification of the fusion product was performed by the MGH DNA Core Facility with primers pMSCV 5’-CCCTTGAACCTCCTCGTTCGACC-3’ and pMSCV 3’-GAGACGTGCTACTTCCATTTGTC-5’. Virus carrying the desired fusion gene was produced by transfecting HEK 293T cells with target vector pMSCV-puro- AKT1-mCherry and packaging vector pCL-Ampho using the Mirus TransIT-293 transfection reagent and established protocols. Virus was collected 24 hours following transfection. Before infection, cells were plated in a 6-well plate in DMEM, 10% FCS. Infection was performed 24 hours later by adding 0.5 mL DMEM, 10% FCS, 0.5mL pooled virus, and 1μL 1,000× polybrene per well. A media change was performed the following day and cells were allowed to grow to confluency before splitting into a 10cm dish and selection with 2μM puromycin. Following selection, cells were allowed to grow to confluency before clones were selected using single-cell sorting (Becton Dickinson FACSAria II). Single cells were filtered by gating on the brightest 5% of cells in the PE Texas red channel and sorted into individual wells of a 96-well plate. Clones were harvested between 14 and 21 days.
Drug treatment in vitro
Cells were seeded onto collagen IV-coated coverslips, allowed to attach overnight, and treated with vehicle (DMSO) or AKT1/2 inhibitor (HCT116: 20μM; MCF7: 2μM) (Sigma), MK2206 (HCT116: 10μM; MCF7: 3μM) (Selleck Chemicals), TORIN1 (HCT116: 0.5μM; MCF7: 0.25μM) (Tocris Bioscience), AZD8055 (HCT116: 0.7μM; MCF7: 0.1μM) (Selleck Chemicals), INK128 (HCT116: 0.05μM; MCF7: 0.01μM) (Active Biochem), Palomid 529 (HCT116: 10μM; MCF7: 20μM) (Selleck Chemicals), (Rapamycin (HCT116: 20μM; MCF7: 20μM) (Sigma), RAD-001 (HCT116: 10μM; MCF7: 5μM) (Selleck Chemicals), BKM-120 (HCT116: 1.5μM; MCF7: 0.5μM) (Active Biochem), FAK inhibitors (PF-562271: 1μM (Pfizer) and NVP-TAE226 : 1μM (Novartis), for both cell lines) for 72 hours or 144 hours and Bortezemib (HCT116: 1μM; MCF7: 4μM) (Selleck Chemicals) MG-132 (vehicle: ethanol) (HCT116: 1μM; MCF7: 10μM), for 24 hours.
shRNA constructs
Human TRIPZ lentiviral inducible shRNAmirs for RICTOR (Clone ID: V2THS_120392, V2THS_120389, V2THS_38014, V2THS_225915), FAK (Clone ID: V2THS_57326, V2THS_325805), β1-integrin (Clone ID: V2THS_133469, V2THS_390997), non-silencing, and empty vector were purchased from Open Biosystems and virus was generated using a standard protocol. Infection was performed 24 hours later in MCF7 and HCT116 cells with the lentiviral particles followed by selection with 2μM puromycin. Following selection, cells were allowed to grow to confluency. The shRNAs were induced using 2μg/ml doxycycline for 72 hours. The TTC3 virus was purchased from Sigma-Aldrich and infected in HCT116 and MCF7 cells and the standard protocol for selection was followed.
Antibody activation & inhibition
Cells were incubated in media containing 10%FBS and the respective β1-integrin antibody: inhibiting (AIIB2:20μg/ml (Developmental Studies Hybridoma Bank), (P4C10: 10μg/ml (Millipore)) and activating (TS2/16 and 12G10: 10μg/ml) (Santacruz), for 1 hour at 4°C. Cells were then plated on collagen IV-coated coverslips (Sigma) and incubated in the antibody at 37°C, for 24 hours.
Immunofluorescence staining
Cells were grown directly on collagen IV-coated coverslips (Sigma). Cells were fixed in 3.7% formalin, permeabilized using 0.1% Triton X-100, and treated with 0.1% SDS. They were blocked in 1% BSA and then incubated with primary antibody (α-H3K9me2, α-Hes1 α-TTC3, and α-AKT(phospho-T308) (Abcam); α-MCM2, α-Tubulin, α-pan-AKT, and α-AKT(phospho-S473) (Cell Signaling), diluted in blocking solution, washed, and incubated with the respective secondary antibody. Cells were mounted using hard-set mounting media containing DAPI (Vector Laboratories). All secondary antibodies were Alexa Fluor conjugates (488, 555, 568, 633, and 647) (Invitrogen).
Collagen matrix studies
Slides coated with Type-I collagen (control) and AlignCol woven with large collagen fibers (100–200nm) (Advanced Biomatrix) were incubated for 1hour in 70% ethanol and then washed with PBS. Cells were then plated on the slides, incubated for twenty-four hours, and processed for immunofluorescence.
Confocal imaging
Immunofluorescence imaging was performed on a Nikon Eclipse Ti A1R-A1 confocal microscope. G0-like slow proliferators were specifically identified as cells in the bottom 10% of co-incident staining for MCM2, H3K9me2, and HES1. Cells were scored by counting G0-like versus other proliferating cancer cells among 10,000 cells from multiple fields of view at 20x magnification.
Western blotting & immunoprecipitation
We used standard protocols for SDS-PAGE electrophoresis and the following primary antibodies: α-RICTOR, α-mTOR, Phospho-AKT-Ser473 (D9E) (Cell Signaling) and α-RAPTOR, α-FAK, α-β1-integrin, α-TTC3, Pan-AKT and GAPDH (AbCam). For immunoprecipitation studies, cells were synchronized with 200 ng/mL of nocodazole for 12 hours and them released for 2 hours. Cells were rinsed with PBS, fixed with 0.37% formaldehyde and quenched with 0.25M glycine. Cell lysates were prepared in lysis buffer (1% Triton X-100, 150mM NaCl, 3mM MgCl, 40mM HEPES [pH 7.5], 50mM NaF, EDTA-Free protease inhibitor and phosphatase inhibitor [Roche]) and centrifuged at 14,000xg for 10 min. Supernatant (250 μg) was incubated with the indicated antibodies (α-FAK (AbCam), α-RICTOR (Santa Cruz)), for 4 hours at 4°C with rotation and then with 50 μL of a 50% slurry of protein G-sepharose (Roche) for 1 hour. Immunoprecipitates were washed and resolved by SDS-PAGE electrophoresis.
Results
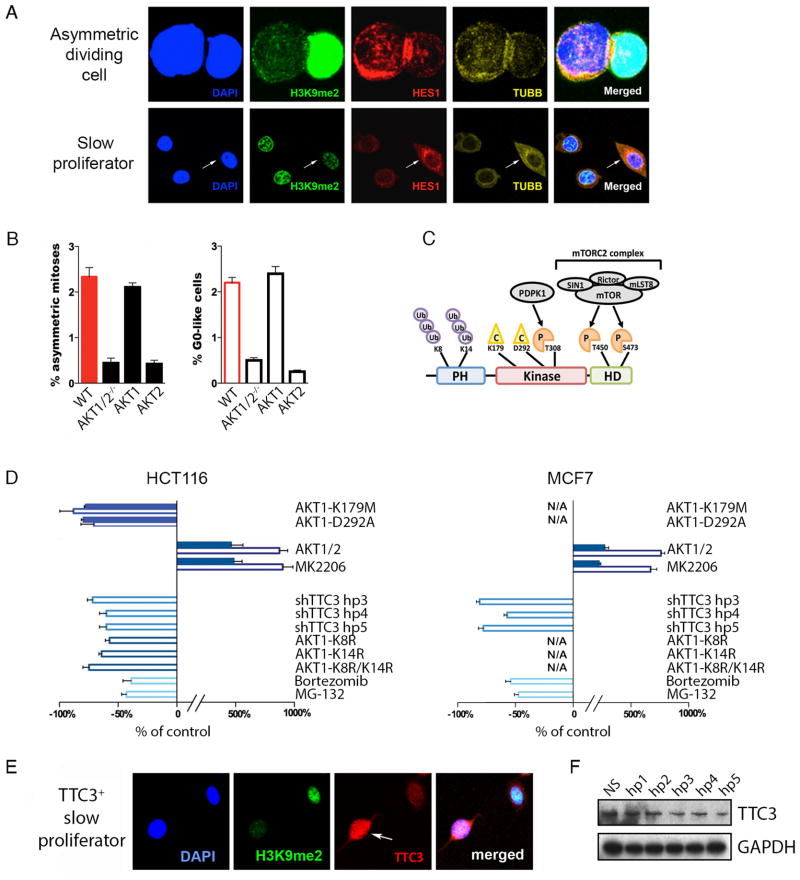
Since AKTlow cancer cells only partially suppress total AKT protein levels, we first asked whether asymmetric division occurs in the complete absence of all three AKT isoforms (i.e., AKT1, AKT2, and AKT3). To do so, we obtained HCT116 colorectal cancer cells with adeno-associated virus (AAV)-mediated disruption of the AKT1 and AKT2 gene loci (i.e., AKT1/2−/− cells) (2). Importantly, AKT1/2−/− cells do not express either AKT1 or AKT2, nor do they express AKT3, and thus survive and proliferate in the complete absence of AKT signaling, presumably through compensatory changes that arose during their initial selection. We used confocal microscopy to score AKT1/2−/− cell populations for rare, asymmetrically dividing and G0-like cancer cells that express the previously validated H3K9me2low / MCM2low / HES1high molecular profile, which specifically marks AKTlow slow proliferators as we had previously shown (Figure 1A) (1). Interestingly, this AKT1/2−/− line had virtually no asymmetrically dividing or G0-like cells compared to wild type HCT116 (the parental line from which AKT1/2−/− cells are derived) (Figure 1B). However, lentiviral-mediated overexpression of an AKT1 cDNA in AKT1/2−/− cells completely restored formation of both asymmetrically dividing and G0-like cells, while overexpression of AKT2 did not, suggesting that AKT1 is both necessary and sufficient for the production of G0-like cells (Figure 1B).
Figure 1. A mechanism for AKT1low slow proliferators: AKT1, TTC3, & proteasome.
(A) HCT116 cells stained for DAPI, H3K9me2, HES1 and TUBB. Merged image represents respective stains with underlying DAPI stain. Arrows indicate a GO-like cell. Bar = 10μm (B) Bar graph of percentages of H3K9me2low / MCM2low / HES1high asymmetric mitoses and GO-like cells in AKT1/2−/− HCT116 cells with cDNAs for AKT1 or AKT2 or AKT1-K179M or AKT1-D292A. (C) Schematic model of AKT1 protein with C=catalytic, P=phosphorylation, Ub=ubiquitination, PH=pleckstrin homology, HD=hydrophobic domain. (D) Graphical representation of percentage change in H3K9me2low/MCM2low/HES1high asymmetrically dividing and GO-like cells relative to control in HCT116 and MCF7 cell lines. Solid bars represent asymmetrically dividing and clear bars represent G0-like cancer cells. Error bars indicate mean ± SEM for 3 replicates. (E) MCF7 cells stained for DAPI, H3K9me2, and TTC3. Merged image represents respective stains with underlying DAPI stain. Arrow indicates a GO-like TTC3+ cell. Bar = 10μm (F) Western blot of short hairpin TTC3 knockdown.
Based on this result, we used site-directed mutagenesis to identify AKT1 domains that might be required for its partial suppression during asymmetric division. We created a series of AKT1 cDNA constructs with mutations in critical amino acids known to be important for various aspects of AKT1 signaling (Figure 1C). We then over-expressed each mutant AKT1 construct in AKT1/2−/− cells and scored these engineered cells for both asymmetrically dividing and G0-like cancer cells. We first asked whether AKT1 kinase activity was necessary for production of these slow proliferators. We found that AKT1-K179M (a commonly-studied mutation in the kinase pocket that renders AKT1 catalytically dead) failed to restore production of asymmetrically dividing and G0-like cells in the AKT1/2−/− line (Figure 1B). In addition, AKT1-D292A (a mutant hypomorph with diminished kinase catalytic activity) did so only weakly compared to wild-type AKT1 (Figure 1B) (3, 4). These results were consistent with AKT1 kinase activity being necessary for asymmetric division.
We previously noted that treating wild-type cancer cells with allosteric AKT inhibitors at low doses dramatically increases the frequency of both asymmetrically dividing and G0-like cells in HCT116 and MCF7 breast cancer cells (i.e., AKT1/2, MK2206) (Figure 1D) (1). These allosteric inhibitors are known to bind to the AKT1 pleckstrin homology domain, inducing conformational change and protein displacement from the cell membrane, thus promoting its ubiquitination and proteasome-mediated degradation (5). We therefore hypothesized that asymmetric division might depend on targeted degradation of AKT1 protein. TTC3 is a RING-type E3 protein-ligase known to ubiquitinate AKT1 at the lysine-8 and lysine-14 residues leading to its destruction by the proteasome (6). We found that G0-like cells from wild-type MCF7 express high levels of TTC3 protein compared to proliferating cells, consistent with a potential role for this E3 ligase in producing AKT1low cells (Figure 1E). In addition, inducible short hairpin RNA knockdown of TTC3 suppressed the frequency of G0-like cells in both wild-type HCT116 and MCF7 (Figure 1D,F). Furthermore, AKT1-K8R, AKT1-K14R, and AKT1-K8R/K14R double mutant proteins (which cannot be ubiquitinated by TTC3) failed to rescue the formation of G0-like cells in the AKT1/2−/− line (Figure 1D-left). Moreover, two different small molecules that inhibit proteasome function reduced the frequency of G0-like cells in both wild-type HCT116 and MCF7 when used at doses that do not affect overall cell proliferation (i.e., MG-132, Bortezomib) (Figure 1D). Overall, these results were consistent with enzymatically active AKT1 being ubiquitinated by TTC3 and degraded by the proteasome during cell division to produce slow proliferators.
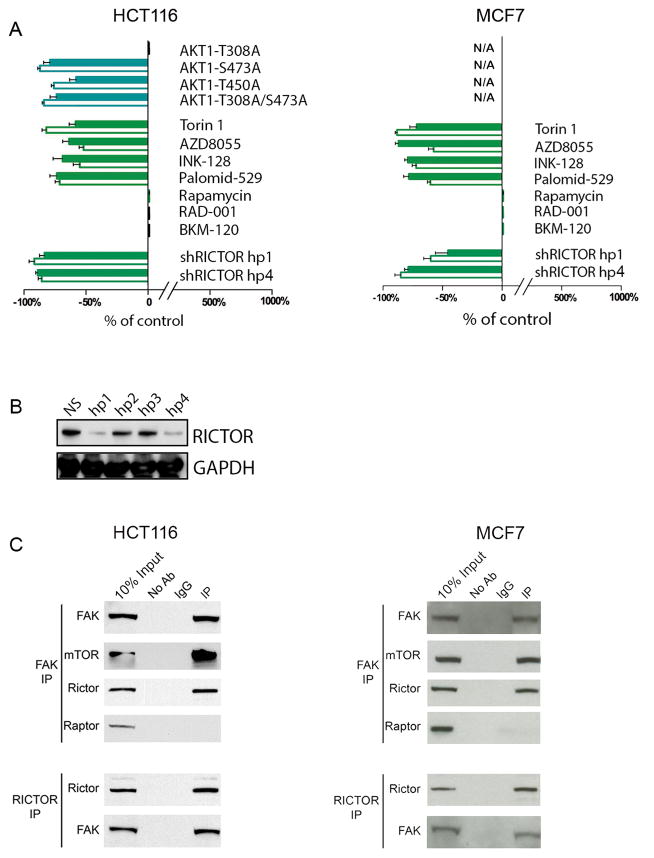
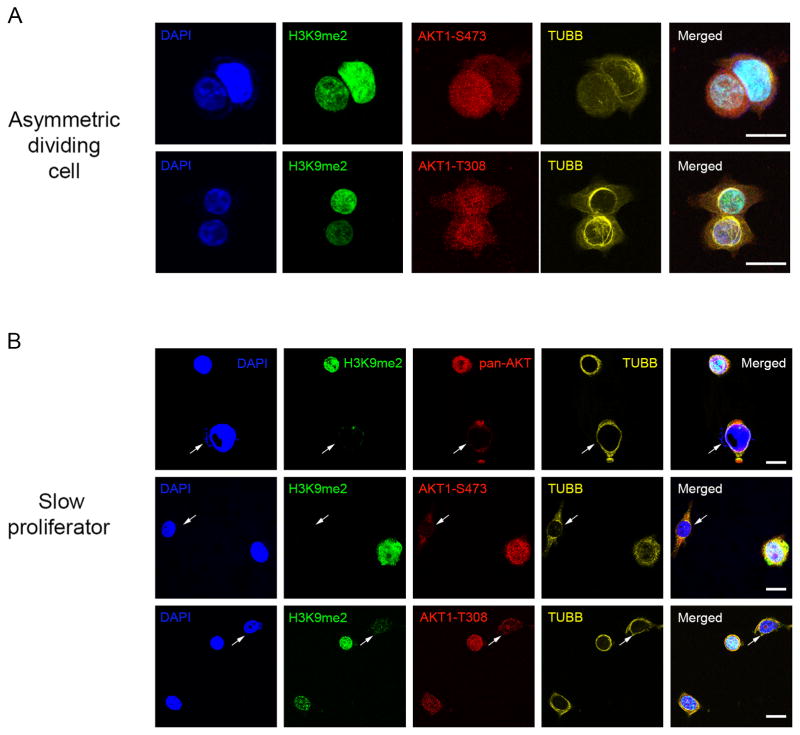
AKT1 is usually activated by two different upstream kinases: PDPK1 phosphorylates AKT1 at the T308 residue, while the mTORC2 kinase complex phosphorylates the AKT1-S473 and AKT1-T450 sites (7, 8). Similar to AKT1 cDNA, overexpression of the AKT1-T308A cDNA mutant (which cannot be phosphorylated by PDPK1) completely restored the production of asymmetrically dividing and G0-like cells in AKT1/2−/− cells (Figure 2A-left). In contrast, AKT1-S473A, AKT1-T450A, and an AKT1-T308A/AKT1-S473A double mutant (all of which cannot be phosphorylated by mTORC2) did not produce phenotypic rescue in these cells (Figure 2A-left). We also found that four structurally-different small molecules that inhibit both mTORC2 and mTORC1 signaling reduced the frequency of asymmetrically dividing and G0-like cells in both wild-type HCT116 and MCF7 cancer cells at low doses that did not appreciably inhibit cell proliferation (i.e., TORIN1, AZD8055, INK-128, Palomid-529) (Figure 2A). In contrast, the production of G0-like cells was not suppressed either by inhibitors that preferentially target the TORC1 signaling complex alone (i.e., Rapamycin, RAD-001) or by a pan-class I PI3 kinase inhibitor (i.e., BKM-120), when used at target-suppressing doses in these wild-type cells (Figure 2A). In addition, inducible shRNA knockdown of RICTOR (an obligate member of the mTORC2 signaling complex) suppressed the production of both asymmetrically dividing and slowly proliferating G0-like cells in both wild-type HCT116 and MCF7 (Figure 2A,B). We also found in asymmetrically dividing cells, that the slow proliferator daughter cells (i.e., H3K9me2low) were phospho-AKT1-S473high but phospho-AKT1-T308normal (Figure 3A). In contrast, after cytokinesis these slow proliferators (i.e., H3K9me2low) were AKTlow and commensurately phospho-AKT1-S473low and phospho-AKT1-T308low (Figure 3B) (1). In aggregate, these results supported a dynamic model whereby differential phosphorylation of AKT1 by mTORC2 may precede the production of slow proliferators with low levels of AKT1 protein.
Figure 2. A mechanism for AKT1low slow proliferators: FAK, mTORC2, & AKT1.
(A) Graphical representation of percentage change in H3K9me2low/MCM2low/HES1high asymmetrically dividing and GO-like cells relative to control in HCT116 and MCF7 cell lines. Solid bars represent asymmetrically dividing and clear bars represent G0-like cancer cells. Error bars indicate mean ± SEM for 3 replicates. (B) Western blot of short hairpin RICTOR knockdown. (C) HCT116 and MCF7 cells in M-phase of cell cycle, FAK IP with anti-FAK and immunoblotted with anti-FAK, anti-mTOR, anti-RICTOR and anti-RAPTOR antibody. Reciprocally, RICTOR IP with anti-RICTOR and immunoblotted with anti-RICTOR or anti-FAK antibody.
Figure 3. A mechanism for AKT1low slow proliferators: phospho-AKT1.
(A,B) MCF7 cells stained for DAPI, H3K9me2, TUBB, and phospho-AKT1-S473, phospho-AKT1-T308, or pan-AKT. Merged image represent respective stains with underlying DAPI stain. Arrows indicate a GO-like cell. Bar = 10μm.
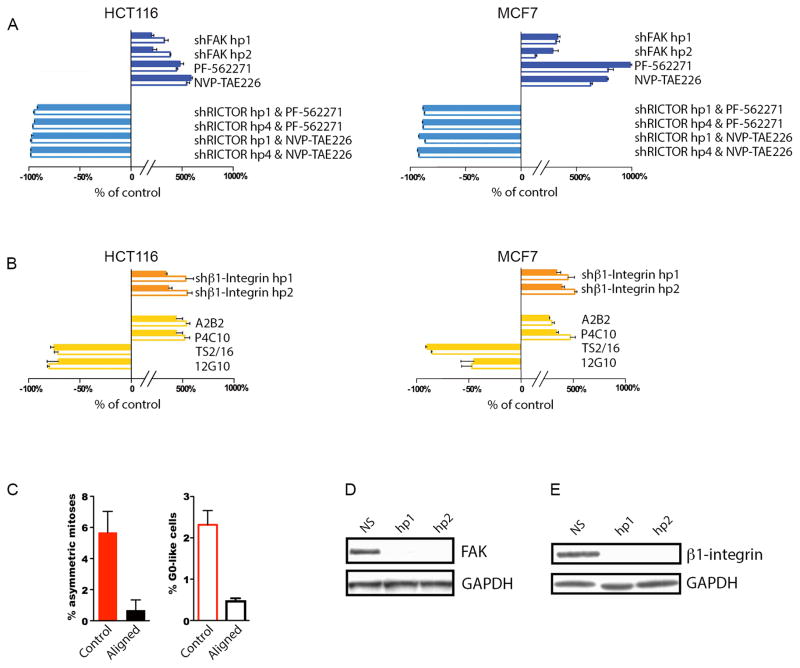
In order to identify an upstream regulator that might activate mTORC2 signaling during asymmetric division, we next used an immunoprecipitation (IP) approach to identify proteins that physically interact with the mTORC2 complex during mitosis. We first treated HCT116 and MCF7 cells with nocodazole, in order to synchronize cells in metaphase, and then prepared whole cell protein lysates two hours after release of this synchronization with the cells still in mitosis. We found that IP with a RICTOR antibody (under conditions that maintain integrity of the mTORC2 complex in whole cell lysates) pulled down focal adhesion kinase (FAK) protein in both HCT116 and MCF7. Reciprocally, IP with a FAK antibody pulled down both mTOR kinase and RICTOR, but not RAPTOR (an obligate member of the related mTORC1 complex), confirming the specific interaction of FAK with mTORC2 complex in these cells (Figure 2C). This observation suggested that FAK activity might regulate mTORC2-associated AKT1 degradation and asymmetric cancer cell division. Furthermore, inducible shRNA knockdown of FAK increased both asymmetrically dividing and G0-like cells in HCT116 and MCF7 (Figure 4A,D). Similarly, inhibiting FAK enzymatic activity with two different small molecules increased the frequency of both asymmetrically dividing and G0-like cells (i.e., PF-562271, NVP-TAE226) (Figure 4A). However, FAK inhibitors failed to increase asymmetries or slow proliferators after RICTOR knockdown (Figure 4A). These findings were consistent with a model whereby a loss of FAK activity might induce mTORC2-mediated asymmetric cancer cell division.
Figure 4. A mechanism for AKT1low slow proliferators: β1-integrin & FAK.
(A,B) Graphical representation of percentage change in H3K9me2low/MCM2low/HES1high asymmetrically dividing and GO-like cells relative to control in HCT116 and MCF7 cell lines. Solid bars represent asymmetrically dividing and clear bars represent G0-like cancer cells. Error bars indicate mean ± SEM for 3 replicates. (C) Bar graph of percentages of H3K9me2low / MCM2low / HES1high asymmetric mitoses and GO-like cells in MCF7 cells plated on control (random) or aligned Type-I collagen fibrils (aligned). (D,E) Western blots of short hairpin FAK and β1-integrin knockdown in HCT116 cells with non-silencing shRNA (NS) as control.
Integrins are a family of heterodimeric transmembrane receptors that transduce signals from the extracellular matrix, by activating signaling intermediaries including FAK, to increase the cell cycle, survival, and motility of cancer and normal cells (9). We therefore reasoned that decreased integrin signaling might be the proximate cause for a loss in FAK activity resulting in asymmetric mitosis. In fact, shRNA knockdown of β1-integrin (i.e., ITGB1) increased the fraction of asymmetrically dividing and G0-like cells in both HCT116 and MCF7 (Figure 4B,E). In addition, blocking β1-integrin function with two different monoclonal antibodies also increased both asymmetrically dividing and G0-like cells (i.e., A2B2, P4C10) (Figure 4B) (10). However, activating β1-integrin signaling with two other monoclonal antibodies, which force β1-integrin into a constitutive “on” state by imposing a conformational change, eliminated both asymmetries and slow proliferators in these cell lines (i.e., TS2/16, 12G10) (Figure 4B) (10).
These observations suggested that the asymmetric cancer cell divisions might result from random variation in β1-integrin signaling related to extracellular irregularities within cell culture. We therefore grew cancer cells on engineered matrices displaying Type-I collagen (a major extracellular matrix protein that activates β1-integrin) closely aligned in a regular fibrillar pattern, in order to assure uniform β1-integrin activation in any cancer cell undergoing mitosis (11). Notably, cancer cells proliferating in this structured collagen matrix did not produce asymmetries or G0-like cells, in contrast with typical cell culture (Figure 4C). In the aggregate, our results were consistent with loss in β1-integrin signaling during mitosis (likely resulting from random irregularity in extracellular Type-I collagen) triggering a conserved pathway to produce slow proliferators in vitro.
Discussion
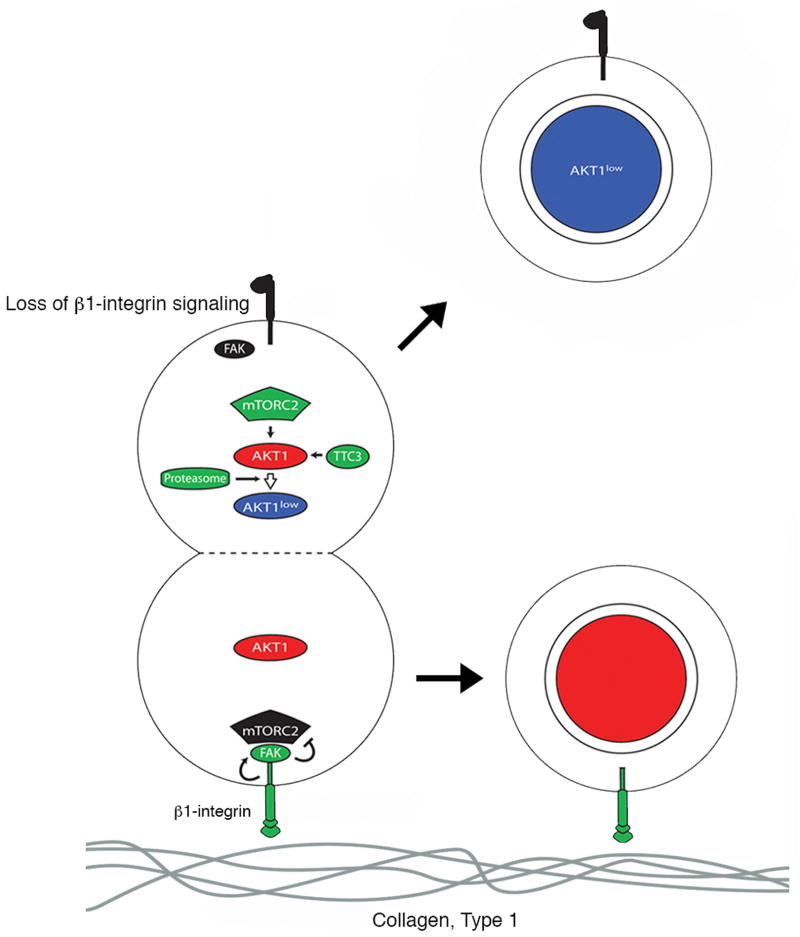
The proliferative heterogeneity among cancer cells within tumors generally correlates with differences in growth, response to treatment, and disease relapse in cancer patients (12). Despite recent progress, however, we do not understand clearly how this heterogeneity is generated in the first place. We previously discovered that cancer cells occasionally divide asymmetrically to spawn AKTlow, MCM2low, H3K9me2low, HES1high progeny that proliferate slowly and are resistant to cytotoxic chemotherapy in cell culture (~1% of cell divisions) (1). We also demonstrated the existence of these AKTlow cancer cells within actual human breast tumors where they appear to survive intensive, combination chemotherapy, suggesting that these cells may mediate clinically important chemo-resistance (1). In our current work, we reveal a signaling pathway that is triggered in dividing cancer cells to spawn these slow proliferators in vitro. This pathway involves a decrease in β1-integrin / FAK activity, activation of the mTORC2 complex, and suppression of AKT1 protein levels through TTC3 / proteasome-mediated degradation.
Interestingly, any dividing cancer cell appears capable of triggering the β1-integrin pathway that we describe to produce AKT1low slow proliferators. This facultative behavior presumably occurs if dividing cancer cells encounter irregularities in extracellular Type I collagen, although additional cooperative factors yet to be discovered may also be required. Moreover, we find that activation of β1-integrin signaling with monoclonal antibodies or inhibition of mTORC2 signaling with small molecules reduces asymmetric cancer cell division and the production of these slow proliferators. Our findings might therefore suggest potentially new avenues for experimentally or therapeutically manipulating and studying the production of AKT1low slow proliferators both in vitro and in vivo.
These results also offer potentially useful molecular insight into different signaling molecules that are under intensive investigation as therapeutic targets for various cancer types, which may carry implications for the development and use of clinical inhibitors that target these important molecules. For example, the MCF7 and HCT116 cancer cells we study have activating mutations in PIK3CA, and are thus dependent on constitutive PI3K / AKT signaling for their proliferation and survival. Despite this dependency, however, we find that these ER+ breast and colorectal cancers retain the β1-integrin pathway that we describe to produce AKT1low slow proliferators. This suggests that cancer cells may actually derive some indispensible advantage from suppressing AKT1 to produce slow proliferators in this way, although further work will determine whether our findings extend to additional molecular subtypes of cancer. Additionally, we find that a quantitative reduction in β1-integrin, FAK, or AKT1 (rather than AKT2/3) signaling in cancer cells produces this reversible cell cycle arrest through a conserved pathway, compared to complete suppression of these targets that generally results in cell death or senescence. Our results also suggest that FAK may physically interact with and functionally suppress the mTORC2-signaling complex during cell division, which we believe is not generally appreciated. Moreover, while mTORC2 activity is normally required for AKT1 activation, we find that this multi-functional signaling complex is also necessary for triggering AKT1 degradation during asymmetric cancer cell division, although additional experiments will be necessary to understand exactly how this happens (8). Finally, we find that TTC3-mediated proteasome degradation of AKT1 is necessary for the production of AKT1low slow proliferators, although we do not yet understand precisely how the expression and activity of this E3-ubiquiting ligase and the proteasome is regulated during asymmetric mitosis. Deeper insight into these molecular interactions, the precise cellular contexts in which they occur, and why cancer cells retain this functional pathway for producing slow proliferators may thus provide further useful insight into cancer biology.
Figure 5. Visual overview.
A proposed mechanism for producing slowly proliferating cancer cells.
Implications.
These findings provide a deeper understanding of the proliferative heterogeneity that exists in the tumor environment and highlight the importance of designing future therapies against multiple proliferative contexts.
Acknowledgments
This work is supported by awards from the National Cancer Institute, Howard Hughes Medical Institute (Physician-Scientist Early Career Award), Susan G. Komen for the Cure, and Prostate Cancer Foundation (SR). SR is supported by a Stand Up to Cancer Innovative Research Grant (SU2C-AACR-IRG0911). Stand Up To Cancer is a program of the Entertainment Industry Foundation administered by the American Association for Cancer Research. CPA is supported by an award from CNPq “Ciência sem Fronteiras” – Brazil (202620/2012-3). ACY was supported by an HHMI Medical Student Research Fellowship (2010–2012). XS is supported by a “Bolsa de Ampliación de Estudios, Instituto de Salud Carlos III, Ministerio de Economía y Competitividad (BA12/00021)” – Spanish postdoctoral fellowship award. We thank Jim DeCaprio, Richard Hynes, Bill Sellers, and Bob Weinberg for helpful discussions.
Footnotes
Conflict of Interest: None
References
- 1.Dey-Guha I, Wolfer A, Yeh AC, Albeck JG, Darp R, Leon E, et al. Asymmetric cancer cell division regulated by AKT. Proceedings of the National Academy of Sciences of the United States of America. 2011;108(31):12845–50. doi: 10.1073/pnas.1109632108. Epub 2011/07/16. [DOI] [PMC free article] [PubMed] [Google Scholar]
- 2.Ericson K, Gan C, Cheong I, Rago C, Samuels Y, Velculescu VE, et al. Genetic inactivation of AKT1, AKT2, and PDPK1 in human colorectal cancer cells clarifies their roles in tumor growth regulation. Proceedings of the National Academy of Sciences of the United States of America. 2010;107(6):2598–603. doi: 10.1073/pnas.0914018107. Epub 2010/02/06. [DOI] [PMC free article] [PubMed] [Google Scholar]
- 3.Okuzumi T, Fiedler D, Zhang C, Gray DC, Aizenstein B, Hoffman R, et al. Inhibitor hijacking of Akt activation. Nature chemical biology. 2009;5(7):484–93. doi: 10.1038/nchembio.183. Epub 2009/05/26. [DOI] [PMC free article] [PubMed] [Google Scholar]
- 4.Aoki M, Batista O, Bellacosa A, Tsichlis P, Vogt PK. The akt kinase: molecular determinants of oncogenicity. Proceedings of the National Academy of Sciences of the United States of America. 1998;95(25):14950–5. doi: 10.1073/pnas.95.25.14950. [DOI] [PMC free article] [PubMed] [Google Scholar]
- 5.Jo H, Mondal S, Tan D, Nagata E, Takizawa S, Sharma AK, et al. Small molecule-induced cytosolic activation of protein kinase Akt rescues ischemia-elicited neuronal death. Proceedings of the National Academy of Sciences of the United States of America. 2012;109(26):10581–6. doi: 10.1073/pnas.1202810109. Epub 2012/06/13. [DOI] [PMC free article] [PubMed] [Google Scholar]
- 6.Suizu F, Hiramuki Y, Okumura F, Matsuda M, Okumura AJ, Hirata N, et al. The E3 ligase TTC3 facilitates ubiquitination and degradation of phosphorylated Akt. Developmental cell. 2009;17(6):800–10. doi: 10.1016/j.devcel.2009.09.007. Epub 2010/01/12. [DOI] [PubMed] [Google Scholar]
- 7.Sarbassov DD, Guertin DA, Ali SM, Sabatini DM. Phosphorylation and regulation of Akt/PKB by the rictor-mTOR complex. Science. 2005;307(5712):1098–101. doi: 10.1126/science.1106148. Epub 2005/02/19. [DOI] [PubMed] [Google Scholar]
- 8.Manning BD, Cantley LC. AKT/PKB signaling: navigating downstream. Cell. 2007;129(7):1261–74. doi: 10.1016/j.cell.2007.06.009. Epub 2007/07/03. [DOI] [PMC free article] [PubMed] [Google Scholar]
- 9.Hynes RO. Integrins: bidirectional, allosteric signaling machines. Cell. 2002;110(6):673–87. doi: 10.1016/s0092-8674(02)00971-6. Epub 2002/09/26. [DOI] [PubMed] [Google Scholar]
- 10.Byron A, Humphries JD, Askari JA, Craig SE, Mould AP, Humphries MJ. Anti-integrin monoclonal antibodies. Journal of cell science. 2009;122(Pt 22):4009–11. doi: 10.1242/jcs.056770. Epub 2009/11/17. [DOI] [PMC free article] [PubMed] [Google Scholar]
- 11.Bessea L, Coulomb B, Lebreton-Decoster C, Giraud-Guille MM. Production of ordered collagen matrices for three-dimensional cell culture. Biomaterials. 2002;23(1):27–36. doi: 10.1016/s0142-9612(01)00075-8. Epub 2002/01/05. [DOI] [PubMed] [Google Scholar]
- 12.Hong WK American Association for Cancer Research. Holland Frei cancer medicine. 8. Vol. 8. Shelton, Conn: People's Medical Pub. House; 2010. p. xxv.p. 2,021. [Google Scholar]


