

Abstract
We investigated the cytoarchitecture of the anterior superior temporal area (TA2) of the postmortem cerebral cortex in 9 subjects with autism and 9 age-matched typically developing subjects between the ages of 13 and 56 years. The superior temporal gyrus is involved in auditory processing and social cognition and its pathology has been correlated with autism. We quantified the number and soma volume of pyramidal neurons in the supragranular layers and pyramidal neurons in the infragranular layers in each subject. We did not find significant differences in the number or volume of supragranular or infragranular neurons in the cerebral cortex of subjects with autism compared to typically developing subjects. This report does not support an alteration of supragranular to infragranular neurons in autism. However, further stereological analysis of the number of cells and cell volumes in specific cortical areas is needed to better establish the cellular phenotype of the autistic cerebral cortex and to understand its clinical relevance in autism.
Keywords: Autism, pyramidal neurons, superior temporal cortex, postmortem, human
Introduction
Autism is a neurodevelopmental disorder defined by abnormalities in social interaction, communication, and repetitive interest (DSM-V). Autism symptoms cover a wide spectrum, ranging from individuals with severe impairments to high functioning individuals. MRI studies have shown increased brain volume in 20% of children with autism [1–3] that is localized to specific areas, such as frontal cortex [3,4]. Postmortem studies of autistic brains have also revealed abnormalities in cellular number and morphology in some brain areas including the cerebral cortex, amygdala, cerebellum, and brainstem [5–7]. An alteration in the number of cortical cell subtypes or in the soma volume of neurons in specific layers of the cortex would likely alter the pattern of connections between cortical areas and could produce disturbances in cognitive functioning similar to those seen in autism. A full understanding of the cellular basis of autism in the human brain is essential for establishing underlying mechanisms that in turn could yield new therapeutic interventions.
The superior temporal gyrus (STG) is involved in auditory processing, language, and social cognition such as in the perception of emotions in facial stimuli [8,9]. Alterations in the STG such as changes in total cell volume have been widely linked to autism [8,10,11]. Supragranular layers II and III are the major source of corticocortical projections and also receive sensory information, whereas the infragranular layers V and VI are the output to subcortical structures involved in behavior [12]. We carried out a quantification of the number and volume of supragranular (layers, II–III) and infragranular (V–VI) pyramidal neurons in the autistic and typically developing human anterior superior temporal area (TA2) located within the STG.
Material and Methods
Subjects
Postmortem tissue used in this project was approved by Autism Speaks and the UC Davis Institutional Review Board. Consent was obtained in writing by patients or their next of kin and confirmed at time of death. Tissue from 18 postmortem human brains were used for this study (9 autistic and 9 control blocks). The brain samples were obtained from the Autism Tissue Program. The autistic cases included in our study were all diagnosed as autism. The diagnosis of autism was confirmed by standard postmortem use of the Autism Diagnostic Interview-Revised (ADI-R) in all cases. The control cases were determined to be free of neurological disorders, including autism, based on medical records and information gathered at the time of death from next of kin. Cases were all males. Age, hemisphere, brain weight, severity of symptoms, and fixation time varied from case to case (see Sup. table 1). Cases were age-matched. Autistic cases were an average of 28.7 years old ranging from 13 to 56, and control cases were an average of 27.3 years old ranging from 14 to 45. One of the subjects with autism suffered from epilepsy, one was suspected to had one seizure, and one suffered from schizophrenia. Control patients did not have a history of seizures, mental retardation, or dementia. Notice that this study shares many of its cases with previous work from our group and other investigators [7,13].
Neuropathology
All sections were examined microscopically by a board certified neuropathologist in a blind manner and the microscopic findings were later compared with the clinical history, gross brain images and MRI images provided by the Autism Tissue Program. There were no abnormalities, except for minute meningioma (0.4 × 0.3 cm) in the temporal lobe of one case patient (32 y/o control case), an incidental finding of no clinical significance.
Tissue processing
After removal of the brain from the skull, brain tissue was immersed in 10% buffered formalin for at least 8 weeks. A 4 cm block of temporal cortex containing the entire rostrocaudal extent of the amygdala was cut from one hemisphere, placed into a cryoprotectant solution in preparation for freezing. The tissue blocks were frozen with 2-methyl butane (isopentane) and 100 μm thick coronal sections were performed. One of every nine sections were stained with cresyl violet (Nissl).
Nissl Staining
Nissl staining was performed following a standard protocol [13]. Neurons in Nissl stained tissue were identified by the presence of dendritic processes, cresyl violet-positive cytoplasm within the soma, a nucleolus, and euchromatin material within the nucleus. Pyramidal neurons were characterized by a large soma, a big nucleus, and an apical dendrite directed toward the pia. It important to note that the plane of tissue sectioning may affect the ability to accurately identify apical dendrites. It has been previously suggested that the orientation of apical dendrites of pyramidal neurons is altered in autism, however we did not observe any abnormally oriented pyramidal cells in the tissue included in this study. However, cells that did not meet all of the three criteria noted above were not included in our analysis. We estimated that less that 0.1% of pyramidal neurons where excluded from quantification due to the plane of section limitation.
Regional definition
We obtained tissue blocks containing the middle third of the temporal lobe. The cortical area analyzed, located in the lower wall of the superior temporal lobe, was the anterior superior temporal area (TA2 of von Economo) or rostral Brodmann’s Area (BA) 22. To consistently analyze the same cortical area within the temporal cortex in each case, we established rostral, caudal, dorsal and ventral boundaries for our area of interest. To delineate these boundaries, we followed anatomical and cytoarchitectonic criteria. TA2 is characterized by a thick layer I, and a thin and cell sparse layer II. Layer III is thick and possesses medium-sized pyramidal cells distributed uniformly throughout the layer. Layer IV is relatively thin and comprises small pyramidal neurons grouped together in small vertical columns. Layer V is thick and contains medium-sized pyramidal cells. Layer VI is subdivided in two sub-laminas that exhibit different concentrations of fusiform cells. We established the ventro-medial boundary of our area of interest as the transition area between TA2 and the middle temporal area proper (TE1) – located in the MTG – that can be delineated based on the thickness of infragranular layers, with layers V and VI of TE1 being much thicker than those of TA2. In addition, pyramidal cells are bigger in layer III of TE1 than in TA2. We established the dorsocaudal boundary of our area of interest as the transition region located between TA2 and the magnocellular supratemporal area simplex (TB) partially located on the dorsal surface of the STG within the Sylvian fissure. TB can be distinguished from TA2 by the presence of large cells in sublayer IIIc with the appearance of giant cells, while neighboring areas have medium-sized cells. In addition, the PT has a more dispersed and loosely arranged layers I and IV relative to that in TB. The rostral boundary of our area of interest was the transition area between the TA2 and the temporopolar area (TG). Areal delineations depend on autism cases having normal layer appearance, thickness, normal cell volume and appearance. Therefore, some variability may be introduced if these variables are affected in autism.
Cell quantification
The optical fractionator and nucleator probes were used on an Olympus microscope with StereoInvestigator software (MicroBrightField) to defined a systematic-random sampling sequence of counting frames and grids in 100 μm sections within each area analyzed. A section sampling interval of ten was examined. The neuroanatomical regions including layers II–III and V–VI were defined at low magnification with a 2× objective. The optical fractionator probe was run within the selected neuroanatomical region with a 100× oil objective. The population estimate was used to determine the section sampling fraction (0.09), the area sampling fraction was (8.2), and the height sampling fraction (0.66) necessary to reach a coefficient of error equal or less than 0.008 [14]. To prevent sampling bias, post-processing tissue thickness was measured at each sampling site. Cells were counted if the cellular nucleolus was into focus within the dissector counting frame. The nucleator probe was implemented during the optical fractionator allowing for simultaneous cell number and cell volume estimates. The nucleolus was selected as the midpoint of the cell and the distance from the midpoint to the soma margin was used to calculate soma volume. For stereological parameters go to supplemental table 2.
Imaging
Imaging was performed on an Olympus BX61 microscope with a Hamamatsu Camera interfaced with a Dell Preision PWS 690, Intel Xeon CPU Computer with Microsoft Windows XP Professional V.2002 running MBF Bioscience StereoInvestigator V.9 Software (MicroBrightField, Williston, VT).
Statistics
The number and volume of pyramidal neurons was compared between brains from control and autistic age-matched subjects using paired t-test (GraphPad Prism software). A p value of 0.05 was used for statistical significance.
Results
We compared number and soma volume of pyramidal neurons in the supragranular layers and pyramidal neurons in the infragranular layers of TA2 in autistic brains compared to control (Figure 1).
Fig. 1.

A. Consecutive 100 μm sections of the post-mortem brain from a subject with autism. Each section is separated by 1,500 μm. The black line indicates the limit of the area of study. The arrow indicates the superior temporal sulcus. B. Representative image of the cortical area of interest. Scale bar = A. 2 mm; B = 200 μm.
We analyzed samples obtained from 9 brains of subjects with autism and from 9 brains from control subjects, whose ages ranged from 13 to 56 years (Sup. table 4). We classified cell types based on cellular morphology in Nissl stained tissue and performed quantification using the optical fractionator and the nucleator (Figure 2).
Fig. 2.
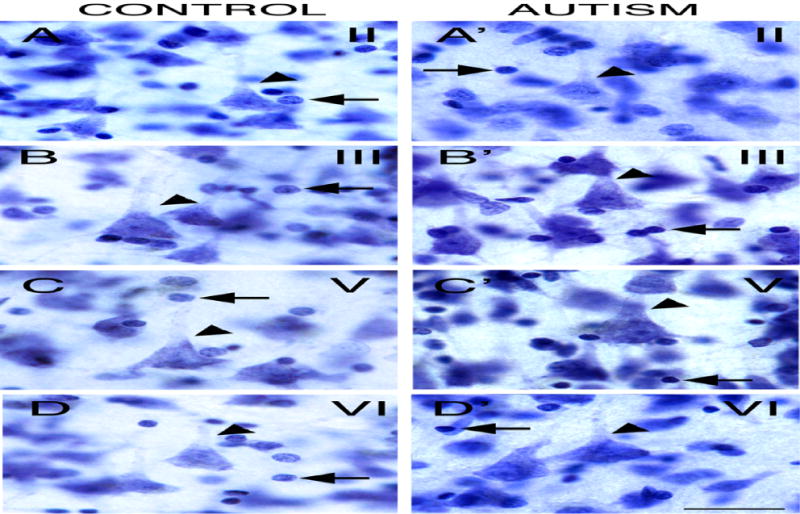
Nissl stained sections from a subject with autism. Representative pyramidal neurons are shown in layers II (A), III (B), V (C), and VI (D). Pyramidal neurons possessed a large pyramidal-shaped soma, a large nucleus, and an apical dendrite directed toward the pia (arrowhead). Notice nuclei of glial cells with absence of cytoplasmic staining and nucleolus (arrow). Scale bar: 25 μm.
The number of supragranular pyramidal neurons in layer II–III within TA2 was 4,759,737.4 ± 2,105,467.2 (s.d.) in control subjects versus 5,295,067.0 ± 2,238,309.4 in subjects with autism. The number of infragranular pyramidal neurons in layer V–VI within our area of interest in TA2 was 5,070,925.4 ± 1,678,678.4 in control subjects versus 5,071,869.3. ± 2,351,919.9 in subjects with autism. There was no statistically significant difference in the number of supragranular pyramidal neurons in layers II–III (p=0.6), nor in the number of infragranular pyramidal neurons in layers V–VI in TA2 of autistic versus control subjects (p=1.0). We also compared the ratio of the number of supragranular to infragranular pyramidal neurons within our area of interest in control (0.91 ± 0.06) versus autism (1.08 ± 0.09), but found no differences between groups (p = 0.1).
The volume of supragranular pyramidal neurons in layer II–III within the area of interest in TA2 was 2411.92 ± 307.89 μm3 (s.d.) in control subjects versus 2124.92 ± 722.28 in subjects with autism. The volume of infragranular pyramidal neurons in layer V–VI of the STG was 2597.43 ± 317.78 in control subjects versus 2591.14 ± 772.54 in subjects with autism. There was no statistically significant difference in the volume of supragranular pyramidal neurons in layers II–III (p=0.38) nor in the volume of infragranular pyramidal neurons in layers V–VI within our area of interest in TA2 in autistic versus control subjects (p=0.65). We compared the ratio of the volume of supragranular to infragranular pyramidal neurons in control (0.92 ± 0.03) versus autism (0.83 ± 0.10) and found no difference between groups (p = 0.17).
To test if there was an age effect on cortical structure, we divided our cases into two groups: adolescents (13 to 15 years old), and adults (20 years and older). We performed statistical analysis to compare the data from autistic and control cases within each age group and found no significant differences on any measure. We also repeated statistical analyses that excluded those cases with epilepsy or schizophrenia, but again did not find significant differences for any of our measures in the anterior superior temporal cortex. We did not find a correlation between cell number and brain weight.
In summary, we did not find any difference in the number, soma volume, nor ratio of number or volume of supragranular to infragranular pyramidal neurons within the TA2 of autistic versus control subjects (Figure 3, Sup. table 3). For individualized data see supplemental tables 4 to 6.
Fig. 3.
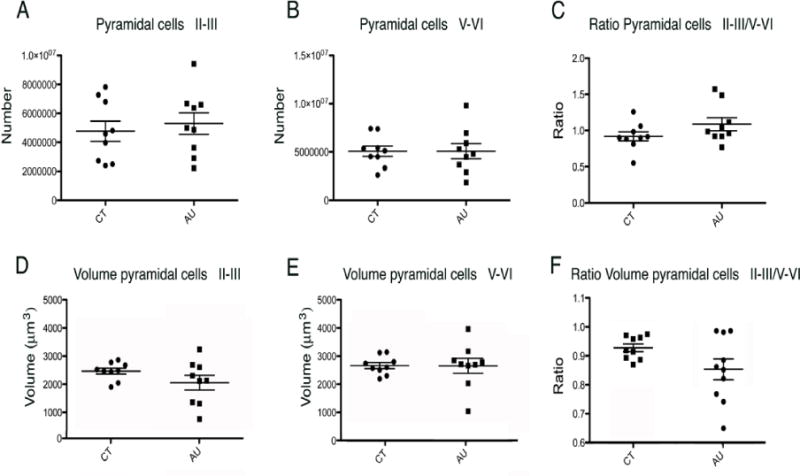
Analysis of the STG in autistic versus typically developing subjects showed that there was not a statistically significant difference in: (A) The number of supragranular pyramidal neurons in layers II–III; (B) The number of infragranular pyramidal neurons in layers V–VI; (C) The ratio of the number of short-projection supragranular pyramidal neurons to infragranular pyramidal neurons; (D) The volume of supragranular pyramidal neurons in layer II–III; (E) The volume of infragranular pyramidal neurons in layer V–VI; or (F) The ratio of the volume of supragranular to infragranular pyramidal neurons.
Discussion
Previous data on cell density and cell number in the cerebral cortex of autistic brains are not in agreement. Some authors have reported unchanged neuronal number and density [15–20], while others have found significant reductions in neuronal density [21], or increased neuronal number [6] in various regions of the prefrontal cerebral cortex and other cortical regions. In addition, some authors have suggested autism might involve neuron loss and on-going pruning with age across adolescence and adulthood [22]. In this study, we did not find significant differences in total number or ratio of supragranular versus infragranular pyramidal neurons in the area of interest within TA2 of autistic and control subjects.
The heterogeneity in findings from these studies may result from a variety of factors including differences in quantification methodologies, sample volumes, cortical area analyzed, variability in the diagnosis of each case, age of subjects, as well as the quality of the tissue. For example, our cases included both adolescent and adult cases, but not children. In contrast, Courchesne and colleagues included children and adolescents but not adults [6]. In this study, the mean age of subjects was 27 years, so our results may not reflect active pathological processes, but rather the result of developmental neuropatholgy. The substantial variability in cortical areas across subjects and even between cortical areas within the same brain can potentially impact results. In addition, neocortical pathology in autism is enormously variable, with very clear regional, laminar, and cellular vulnerabilities, and not all regions are equally susceptible. Also, cases with comorbidities are included in this and other studies. For example, in our study one case was diagnosed with Neuroleptic Syndrome and another case was suspected to have suffered a seizure. These comorbidities could potentially impact cell number in the cortex and could therefore confound interpretations.
Published data on the volume of neuronal soma in autism also varies. Some studies that compared neuronal volumes in postmortem tissue have reported unchanged neuronal volume [6,19], while others have found significantly reduced neuronal volume in subjects with autism compared to controls. For example, Jacot-Descombes and colleagues observed significantly smaller pyramidal neurons in Brodmann areas 44 and 45 of patients with autism compared to controls [17]. Courchesne and colleagues reported that there were no significant differences in dorsolateral prefrontal cortex or medial prefrontal cortex neuronal volumes between autistic and control groups [6]. Previous research has also suggested Purkinje cell atrophy [23], significant decreases in cell volume in the cingulate cortex [24], and smaller neurons in the hippocampus of autistic subjects compared to control subjects [25]. In addition to autism, changes in neuronal volume has also been correlated with several neurological and neurodegenerative diseases including Huntington’s disease, schizophrenia, major depressive disorder, bipolar disorder, Alzheimer’s disease, and Parkinson’s disease [26–33]. We did not find significant differences in volume or the ratio of the volume of supragranular versus infragranular pyramidal neurons in TA2 of autistic and control subjects. The contrasting findings highlight the need for systematic studies of cellular neuroanatomy in the autistic brain.
In this study we did not find alterations in the total number of or ratio of supragranular to infragranular neurons, suggesting that an alteration in the number of pyramidal neurons in the anterior superior temporal area may not contribute to altered white matter thickness. Other potential causes for altered white matter thickness include an altered number of oligodendrocytes or myelination. Our data does not support an alteration of supragranular to infragranular neurons in autism. However, unchanged numbers of neocortical cells does not exclude the possibility of altered neuronal function in the brains of autistic subjects since nearly limitless factors impact cellular function in the adult brain.
Conclusion
In summary, we did not find significant differences in the total number or volume of supragranular and infragranular pyramidal neurons in TA2 between autistic and control subjects. Further analysis of the total number of cells and neuronal volume in specific cortical areas will be needed to better establish the cellular phenotype of the autistic cerebral cortex and to understand its clinical relevance to autism.
Supplementary Material
Supplemental table 1. Clinical characteristics of postmortem cases, including age, diagnosis, postmortem interval, hemisphere, and cause of death. NK: Not known
Supplemental table 2. Stereologic parameters used for pyramidal neuron quantification.
Supplemental table 3. Mean and range (s.d.) obtained from stereological quantification estimates of pyramidal neuron.
Supplemental table 4. Layer II–III quantification data case by case. It included total numbers, cell volumes, Coefficients of error (CE), studies region size, and cell densities.
Supplemental table 5. V–VI quantification data case by case. It included total numbers, cell volumes, Coefficients of error (CE), studies region size, and cell densities.
Supplemental table 6. Ratio Layer II–III / IV–V quantification data case by case, including total number and cell volume ratios.
Highlights.
We did not find significant differences in the number of supragranular or infragranular neurons in the cerebral cortex.
We did not find significant differences in the volume of supragranular or infragranular neurons in the cerebral cortex
This report does not support an alteration of supragranular to infragranular neurons in autism.
Acknowledgments
Funding from NIH (R01 MH094681). We thank Dr. David G. Amaral and Dr. Cynthia Schumman and the Autism Tissue Program for providing tissue.
Abbreviations
- STG
superior temporal gyrus
- TA2
anterior superior temporal area
- TB
magnocellular supratemporal area simplex
- TE1
middle temporal area proper
- TG
temporopolar area
Footnotes
Publisher's Disclaimer: This is a PDF file of an unedited manuscript that has been accepted for publication. As a service to our customers we are providing this early version of the manuscript. The manuscript will undergo copyediting, typesetting, and review of the resulting proof before it is published in its final citable form. Please note that during the production process errors may be discovered which could affect the content, and all legal disclaimers that apply to the journal pertain.
Author’s contribution
EK performed quantification, JC defined the systematic-random sampling, ZC assisted in quantification, JA took microcopy images, ML performed pathology, SN assisted in manuscript writing, and VMC designed the project, generated figures, and wrote the manuscript. All authors read and approved the final manuscript.
Competing interests
The authors declare no competing interests.
References
- 1.Aylward EH, Minshew NJ, Field K, Sparks BF, Singh N. Effects of age on brain volume and head circumference in autism. Neurology. 2002;59:175–183. doi: 10.1212/wnl.59.2.175. [DOI] [PubMed] [Google Scholar]
- 2.Courchesne E. Brain development in autism: early overgrowth followed by premature arrest of growth. Ment Retard Dev Disabil Res Rev. 2004;10:106–111. doi: 10.1002/mrdd.20020. [DOI] [PubMed] [Google Scholar]
- 3.Nordahl C, Braunschweig D, Iosif A, Lee A, Rogers S, et al. Maternal autoantibodies are associated with abnormal brain enlargement in a subgroup of children with autism spectrum disorder. Brain Behav Immun. 2013 doi: 10.1016/j.bbi.2013.01.084. [DOI] [PMC free article] [PubMed] [Google Scholar]
- 4.Carper RA, Courchesne E. Localized enlargement of the frontal cortex in early autism. Biol Psychiatry. 2005;57:126–133. doi: 10.1016/j.biopsych.2004.11.005. [DOI] [PubMed] [Google Scholar]
- 5.Casanova MF, Buxhoeveden DP, Switala AE, Roy E. Minicolumnar pathology in autism. Neurology. 2002;58:428–432. doi: 10.1212/wnl.58.3.428. [DOI] [PubMed] [Google Scholar]
- 6.Courchesne E, Mouton PR, Calhoun ME, Semendeferi K, Ahrens-Barbeau C, et al. Neuron number and size in prefrontal cortex of children with autism. JAMA. 2011;306:2001–2010. doi: 10.1001/jama.2011.1638. [DOI] [PubMed] [Google Scholar]
- 7.Schumann CM, Amaral DG. Stereological analysis of amygdala neuron number in autism. J Neurosci. 2006;26:7674–7679. doi: 10.1523/JNEUROSCI.1285-06.2006. [DOI] [PMC free article] [PubMed] [Google Scholar]
- 8.Bigler ED, Mortensen S, Neeley ES, Ozonoff S, Krasny L, et al. Superior temporal gyrus, language function, and autism. Dev Neuropsychol. 2007;31:217–238. doi: 10.1080/87565640701190841. [DOI] [PubMed] [Google Scholar]
- 9.Radua J, Phillips ML, Russell T, Lawrence N, Marshall N, et al. Neural response to specific components of fearful faces in healthy and schizophrenic adults. Neuroimage. 2010;49:939–946. doi: 10.1016/j.neuroimage.2009.08.030. [DOI] [PubMed] [Google Scholar]
- 10.Lai G, Pantazatos SP, Schneider H, Hirsch J. Neural systems for speech and song in autism. Brain. 2012;135:961–975. doi: 10.1093/brain/awr335. [DOI] [PMC free article] [PubMed] [Google Scholar]
- 11.Jou RJ, Minshew NJ, Keshavan MS, Vitale MP, Hardan AY. Enlarged right superior temporal gyrus in children and adolescents with autism. Brain Res. 2010;1360:205–212. doi: 10.1016/j.brainres.2010.09.005. [DOI] [PMC free article] [PubMed] [Google Scholar]
- 12.Opris I, Fuqua JL, Gerhardt GA, Hampson RE, Deadwyler SA. Prefrontal cortical recordings with biomorphic MEAs reveal complex columnar-laminar microcircuits for BCI/BMI implementation. J Neurosci Methods. 2014 doi: 10.1016/j.jneumeth.2014.05.029. [DOI] [PMC free article] [PubMed] [Google Scholar]
- 13.Camacho J, Ejaz E, Ariza J, Noctor SC, Martinez-Cerdeno V. RELN-expressing neuron density in layer I of the superior temporal lobe is similar in human brains with autism and in age-matched controls. Neurosci Lett. 2014;579C:163–167. doi: 10.1016/j.neulet.2014.07.031. [DOI] [PMC free article] [PubMed] [Google Scholar]
- 14.Schmitz C, Hof PR. Design-based stereology in neuroscience. Neuroscience. 2005;130:813–831. doi: 10.1016/j.neuroscience.2004.08.050. [DOI] [PubMed] [Google Scholar]
- 15.Mukaetova-Ladinska EB, Arnold H, Jaros E, Perry R, Perry E. Depletion of MAP2 expression and laminar cytoarchitectonic changes in dorsolateral prefrontal cortex in adult autistic individuals. Neuropathol Appl Neurobiol. 2004;30:615–623. doi: 10.1111/j.1365-2990.2004.00574.x. [DOI] [PubMed] [Google Scholar]
- 16.Kennedy DP, Semendeferi K, Courchesne E. No reduction of spindle neuron number in frontoinsular cortex in autism. Brain Cogn. 2007;64:124–129. doi: 10.1016/j.bandc.2007.01.007. [DOI] [PubMed] [Google Scholar]
- 17.Jacot-Descombes S, Uppal N, Wicinski B, Santos M, Schmeidler J, et al. Decreased pyramidal neuron size in Brodmann areas 44 and 45 in patients with autism. Acta Neuropathol. 2012;124:67–79. doi: 10.1007/s00401-012-0976-6. [DOI] [PubMed] [Google Scholar]
- 18.Oblak AL, Rosene DL, Kemper TL, Bauman ML, Blatt GJ. Altered posterior cingulate cortical cyctoarchitecture, but normal density of neurons and interneurons in the posterior cingulate cortex and fusiform gyrus in autism. Autism Res. 2011;4:200–211. doi: 10.1002/aur.188. [DOI] [PMC free article] [PubMed] [Google Scholar]
- 19.Uppal N, Gianatiempo I, Wicinski B, Schmeidler J, Heinsen H, et al. Neuropathology of the posteroinferior occipitotemporal gyrus in children with autism. Mol Autism. 2014;5:17. doi: 10.1186/2040-2392-5-17. [DOI] [PMC free article] [PubMed] [Google Scholar]
- 20.Uppal N, Wicinski B, Buxbaum JD, Heinsen H, Schmitz C, et al. Neuropathology of the anterior midcingulate cortex in young children with autism. J Neuropathol Exp Neurol. 2014;73:891–902. doi: 10.1097/NEN.0000000000000108. [DOI] [PubMed] [Google Scholar]
- 21.van Kooten IA, Palmen SJ, von Cappeln P, Steinbusch HW, Korr H, et al. Neurons in the fusiform gyrus are fewer and smaller in autism. Brain. 2008;131:987–999. doi: 10.1093/brain/awn033. [DOI] [PubMed] [Google Scholar]
- 22.Whitney ER, Kemper TL, Rosene DL, Bauman ML, Blatt GJ. Density of cerebellar basket and stellate cells in autism: evidence for a late developmental loss of Purkinje cells. J Neurosci Res. 2009;87:2245–2254. doi: 10.1002/jnr.22056. [DOI] [PMC free article] [PubMed] [Google Scholar]
- 23.Fatemi SH, Halt AR, Realmuto G, Earle J, Kist DA, et al. Purkinje cell size is reduced in cerebellum of patients with autism. Cell Mol Neurobiol. 2002;22:171–175. doi: 10.1023/A:1019861721160. [DOI] [PMC free article] [PubMed] [Google Scholar]
- 24.Simms ML, Kemper TL, Timbie CM, Bauman ML, Blatt GJ. The anterior cingulate cortex in autism: heterogeneity of qualitative and quantitative cytoarchitectonic features suggests possible subgroups. Acta Neuropathol. 2009;118:673–684. doi: 10.1007/s00401-009-0568-2. [DOI] [PubMed] [Google Scholar]
- 25.Raymond GV, Bauman ML, Kemper TL. Hippocampus in autism: a Golgi analysis. Acta Neuropathol. 1996;91:117–119. doi: 10.1007/s004010050401. [DOI] [PubMed] [Google Scholar]
- 26.Unger JW, Lange W. NADPH-diaphorase-positive cell populations in the human amygdala and temporal cortex: neuroanatomy, peptidergic characteristics and aspects of aging and Alzheimer’s disease. Acta Neuropathol. 1992;83:636–646. doi: 10.1007/BF00299414. [DOI] [PubMed] [Google Scholar]
- 27.Ma SY, Rinne JO, Collan Y, Roytta M, Rinne UK. A quantitative morphometrical study of neuron degeneration in the substantia nigra in Parkinson’s disease. J Neurol Sci. 1996;140:40–45. doi: 10.1016/0022-510x(96)00069-x. [DOI] [PubMed] [Google Scholar]
- 28.Rajkowska G, Selemon LD, Goldman-Rakic PS. Neuronal and glial somal size in the prefrontal cortex: a postmortem morphometric study of schizophrenia and Huntington disease. Arch Gen Psychiatry. 1998;55:215–224. doi: 10.1001/archpsyc.55.3.215. [DOI] [PubMed] [Google Scholar]
- 29.Pierri JN, Volk CL, Auh S, Sampson A, Lewis DA. Decreased somal size of deep layer 3 pyramidal neurons in the prefrontal cortex of subjects with schizophrenia. Arch Gen Psychiatry. 2001;58:466–473. doi: 10.1001/archpsyc.58.5.466. [DOI] [PubMed] [Google Scholar]
- 30.Maldonado-Aviles JG, Wu Q, Sampson AR, Lewis DA. Somal size of immunolabeled pyramidal cells in the prefrontal cortex of subjects with schizophrenia. Biol Psychiatry. 2006;60:226–234. doi: 10.1016/j.biopsych.2005.10.028. [DOI] [PubMed] [Google Scholar]
- 31.Chana G, Landau S, Beasley C, Everall IP, Cotter D. Two-dimensional assessment of cytoarchitecture in the anterior cingulate cortex in major depressive disorder, bipolar disorder, and schizophrenia: evidence for decreased neuronal somal size and increased neuronal density. Biol Psychiatry. 2003;53:1086–1098. doi: 10.1016/s0006-3223(03)00114-8. [DOI] [PubMed] [Google Scholar]
- 32.Khundakar A, Morris C, Oakley A, McMeekin W, Thomas AJ. Morphometric analysis of neuronal and glial cell pathology in the dorsolateral prefrontal cortex in late-life depression. Br J Psychiatry. 2009;195:163–169. doi: 10.1192/bjp.bp.108.052688. [DOI] [PubMed] [Google Scholar]
- 33.Khundakar AA, Thomas AJ. Morphometric changes in early- and late-life major depressive disorder: evidence from postmortem studies. Int Psychogeriatr. 2009;21:844–854. doi: 10.1017/S104161020999007X. [DOI] [PubMed] [Google Scholar]
Associated Data
This section collects any data citations, data availability statements, or supplementary materials included in this article.
Supplementary Materials
Supplemental table 1. Clinical characteristics of postmortem cases, including age, diagnosis, postmortem interval, hemisphere, and cause of death. NK: Not known
Supplemental table 2. Stereologic parameters used for pyramidal neuron quantification.
Supplemental table 3. Mean and range (s.d.) obtained from stereological quantification estimates of pyramidal neuron.
Supplemental table 4. Layer II–III quantification data case by case. It included total numbers, cell volumes, Coefficients of error (CE), studies region size, and cell densities.
Supplemental table 5. V–VI quantification data case by case. It included total numbers, cell volumes, Coefficients of error (CE), studies region size, and cell densities.
Supplemental table 6. Ratio Layer II–III / IV–V quantification data case by case, including total number and cell volume ratios.