

Abstract
Overexpression of ERG in the prostate epithelium, due to chromosomal translocations, contributes to prostate tumorigenesis. Here, analysis of ERG siRNA-treated prostate cells harboring the endogenous TMPRSS2-ERG fusion revealed an inverse relationship between ERG and Annexin A2 (ANXA2) expression at both the RNA and protein level. ANXA2, a Ca2+-dependent and phospholipid–binding protein, is involved in various cellular functions, including maintenance of epithelial cell polarity. Mechanistic studies defined the prostate-specific transcription start site of ANXA2 and showed that the recruitment of ERG to the ANXA2 promoter is required for transcriptional repression by ERG. Knockdown of ERG enhanced the apical localization of ANXA2, the bundling of actin filaments at cell-cell junctions and formation of a polarized epithelial phenotype. ERG overexpression disrupted ANXA2 mediated cell polarity and promoted epithelial mesenchymal transition (EMT) by inhibiting CDC42 and RHOA, and by activating cofilin. Immunohistochemistry (IHC), demonstrated a reciprocal relationship of ANXA2 and ERG expression in a large fraction of primary prostate cancer clinical specimens. ANXA2 was absent or markedly reduced in ERG(+) tumors, which were mostly well-differentiated. ERG(−) tumors, meanwhile, expressed moderate to high levels of ANXA2, and were either poorly-differentiated or displayed subsets of poorly-differentiated cells. Taken together, the transcriptional repression of ANXA2 by ERG in prostate epithelial cells plays a critical role in abrogating differentiation, promoting EMT, and in the reciprocal correlation of ERG and ANXA2 expression observed in human prostate cancer.
IMPLICATIONS
ANXA2 is a new component of the ERG network with potential to enhance biological stratification and therapeutic targeting of ERG stratified prostate cancers.
Introduction
Chromosomal translocations in prostate cancer largely consist of gene fusions involving ETS transcription factors and promoters of androgen driven genes. Among the established translocations, the TMPRSS2:ERG fusion, which places ERG under the regulation of androgen receptor (AR), constitutes about 50% of prostate cancers in western countries (1–5). ERG overexpression leads to the induction of C-MYC expression, inhibition of prostate luminal epithelial differentiation markers (KLK3/PSA and SLC45A3/Prostein) and subsequent reversal of differentiation (6, 7). In an effort to continue to refine our understanding of the oncogenic functions of ERG and ERG network in prostate cancer (3, 4), this study reports a novel reciprocal relationship of ERG and ANXA2 that may in part contribute to the ERG induced mesenchymal phenotype.
We have noted earlier the inverse correlation between ERG and ANXA2 gene expression in human prostate cancer specimens and in in vitro cell culture models (2, 6). ANXA2 is a calcium-dependent phospholipid-binding protein involved in a number of cell biological processes, including endosome trafficking, cell adhesion and cytoskeleton organization (8, 9). It is also involved in the plasminogen activation system in initiating wound healing, tissue remodeling and angiogenesis by activation of plasmin (10). At the cellular level, ANXA2 exists as a monomer in the cytoplasm, but it forms a hetero-tetramer complex with S100-A10, which results in its association with the plasma membrane (11–13). It has also been reported to be translocated into the nucleus (14, 15), expressed on the cell surface (10), and secreted into the extracellular milieu (16).
ANXA2 protein is present in the luminal and basal epithelium of glands in the normal prostate or benign prostatic hyperplasia (BPH). However, ANXA2 expression is absent or focally detected in the epithelium of prostatic intraepithelial neoplasia (PIN) and moderately differentiated adenocarcinomas. Surprisingly, ANXA2 expression re-emerges in a subset of poorly differentiated high-grade adenocarcinomas (13, 17–19). The mechanism, by which ANXA2 expression is modulated in prostate cancer progression, remains to be understood.
This study evaluated the potential role of ERG mediated repression of ANXA2 in epithelial-mesenchymal transition (EMT). EMT is a cellular process important during tumor development and metastasis, whereby epithelial cells lose characteristic features of a differentiated phenotype (cell-cell adhesion, planar and apical–basal polarity, and lack of motility) to gain mesenchymal features which include motility, invasiveness and an increased resistance to apoptosis (20). Previous studies have shown that ERG promotes EMT through facilitators such as ZEB1 (21) and Frizzled-4 (FZD4) (22). In contrast, ANXA2binds to both phosphatidylinositol (4,5) P2 (PIP2) and CDC42, and establishes the localization of E-cadherin to cell junctions, all of which are key components of Adherens Junctions (AJ) formation, required for a differentiated epithelial phenotype (23, 24). The formation of intercellular adhesive junctional complexes represented by AJ, Tight Junctions (TJ), desmosomes and gap junctions contribute to the lateral and apical-basal polarity of epithelial cells (25). During EMT, components of junctional complexes (E-cadherin, β-catenin and claudins or occludins from TJs, including ZO-1) are downregulated by transcriptional repression, delocalization or proteolytic degradation (26).
ANXA2 is a key orchestrator of cell-cell adhesion through its control of actin remodeling (9, 27). The association of actin filament bundles with AJ complexes at intercellular contact sites, a crucial step in establishing intercellular adhesion and epithelial polarity (28) is accomplished by the activation Rho-GT Pases, CDC42, RHOA or RAC1 (29, 30). These Rho-GTPases are also critical regulators of microtubule dynamics and intracellular membrane trafficking pathways (20).
Here we demonstrate that a negative regulation of ANXA2 transcription by ERG contributes to the abrogation of prostate epithelial differentiation and promotion of the EMT. Transcriptional repression of ANXA2 disrupts the maintenance of a polar epithelial phenotype through the inhibition of CDC42 and, to a lesser extent, RHOA, and activation of cofilin. We validated the reciprocal correlation between ERG and ANXA2 expression in human prostate tumor specimens. We noted that while ERG(+)/ANXA2(−) expression feature is the prevailing phenotype in well- to moderately differentiated (WD) tumors, ERG(−)/ANXA2(+) tumors tend to be poorly differentiated (PD) or contain secondary or tertiary patterns that are PD. Although the functional impact of the dichotomy of ERG/ANXA2 expression status between moderate and aggressive cancer needs to be better understood, we observed an association of ERG(−)/ANXA2(+) expression status with aggressive cancers. More importantly, the mechanistic insights developed from this study highlighted the critical biological role of ERG in repressing ANXA2 and this expression phenotype was prevalent in a majority of well/moderately differentiated tumors, a common feature of early detected CaP.
Materials and Methods
Prostate Tissue specimen
Under an IRB-approved protocol (Protocol No. 20405-28), forty cases were selected from over 300 prostate cancer patients treated with radical prostatectomy at Walter Reed National Military Medical Center (WRNMMC). Patients, matched for age (42–74 years) and race (Caucasians), were segregated based on differentiation status of the tumors from which mRNA was derived: twenty cases each of WD tumors and PD tumors (2). WD tumors had Gleason score of 6 to7, no seminal vesicle invasion, and well- to moderately-differentiated cells while the PD tumors had Gleason score of 8 to 9, seminal vesicle invasion, and PD cells. Total mRNA extracted from WD and PD tumors and from their matched normal tissues by laser capture micro dissection (LCM) were analyzed for gene expression by using Affymetrix Human Genome U133 Plus 2.0 arrays (GSE32448).
Immunohistochemitry (IHC)
Specimens for ERG and ANXA2 IHC were cut, stained, and prepared according to previously described methods (31, 32). Adjacent whole-mounted sections were analyzed for malignant and benign cells by hematoxylin and eosin (H & E) staining and for ERG and ANXA2 expression status by IHC. The status of ERG and ANXA2 expression of index tumors were correlated with differentiation status and Gleason grade.
Cell culture and siRNA knock-down
Human prostate tumor cell lines VCaP and LNCaP, were purchased from American Type Culture Collection (ATCC, Manassas, VA) and maintained as recommended. VCaP cells were cultured in DMEM supplemented with 10% fetal bovine serum (FBS) or with 10% of charcoal stripped serum (CSS) for androgen deprived conditions, (Gemini Bio-Products, West Sacramento, CA). In siRNA knock-down experiments, cells were deprived of androgen for 72 hours before transfection with siRNA oligonucleotides (oligos) against Non-targeting (NT) control, ERG (5’-CGACAUCCUUCUCUCACAUAU-3’ and5’-UGAUGUUGAUAAAGCCUUA-3’), and ANXA2 (5’-CGACGAGGACUCUCUCAUU-3’, 5’-AUCCAAGUGUCGCUAUUUA-3’, 5’-GGAAGAAAGCUCUGGGACU-3’ and 5’-AAAACCAGCUUGCGAAUAA-3’) by using Lipofectamine 2000 (Invitrogen, Carlsbad, CA). Cells were treated with 0.1 nM of R1881 (Perkin Elmer, Waltham, MA) 24 hours after transfection, and incubated for another 24, 48 or 72 hours before they were analyzed for gene or protein expression. The analysis of total RNA from control and ERG siRNA treated VCaP cells using GeneChip®HGU133 Plus 2.0 arrays was described in Sun et.al. (6).
Luciferase assay
LNCaP-LTE3 cells that stably express N-terminal deleted ERG3 (ΔN- ERG) from doxycycline inducible pLVX-Tight-Puro lentiviral construct (UCLA Vector Core facility) and N-terminal deleted ERG3 (ΔN- ERG) were maintained in RPMI-1640 medium with 10% Tet-system approved FBS (Clontech, mountain View, CA) and 2ug/ml of Puromycin (Sigma-Aldrich, St. Louis MO). Approximately 0.1 × 10⁶ LNCaP-L-LTE3 cells per well were seeded onto 24-well dishes in medium with or without 2 µg/ml of doxycycline (Clontech). After 24 hours, cells were cotransfected with 0.8 µg of each pGL4.11 [luc2P] (promoter-less vector), pGL4.11-ARR2PB [luc2P], pGL4.11-ANXA2(−) 355, pGL4.11-ANXA2(−) 738, pGL4.11-ANXA2(−) 959 or pGL4.11-ANXA2(−) 1146, and 4 ng of phRG-B (Renilla luciferase) as an internal control by using Lipofectamine 2000 (Invitrogen, Carlsbad, CA). VCaP cells in 24-well dishes, which were transfected with NT siRNA and ERG siRNA oligonucleotides 24 earlier, were similarly transfected with the identical set of luciferase reporter constructs. Cell lysates were assayed 24 hours later for firefly and Renilla luciferase activities using the Dual-Luciferase reporter assay system (Promega, Madison, WI). The firefly luciferase activity was normalized against the Renilla luciferase activity of the same sample. Experiments were carried out in triplicates from which the mean and standard error of the mean were calculated.
Immunofluorescence, confocal and TIRF microscopy
VCaP cells were cultured on poly-L-lysine coated coverglass (BD Bioscience; San Jose, CA) in androgen-deprived medium for 2 days before siRNA transfection. Cells were induced with 0.1 nM R1881 24 hours post-transfection and cultured for another 48 hours. Cells were fixed with 4% paraformaldehdye buffered in PBS, permeabilized with 0.1% Triton X-100 in PBS, and blocked with 1% normal horse serum (Vector Laboratories; Burlingame, CA) before incubating with appropriate primary antibodies. Species specific secondary antibodies (Alexa-Fluor-594 goat anti-mouse, Alexa-Fluor-488 goat anti-rabbit; Invitrogen), were subsequently applied together with DAPI (4’,6-diamidino-2-phenylindole). F-actin was stained with AlexaFluor-594 phalloidin (Invitrogen). Images were captured using a 40×/0.65 N-Plan objective on a Leica DMIRE2 upright microscope with a Q Imaging Retiga-EX CCD camera (Surrey, BC, Canada) controlled by Open Lab software (Perkin Elmer), converted into color and merged by using Adobe Photoshop.
Confocal microscopy images were acquired on a LSM 510 Meta confocal system equipped with an Axio Observer Z1 inverted microscope (Carl Zeiss) and a Hamamatsu Photonics EM-CCD Digital Camera (Hamamatsu Corp., Sewickley, PA, USA) using a 40× objective. Total internal reflection fluorescence (TIRF) microscopy imaging was conducted on a Zeiss Axio Observer Z1 inverted microscope equipped with oil immersion alpha Plan-Apochromat 63×/1.46 objective and motorized Laser TIRF 3 system (Carl Zeiss). Excitation was achieved by using 530 nm laser. Images were acquired on a Hamamatsu Photonics EM-CCD digital camera and processed using HC Image acquisition software (Hamamatsu Corp). Approximately 15 cells were imaged from control and knock-downslides, from which the signal intensity of ANXA2 at the apical plasma membrane was averaged.
Immunoblot and Immuno-fluorescence assays
Cells were lysed in Mammalian Protein Extraction Reagent (M-PER) (Thermo Scientific, Rockford, IL) containing protease inhibitor and phosphatase inhibitor cocktails I & II (Sigma-Aldrich). Cell lysates equivalent to 30 µg of protein were separated on 4–12% Bis-Tris gels (Invitrogen) and transferred onto PVDF membrane. Membranes were blocked with blocking buffer (Li-COR Biosciences, Lincoln, NE) and incubated with the appropriate primary antibodies. After washing, membranes were incubated with horseradish peroxidase-linked (GE Healthcare, Piscataway, NJ) or with IRDye-linked secondary antibodies (Li-COR Biosciences). Membranes were developed with ECL Western blot detection reagent (GE Healthcare) and exposed to X-ray film for detection or scanned with Odyssey infra-red scanner (Li-COR Biosciences).
Antibodies used for immunoblot, immunofluorescence and IHC assays against specific proteins were obtained from the following sources: ERGMAb (9FY) from Biocare Medical (Concord, CA); GAPDH (sc-25778) and beta-Catenin (H102, #sc-7199) from Santa Cruz Biotechnology (Santa Cruz, CA); ANXA2 (610068) from BD Biosciences (San Jose, CA); cofilin (#3312), ZO-1 (#40-2200) from Invitrogen; and phospho-cofilin (Ser3, 7G2, #3313), E-Cadherin (clone 24E10,#3195) from Cell Signaling Technology (Beverly, MA).
5’ Rapid Amplification of cDNA Ends (RACE)
5µg of total mRNA isolated from VCaP cells was subjected to 5’ oligo-capping procedure by using First Choice RLM-RACE kit (Invitrogen). The 5’ end of ANXA2 promoter was amplified by 5’ RNA Ligase Mediated Rapid Amplification of cDNA Ends (5’RLM-RACE) by pairing the 5' RACE outer primer, 5’-CTGATGGCGATGAATGAACACTG -3’ with the inner primer, 5’- GGTTATCCAGAGAGATGTCCAAC -3’. Amplicons were gel-purified, cloned into pCR-BluntII-TOPO vector and subjected to DNA sequencing.
Chromatin Immunoprecipitation (ChIP)
VCaP cells transfected with 50 nM of NT siRNA or ERG siRNA for 48 hours were processed for ChIP as previously described (6, 33) using 25 µg of chromatin and 2 µg of ERG MAb (9FY). Enrichment of regions at the ANXA2 promoter compared to input was determined by 40 PCR amplification cycles on T-Gradient Thermo block (Biometra). Amplified DNA was visualized by separation on agarose gel and measured by using Quantity One (Biorad, Hercules, CA). The enrichment was normalized against input DNA. The location of ETS sites (V$ETSF #1 to #8) within the ANXA2 (Gene ID:302) core promoter identified by Mat Inspector software (Genomatix, Ann Arbor, MI) are shown in Fig. 2 C. Primer sequences and PCR conditions used are listed in Supplementary Table 1. As positive control, regions from the C-MYC promoter upstream and HPGD core promoter were amplified (6, 33). A region lacking ETS motifs, approximately 15 kb upstream of the ANXA2 transcription initiation site, was amplified as internal negative control.
Figure 2.

Mapping of prostate specific ANXA2 transcript, analysis of ERG binding and transcription regulation ANXA2 promoter. 5’RACE analysis identified a prostate specific transcript(A). The 5’ end of the transcript is spliced together from exons 1 and exon 2 (red triangles) of ANXA2 mRNA, variant 1 (NM_001002858.2) and variant 3 (NM_004039.2), and is translated starting from exon 2 (B). ChIP of chromatin from NT and ERG siRNA treated VCaP cells using ERG MAb showed relatively strong recruitment of ERG to V$ETSF motifs #1, #2, #3, #6 and #7. The ratio of immunoprecipitated chromatin to input chromatin is shown adjacent to each amplified region. The recruitment of ERG to the C-MYC and HPGD promoter regions were evaluated as positive controls and a region upstream of ANXA2 promoter was tested as a negative control (C). Analysis of luciferase reporter constructs containingANXA2 promoter upstream sequences transfected indoxycycline-inducible ERG expressing LNCaP-LTE3 cell line (D, upper; *, p=value < 0.05, **, p=value < 0.05) and in NT and ERG siRNA treated VCaP cells (D, lower; †, p=value < 0.05). Mean relative luciferase activities were calculated from triplicate transfections.
RHOA, CDC42 and RAC1 G-LISA Assays
VCaP cell transfected with NT siRNA, ERG siRNA or ANXA2 siRNA were analyzed for activated forms of RHOA, CDC42 and RAC1 72-hours after transfection. Cells were stimulated with 50 ng/ml of epidermal growth factor (EGF) (Sigma-Aldrich) for CDC42 and RAC1 activation and with 10 µM of nocodozole (Sigma-Aldrich) for RHOA activation in G-LISA colorimetric or luciferase-based ELISA assays (Cytoskeleton, Denver, CO). Active GTPases were captured in wells of a 96-well plate and after the removal of inactive forms, GTPase activities were detected by using HRP-conjugated antibodies against the specific GTPase. After developing with HRP detection reagents, absorbance was measured at 490 nm and luminescence was measured on a microplate lumino meter. The mean relative Rho-GTPase activity from three replicates was normalized relative to NT siRNA treated cells after subtracting background signal.
Results
ANXA2 and ERG expression are inversely correlated in prostate tumors and in VCaP cells
Our previous GeneChip based evaluations of prostate adenocarcinomas from 40 patients revealed a reciprocal correlation between ERG and ANXA2 (6). The mean differences of gene expression for ANXA2 between ERG (+) and ERG (−) tumors showed a sharp decrease compared to other members of the Annexin family (Fig. 1A, middle row). An inverse correlation between ERG and ANXA2 expression is observed in a majority of the40 cases analyzed (Fig. 1B). This correlation was further examined by the siRNA knock-down of ERG in VCaP cells, which carry the TMPRSS2:ERG fusion and overexpress ERG protein. An approximately 2.5 fold increase of ANXA2 expression was noted in ERG siRNA versus control NT siRNA treated VCaP cells (Fig. 1C). Consistent with the ANXA2 mRNA data, a 4-fold increase in ANXA2 protein expression was noted in response to ERG knock-down in VCaP cells (Fig. 1D).
Figure 1. Gene expression analysis of 40 patients (20 WD and 20 PD) showed inverse correlation of gene expression between ERG and ANXA2.

Mean differences of mRNA expression between WD and PD, ERG(+) and ERG(−), as well as normal and tumor samples for members of the ANNEXIN family (A). Tumor vs. normal expression ratios ofERG and ANXA2 in 20 WD and 20 PD tumors showed an inverse correlation (B). Results from GeneChip analysis of VCaP cells, 24 and 48 h after ERG siRNA knock-down showing ratios of ANXA2 expression for ERG/NT siRNA, averaged from three ANXA2 probe sets, 213503_x_at, 201590_x_at and 210427_x_at. (Two-tailed Student’s T-test, *p- value=6.38×10⁻⁶; **p-value=4.51×10⁻⁵) (C). Immunoblot assay of lysates from VCaP cells 72 h after transfection with 25 or 50 nM of ERG, ANXA2 or combined ERG and ANXA2 siRNA oligos (D).
Mapping and characterization of prostate specific ANXA2 promoter
To examine whether the reciprocal correlation between ERG and ANXA2 was the result of ERG mediated transcriptional repression of ANXA2, we analyzed the transcription regulation of the ANXA2 promoter. We first identified the prostate specific ANXA2 promoter by 5’ Rapid Amplification of cDNA Ends (RACE) from cDNA of VCaP cells. Transcripts amplified using distinct primer pairs were found to be identical by sequence analyses (Fig. 2A). These data suggested for transcription initiation site within the GXP269017 promoter sequence (ElDorado 12–2012 annotation, NCBI build 37) (34). This ANXA2 transcript is comprised of a non-coding exon 1 spliced to exon 2, which are 12 kb apart in the genome (Fig. 2B). Analysis of the ANXA2 promoter for potential ERG binding sites using the Mat Inspector identified at least eight sites represented by the V$ETSF matrix. ChIP assays using chromatin from VCaP cells confirmed the recruitment of ERG to binding sites #1, #2, #3 #6 and #7, which were significantly reduced upon siRNA treatment (Fig. 2C). Transcription regulation by ERG were analyzed in CaP cell lines by using luciferase reporter constructs containing ANXA2 promoter upstream sequences that span V$ETSF #1 to #8. Overexpression of ERG by using doxycycline inducible ERG lentivirus in LNCaP-LTE3 cell line followed by luciferase assay showed repression of transcription from reporter constructs incorporating959 bp and 1146 bp upstream sequences from the start site (Fig. 2D, upper), while the knock-down of ERG in VCaP cells alleviated transcription repression in reporter construct containing 959 bp upstream sequences from the start site (Fig. 2D, lower).
ANXA2 induced by ERG knock-down is localized to the apical surface of the VCaP cells
In VCaP cells, the localization of ANXA2 to peripheral cell junctions is increased upon ERG knock-down, as observed by immunofluorescence staining (Fig. 3A). Further evaluation by scanning the XZ- and YZ- sections of cells using confocal microscopy (Fig. 3B) showed the accumulation of ANXA2 not only to the cellular junctions but also to the apical surface of cells. We also showed that the upregulated ANXA2 is localized to the to the apical plasma membrane of immunofluorescence-labeled cells by using trans-total internal reflection fluorescence (TIRF) microscopy, which selectively detects protein molecules nearest to orassociated with the plasma membrane (35). Quantitative evaluation of the distribution of ANXA2 within the TIRF field of excitation in ERG depleted cells compared to control NT transfected VCaP cells showed a 3.7-fold increase in signal intensity at the cell plasma membrane (Fig. 3C).
Figure 3. ERG knock-down induces ANXA2 overexpression.

VCaP cells were transfected with 50 nM of ERG, ANXA2 or combined ERG and ANXA2 siRNA oligos and analyzed after 72 h by immunofluorescence assay (A). XZ- and YZ-sections, taken through the region depicted by the green and red lines, respectively, show that ERG siRNA knock-down induces accumulation of ANXA2 at the apical surface of VCaP cells (white arrowhead) compared to control NT siRNA (B). Images of TIRF field showing control and ERG siRNA knock-down cells. Signal intensity is averaged from 4 sets of 15 cells each (unpaired t- test; n = 4 sets of 15 cells each; p-value = 0.032) (C). All bars represent 10 µm.
ERG represses CDC42 activity via inhibition of ANXA2
Since the inhibition of differentiation by ERG is accompanied by the development of a more pronounced mesenchymal phenotype (21, 22), we reasoned that the knock-down of ERG would reverse the mesenchymal phenotype and regain the features of differentiated epithelial cells, characterized by apical–basal polarity. This was confirmed by an increased accumulation of AJ components, E-cadherin and β-catenin, and ZO-1, a major constituent of TJ, at inter-cellular junctions following the knock-down of ERG (Fig. 4A). Since the formation of intercellular adhesion and epithelial polarity depend on the association of actin filament bundles with AJs, we monitored the extent of actin polymerization by using fluorescent conjugated phalloidin. We observed that the depletion of ERG enhanced the accumulation of f-actin along intercellular junctions (Fig. 4B).
Figure 4.
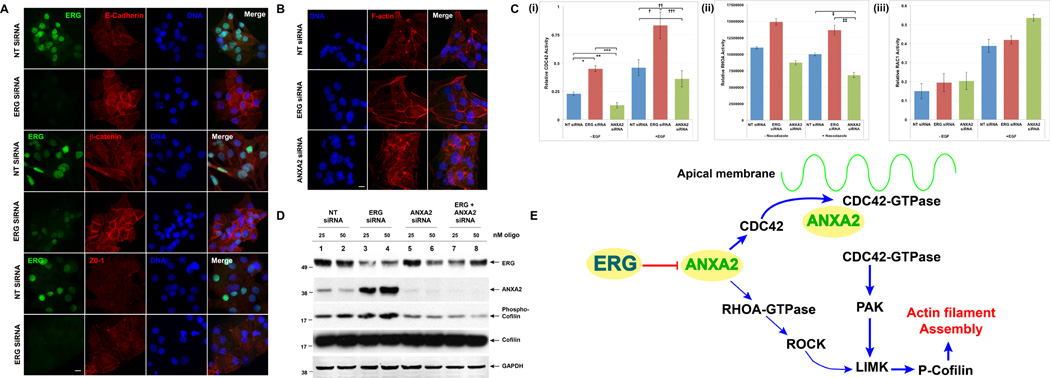
A. The knock-down of ERG promotes the reversal of EMT and reestablishes the polarized epithelial phenotype of the VCaP cells, demonstrated by the over-expression of determinants of the polarized epithelial cells and components of the AJ (E-cadherin and beta-catenin) and Tight Junction (ZO-1). B. Compared to control NT-siRNA, knock-down of ERG increases organized f-actin polymerization, while knock-down of ANXA2 results in disorganized f-actin network. Cells were fixed and stained with Alexa-594 phalloidin 72 h after transfection. C. ERG inhibits the CDC42 and RHOA activity through repression of ANXA2. The relative activity of activated GTP bound forms of (i) CDC42 (ii) RHOA and (iii) RAC1 in were measured by G-LISA assays 72 h after siRNA transfection (C)((Two-tailed Student’s T-test: *, P < 0.05; **, P < 0.05; ***, P < 0.05; †, P < 0.05;††, P < 0.05;†††, P < 0.05; †, P < 0.05; ††, P < 0.05). The expression of phosphorylated cofilin is enhanced by ERG knock-down (lanes 3 and 4), but is reduced by ANXA2 (lanes 5 and 6) and by combined ERG and ANXA2 knock down (lanes 7 and 8) (D). ERG regulates the transition between the polar differentiated epithelial phenotype and the mesenchymal phenotype by inhibiting CDC42 and RHOA mediated actin-polymerization through the repression of ANXA2 (E).
To assess further whether the ERG mediated inhibition of differentiation and promotion of EMT is dependent or independent of ANXA2, we examined the effect of ERG knock-down on downstream targets of ANXA2. Since members of the Rho family of GTPases are involved in cell-cell adhesion, cell polarity and actin cytoskeletal rearrangement (9, 30, 36), we examined whether the effects of ERG si RNA induced ANXA2 expression may be mediated throughCDC42, RHOA and RAC1 GTPases. Activated forms of CDC42, RHOA and RAC1 GTPases in VCaP cells were measured using G-LISA activation assays following the siRNA knock-down of ERG or ANXA2. Cells were added with either EGF or nocodazole briefly to stimulate GTPase activity. We observed an increase in the activated forms of CDC42 following ERG siRNA knock-down [Fig. 4C(i)], suggesting that CDC42 was repressed by the ERG mediated repression of ANXA2. In contrast, the siRNA knock-down of ANXA2 decreased the active form of CDC42 and GTPases. Compared to CDC42, RHOA showed a similar but weaker response that was enhanced by EGF stimulation [Fig. 4C (ii)]. RAC1, however, was not responsive to the knock-down of ERG and ANXA2. To demonstrate further that the bundling of f-actin is enhanced upon ANXA2 overexpression, we monitored the activity of cofilin. Cofilin is an actin severing protein downstream of the CDC42 and RHOA pathway that becomes inactivated following phosphorylation. ERG knock-down resulted in increased levels of phosphorylated and inactive form of cofilin. Consistent with these data, ANXA2 knock-down resulted in decreased levels of cofilin (Fig. 4D). These observations suggested that the destabilization of actin polymerization is controlled through the downregulation of ANXA2 by the ERG oncoprotein in prostate cancer cells. Taken together, the re-establishment of polarized epithelial features, organized bundling of actin filaments at cell-cell junctions, activation of CDC42 and RHOA GTPases and cofilin phosphorylation suggest that ERG regulates differentiation and EMT activities through the repression of ANXA2 and the activity of Rho-GTPases (Fig. 4E).
Inverse relationship of ERG and ANXA2 expression in prostate cancer
The reciprocal relationship between ERG and ANXA2 gene expression established by the GeneChip based evaluations of prostate tumors (Fig. 1A and B) and the induction of ANXA2 by ERG inhibition in theTMPRSS2-ERG positive prostate cancer cell culture model, prompted us to further examine if this correlation held for ERG and ANXA2protein status in prostate tumors. We evaluated ERG and ANXA2 protein expression status in relation to the Gleason score and differentiation phenotype of the index tumors of representative whole-mounted prostate sections from the same cohort of patients whose specimens were analyzed by Gene Chip (Table 1). Positive ERG expression was confirmed in the index tumors of 26 out of the 40 cases examined (37). Our evaluation of ANXA2 expression by IHC (Fig. 5) validated previous reports showing that ANXA2 is localized to the membrane and cytoplasm of basal and epithelial secretory cells of normal/benign prostatic glands (13, 38). While the presence or absence of ERG in tumors was more uniform, ANXA2 expression was variable and tumors were scored as positive if more than 10%of cells stained positive forANXA2. Tumors were referred to as well differentiated (WD), if the primary Gleason pattern was 3 or less and as poorly differentiated (PD) if the primary Gleason pattern was 4 or 5. On this basis, we classified 28 tumors as WD and 12 as PD. Among the 28WD tumors, a majority (67.8%or 19/28) were ERG(+)/ANXA2(−), while half of the 12 PD tumors were ERG(−)/ANXA2(+) (Table 1, Fig. 5). Most of the ERG(+) tumors (22 WD and 4 PD) exhibited absent or markedly reduced ANXA2 expression (Table 1, Fig. 5A–C). In contrast, ERG(−) tumors (11/14), regardless of differentiation status, exhibited moderate to high levels of ANXA2 expression (Table 1, Fig. 5D and E). Fig. 5E shows a papillary variant of prostatic ductal adenocarcinoma, a rare histologic subtype, characterized by stratified columnar epithelium. The tumor shown here is ERG(−) but is populated by both ANXA2(−) and ANXA2(+) cells. A very small number of tumors (3 of 40: 1 WD and 2 PD) were negative for both ERG and ANXA2 expression (Fig. 5F and 5G).
Table 1.
ERG and ANXA2 expression in 40 patients of defined tumor differentiation status
 |
Color guide: For Differentiation status and Gleason sum of index tumor (T1), light blue indicates tumors with primary Gleason pattern 3 or less and are well differentiated, and peach indicates tumors with primary Gleason pattern 4 or 5 and are poorly differentiated. For ERG status of T1: green indicates no ERG expression (ERG−) and red indicates ERG expression (ERG+). For levels of ANXA2 expression: green indicates ANXA2(−), where expression of ANXA2 is 10% or less, and shades of red indicate ANXA2(+), showing increasing levels of ANXA2 expression above 10%.
Figure 5.
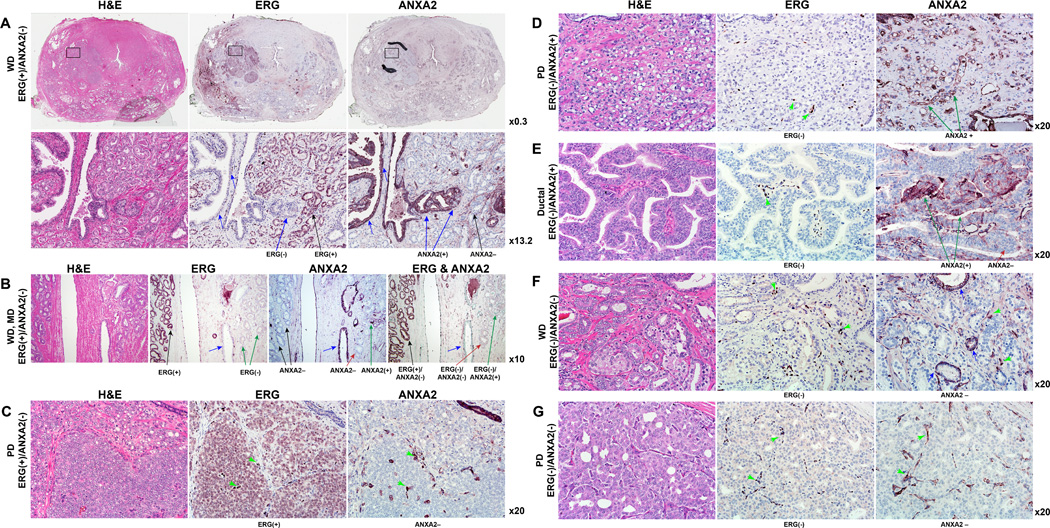
IHC staining of consecutive sections of representative whole-mounted prostate sections with H & E, ERG and ANXA2 antibodies demonstrate the inverse correlation of ERG and ANXA2 in prostate adenocarcinoma. (A) A representative whole-mounted prostate section with index tumor of ERG(+)/ ANXA2(−) phenotype. In the second row, the region indicated by the rectangle is magnified, showing membranous and cytoplasmic staining of ANXA2 in the luminal and basal cells of benign prostate epithelium (blue arrows). Black arrows indicate well differentiated (WD) ERG(+)/ANXA2(−) cells. (B) WD tumors with both ERG(+)/ANXA2(−) (black arrows) and ERG(−)/ANXA2(−) (red arrow) phenotype. Blue arrow indicates benign gland. (C) and (D) represent poorly differentiated (PD) tumors with inversely correlated ERG(+)/ANXA2(−) and ERG(−)/ANXA2(+) phenotype, respectively. (E) Prostatic ductal adenocarcinoma (papillary variant) which is ERG(−) but has both ANXA2(−) and ANXA2(+) cells. WD and PD tumors of ERG(−)/ANXA2(−) phenotype are represented in (F) and (G), respectively. Benign glands (blue arrows) and endothelial cells (green arrowheads) are ANXA2(+).
Discussion
The comparison of ANXA2 RNA expression to other members of the ANNEXIN gene family from the CPDR 40-patient GeneChip dataset (GSE32448) showed a notable decrease in ANXA2 expression in ERG(+) versusERG(−) tumors, suggesting a transcriptional regulation of ANXA2 by ERG. This reciprocal correlation of ERG and ANXA2 gene expression observed in prostate tumors was further validated by RNA and protein expression analysis in VCaP cells (Fig. 1C–D). The identification of a prostate specific ANXA2 promoter allowed us to map putative ERG binding motifs matching the V$ETSF matrix and demonstrate significant recruitment of ERG to five of the eight ERG binding sites by ChIP assay. Deletion analysis of the ANXA2 promoter in LNCaP cells with inducible ERG expression revealed marked repression in response to ERG overexpression in constructs pGL4.11-ANXA2-1146 and pGL4.11-ANXA2-959, which contain ERG binding sites #6 and #7 (Fig. 2D, upper). However, the analysis of the reporter constructs in VCaP cells showed relieve of transcriptional repression upon ERG siRNA knock-down, only with pGL4.11-ANXA2-959 (Fig. 2D, upper, lower). The smaller increase in transcription activity upon ERG siRNA knock-down in VCaP cells compared to that observed in LNCaP cells when ERG over-expression is induced may reflect the interaction of ERG with other cell specific transcription factors. Furthermore, the recruitment of ERG to multiple ERG binding sites of the ANXA2 promoter in the context of the chromatin, as shown by ChIP assay, supports the notion that the regulation of ANXA2 expression may involve other cofactors. Our results support the hypothesis of transcriptional repression of ANXA2 expression by the ERG oncogenic activation in TMPRSS2-ERG positive prostate cancer cells.
We showed that ANXA2 is localized to the intercellular junction of cells (Fig. 3A), the apical cellular surface (Fig. 3B) and the plasma membrane (Fig. 3C) upon ERG knock-down. These results are consistent with observations that ERG overexpression abrogates cell differentiation (6, 7) and with the function of ANXA2 in establishing a polar and differentiated epithelial phenotype (23, 24). ERG knock-down not only enhanced the localization of E-cadherin and β-catenin, and ZO-1 at intercellular junctions (Fig 4A), but also increased the accumulation of actin filament bundles, a critical step in establishing intercellular adhesion and epithelial polarity (Fig 4B). In contrast, decreased expression of ANXA2 led to an apparent destabilization of the actin cytoskeletal network. These structural changes that resulted from ERG siRNA knock-down highlight the reversal from a mesenchymal to a differentiated epithelial phenotype (25, 26) and support the function of ANXA2 in establishing and maintaining the epithelial phenotype of prostate glands.
ANXA2 organizes actin remodeling and cell-cell adhesion through Rho-GTPases, which are critical regulators of cell polarity that stabilize the polymerization of actin and its interaction with AJ complexes (9, 30, 36). The increase of activated CDC42 and RHOA upon ERG depletion, and decrease upon ANXA2 knock-down, suggests that the inhibition of differentiation by ERG appears to be achieved in part by the activation of CDC42 and, to a lesser extent, RHOA through ANXA2 (Fig. 3C). In addition, the enhanced formation of actin bundles along intercellular junctions upon ERG knock-down coincides with increased phosphorylation and inactivation of cofilin, whereas ANXA2 knock-down decreased cofilin phosphorylation (Fig. 3D). Cofilin phosphorylation is regulated by Rho-GTPases through pathways involving ROCK (RHO-associated protein kinase), PAK1 (p21-activated kinase) and LIMK1 (LIM-kinase 1) (39, 40). Inactivation of cofilin releases ATP•G-actin monomers, which promotes the elongation of actin filament bundles. In contrast, the activation of cofilin increases severing of actin filaments and generates free barbed ends that increase branching. These results supports the proposal that ERG inhibits differentiation and promotes EMT, which involve the dissolution of polarized epithelium and actin bundles at cell-cell junctions through the repression of ANXA2, CDC42 and RHOA (Fig. 5).
In a majority of cancers, such as breast (41), gastric (42), pancreatic (43), colorectal (44) and hepato-cellular carcinomas (45), the upregulation of ANXA2 during oncogenic transformation is indicative of aggressive disease or poor clinical outcome. In some other malignancies, such as laryngeal and squamous cell carcinoma (46), head and neck dysplasia (47), and osteosarcoma (48), ANXA2 is downregulated and its absence is correlated with poorly-differentiated tumors and with poor prognosis. When up-regulated, ANXA2 functions as a co-receptor for plasminogen, tPA and pro-cathepsin B and promotes the conversion of plasminogen into plasmin, which is required for invasion, metastasis and angiogenesis (10, 41). It is hypothesized that in tumors where ANXA2 is overexpressed, its role as a plasminogen receptor prevails and drives the metastatic process, while in tumors where it is down-regulated, malignancy is achieved by plasminogen-independent mechanisms such as anaplastic transformation or dedifferentiation (49).
The expression of ANXA2 during the neoplastic transformation of the prostate epithelium reveals a biphasic profile: high in normal tissues, is diminished or lost in WD tumors, but reemerges in advanced tumors. This expression pattern encapsulates the critical cellular functions of ANXA2, which include establishing the differentiated and polarized epithelium, protein trafficking, angiogenesis and metastasis (8, 11, 49). We can infer that ANXA2 plays a dominant role in the formation of intercellular junctions and apical-basal polarity to support a differentiated epithelial phenotype in normal cells. To facilitate the transition to a mesenchymal phenotype, it may be necessary to silence or repress ANXA2 expression. However, as tumor cells acquire invasive properties, ANXA2 is reenlisted to promote metastasis through its interaction with plasminogen on the cell surface.
Our analysis of ERG and ANXA2 expression in whole-mount prostate sections showed moderate or strong reciprocal ERG and ANXA2 expression in 80% (32/40) of the cases examined (Table 1). The association WD tumors with ANXA2(−) expression status observed here have been noted in previous reports describing the absence or focal presence of ANXA2 in low grade and WD prostate cancer (Gleason pattern 3 or lower), but its detection in approximately half of high-grade (Gleason score of 8 or greater) lesions (13, 18, 38, 50). We observed a significant association between ERG(+)/ANXA2(−) status with WD tumors of low Gleason score (19/21). Additionally, ERG(−)/ANXA2(+) expression status are associated with PD tumors of higher Gleason score (6/11) or WD tumors with secondary or tertiary patterns that are PD (5/11). These observations suggest that the evaluation of ERG and ANXA2 expression status has potential utility to enhance the diagnosis and prognostic stratification of CaP. In fact, ANXA2 has been tested as an auxiliary marker together with high-molecular weight cytokeratin, p63 and AMACR for prostate cancer and other malignancies (8, 38, 49). Further confirmation of whether tumors of ERG(−)/ANXA2(+) phenotype or the less frequent ERG(−)/ANXA2(−) phenotype may contribute to poor prognosis compared to ERG(+)/ANXA2(−) would require studies using larger cohorts of patients.
In summary, we have established the inverse correlation ofERG and ANXA2 in cell culture models and prostate cancer specimens. We showed that the inverse correlation is a result of transcriptional repression of ANXA2 by ERG overexpression. The negative regulation of ANXA2 and subsequently its downstream effectors, the Rho-GTPases, CDC42 and RHOA, are critical in the inhibition of differentiation and reversal of EMT. Whether the pleiotropic function of ANXA2 may regulate the stability and biological function of ERG remains to be explored. However, the differential reciprocal expression of ERG and ANXA2 in low grade and high grade prostate tumors may be useful for the prognostic stratification of prostate cancer.
Supplementary Material
Acknowledgement
The authors would like to thank Anshu Rastogi for her help with the careful editing of the manuscript and Stephen Doyle for his assistance in preparing the figures.
This research is supported by funds from USUHS-CPDR, National Cancer Institute (NCI) R01CA162383 grant and NCI Early Detection Research Network-USUHS interagency agreement HT9404-12-1-003 to S. S, and National Institute on Minority Health and Health Disparities 1P20MD006882 grant to J.K. V.
Footnotes
The authors disclose no potential conflicts of interest.
Disclaimer: The opinions and assertions contained herein represent the personal views of the authors and are not to be construed as official or as representing the views of the Department of the Army, the Department of Defense, or the United States Government.
References
- 1.Tomlins SA, Rhodes DR, Perner S, Dhanasekaran SM, Mehra R, Sun XW, et al. Recurrent fusion of TMPRSS2 and ETS transcription factor genes in prostate cancer. Science. 2005;310:644–648. doi: 10.1126/science.1117679. [DOI] [PubMed] [Google Scholar]
- 2.Petrovics G, Liu A, Shaheduzzaman S, Furusato B, Sun C, Chen Y, et al. Frequent overexpression of ETS-related gene-1 (ERG1) in prostate cancer transcriptome. Oncogene. 2005;24:3847–3852. doi: 10.1038/sj.onc.1208518. [DOI] [PubMed] [Google Scholar]
- 3.Rubin MA, Maher CA, Chinnaiyan AM. Common gene rearrangements in prostate cancer. J Clin Oncol. 2011;29:3659–3668. doi: 10.1200/JCO.2011.35.1916. [DOI] [PMC free article] [PubMed] [Google Scholar]
- 4.Sreenath T, Dobi A, Petrovics G, Srivastava S. Oncogenic activation of ERG: A predominant mechanism in prostate cancer. J Carcinog. 2011;10:37. doi: 10.4103/1477-3163.91122. [DOI] [PMC free article] [PubMed] [Google Scholar]
- 5.Dobi A, Sreenath T, Srivastava S. Androgen-Dependent Oncogenic Activation of ETS Transcription Factors by Recurrent Gene Fusions in Prostate Cancer: Biological and Clinical Implications. In: Wang Z, editor. Androgen-Responsive Genes in Prostate Cancer. New York: Springer; 2013. pp. 307–328. [Google Scholar]
- 6.Sun C, Dobi A, Mohamed A, Li H, Thangapazham RL, Furusato B, et al. TMPRSS2-ERG fusion, a common genomic alteration in prostate cancer activates C-MYC and abrogates prostate epithelial differentiation. Oncogene. 2008 doi: 10.1038/onc.2008.183. [DOI] [PMC free article] [PubMed] [Google Scholar]
- 7.Tomlins SA, Laxman B, Varambally S, Cao X, Yu J, Helgeson BE, et al. Role of the TMPRSS2-ERG gene fusion in prostate cancer. Neoplasia. 2008;10:177–188. doi: 10.1593/neo.07822. [DOI] [PMC free article] [PubMed] [Google Scholar]
- 8.Lokman NA, Ween MP, Oehler MK, Ricciardelli C. The role of annexin A2 in tumorigenesis and cancer progression. Cancer Microenviron. 2011;4:199–208. doi: 10.1007/s12307-011-0064-9. [DOI] [PMC free article] [PubMed] [Google Scholar]
- 9.Grieve AG, Moss SE, Hayes MJ. Annexin A2 at the interface of actin and membrane dynamics: a focus on its roles in endocytosis and cell polarization. International journal of cell biology. 2012;2012:852430. doi: 10.1155/2012/852430. [DOI] [PMC free article] [PubMed] [Google Scholar]
- 10.Diaz VM, Hurtado M, Thomson TM, Reventos J, Paciucci R. Specific interaction of tissue-type plasminogen activator (t-PA) with annexin II on the membrane of pancreatic cancer cells activates plasminogen and promotes invasion in vitro. Gut. 2004;53:993–1000. doi: 10.1136/gut.2003.026831. [DOI] [PMC free article] [PubMed] [Google Scholar]
- 11.Gerke V, Moss SE. Annexins: from structure to function. Physiol Rev. 2002;82:331–371. doi: 10.1152/physrev.00030.2001. [DOI] [PubMed] [Google Scholar]
- 12.Liu JW, Shen JJ, Tanzillo-Swarts A, Bhatia B, Maldonado CM, Person MD, et al. Annexin II expression is reduced or lost in prostate cancer cells and its re-expression inhibits prostate cancer cell migration. Oncogene. 2003;22:1475–1485. doi: 10.1038/sj.onc.1206196. [DOI] [PubMed] [Google Scholar]
- 13.Yee DS, Narula N, Ramzy I, Boker J, Ahlering TE, Skarecky DW, et al. Reduced annexin II protein expression in high-grade prostatic intraepithelial neoplasia and prostate cancer. Arch Pathol Lab Med. 2007;131:902–908. doi: 10.5858/2007-131-902-RAIPEI. [DOI] [PubMed] [Google Scholar]
- 14.Eberhard DA, Karns LR, VandenBerg SR, Creutz CE. Control of the nuclear-cytoplasmic partitioning of annexin II by a nuclear export signal and by p11 binding. J Cell Sci. 2001;114:3155–3166. doi: 10.1242/jcs.114.17.3155. [DOI] [PubMed] [Google Scholar]
- 15.Liu J, Vishwanatha JK. Regulation of nucleo-cytoplasmic shuttling of human annexin A2: a proposed mechanism. Mol Cell Biochem. 2007;303:211–220. doi: 10.1007/s11010-007-9477-7. [DOI] [PubMed] [Google Scholar]
- 16.Faure AV, Migne C, Devilliers G, Ayala-Sanmartin J. Annexin 2 "secretion" accompanying exocytosis of chromaffin cells: possible mechanisms of annexin release. Exp Cell Res. 2002;276:79–89. doi: 10.1006/excr.2002.5512. [DOI] [PubMed] [Google Scholar]
- 17.Banerjee AG, Liu J, Yuan Y, Gopalakrishnan VK, Johansson SL, Dinda AK, et al. Expression of biomarkers modulating prostate cancer angiogenesis: differential expression of annexin II in prostate carcinomas from India and USA. Molecular cancer. 2003;2:34. doi: 10.1186/1476-4598-2-34. [DOI] [PMC free article] [PubMed] [Google Scholar]
- 18.Chetcuti A, Margan SH, Russell P, Mann S, Millar DS, Clark SJ, et al. Loss of annexin II heavy and light chains in prostate cancer and its precursors. Cancer Res. 2001;61:6331–6334. [PubMed] [Google Scholar]
- 19.Inokuchi J, Narula N, Yee DS, Skarecky DW, Lau A, Ornstein DK, et al. Annexin A2 positively contributes to the malignant phenotype and secretion of IL-6 in DU145 prostate cancer cells. International journal of cancer Journal international du cancer. 2009;124:68–74. doi: 10.1002/ijc.23928. [DOI] [PubMed] [Google Scholar]
- 20.Martin-Belmonte F, Perez-Moreno M. Epithelial cell polarity, stem cells and cancer. Nature reviews Cancer. 2012;12:23–38. doi: 10.1038/nrc3169. [DOI] [PubMed] [Google Scholar]
- 21.Leshem O, Madar S, Kogan-Sakin I, Kamer I, Goldstein I, Brosh R, et al. TMPRSS2/ERG promotes epithelial to mesenchymal transition through the ZEB1/ZEB2 axis in a prostate cancer model. PloS one. 2011;6:e21650. doi: 10.1371/journal.pone.0021650. [DOI] [PMC free article] [PubMed] [Google Scholar]
- 22.Gupta S, Iljin K, Sara H, Mpindi JP, Mirtti T, Vainio P, et al. FZD4 as a mediator of ERG oncogene-induced WNT signaling and epithelial-to-mesenchymal transition in human prostate cancer cells. Cancer Res. 2010;70:6735–6745. doi: 10.1158/0008-5472.CAN-10-0244. [DOI] [PubMed] [Google Scholar]
- 23.Hayes MJ, Shao DM, Grieve A, Levine T, Bailly M, Moss SE. Annexin A2 at the interface between F-actin and membranes enriched in phosphatidylinositol 4,5,-bisphosphate. Biochimica et biophysica acta. 2009;1793:1086–1095. doi: 10.1016/j.bbamcr.2008.10.007. [DOI] [PMC free article] [PubMed] [Google Scholar]
- 24.Martin-Belmonte F, Gassama A, Datta A, Yu W, Rescher U, Gerke V, et al. PTEN-mediated apical segregation of phosphoinositides controls epithelial morphogenesis through Cdc42. Cell. 2007;128:383–397. doi: 10.1016/j.cell.2006.11.051. [DOI] [PMC free article] [PubMed] [Google Scholar]
- 25.Nelson WJ. Remodeling epithelial cell organization: transitions between front-rear and apical-basal polarity. Cold Spring Harbor perspectives in biology. 2009;1:a000513. doi: 10.1101/cshperspect.a000513. [DOI] [PMC free article] [PubMed] [Google Scholar]
- 26.Huang RY, Guilford P, Thiery JP. Early events in cell adhesion and polarity during epithelial-mesenchymal transition. J Cell Sci. 2012;125:4417–4422. doi: 10.1242/jcs.099697. [DOI] [PubMed] [Google Scholar]
- 27.Shankar J, Messenberg A, Chan J, Underhill TM, Foster LJ, Nabi IR. Pseudopodial actin dynamics control epithelial-mesenchymal transition in metastatic cancer cells. Cancer Res. 2010;70:3780–3790. doi: 10.1158/0008-5472.CAN-09-4439. [DOI] [PubMed] [Google Scholar]
- 28.Yonemura S. Cadherin-actin interactions at adherens junctions. Curr Opin Cell Biol. 2011;23:515–522. doi: 10.1016/j.ceb.2011.07.001. [DOI] [PubMed] [Google Scholar]
- 29.Olivo C, Vanni C, Mancini P, Silengo L, Torrisi MR, Tarone G, et al. Distinct involvement of cdc42 and RhoA GTPases in actin organization and cell shape in untransformed and Dbl oncogene transformed NIH3T3 cells. Oncogene. 2000;19:1428–1436. doi: 10.1038/sj.onc.1203440. [DOI] [PubMed] [Google Scholar]
- 30.Tapon N, Hall A. Rho, Rac and Cdc42 GTPases regulate the organization of the actin cytoskeleton. Curr Opin Cell Biol. 1997;9:86–92. doi: 10.1016/s0955-0674(97)80156-1. [DOI] [PubMed] [Google Scholar]
- 31.Rosen P, Pfister D, Young D, Petrovics G, Chen Y, Cullen J, et al. Differences in frequency of ERG oncoprotein expression between index tumors of Caucasian and African American patients with prostate cancer. Urology. 2012;80:749–753. doi: 10.1016/j.urology.2012.07.001. [DOI] [PMC free article] [PubMed] [Google Scholar]
- 32.Furusato B, Tan SH, Young D, Dobi A, Sun C, Mohamed AA, et al. ERG oncoprotein expression in prostate cancer: clonal progression of ERG-positive tumor cells and potential for ERG-based stratification. Prostate Cancer Prostatic Dis. 2010;13:228–237. doi: 10.1038/pcan.2010.23. [DOI] [PMC free article] [PubMed] [Google Scholar]
- 33.Mohamed AA, Tan SH, Sun C, Shaheduzzaman S, Hu Y, Petrovics G, et al. ERG oncogene modulates prostaglandin signaling in prostate cancer cells. Cancer biology & therapy. 2011;11:410–417. doi: 10.4161/cbt.11.4.14180. [DOI] [PMC free article] [PubMed] [Google Scholar]
- 34.Supper J, Gugenmus C, Wollnik J, Drueke T, Scherf M, Hahn A, et al. Detecting and visualizing gene fusions. Methods. 2013;59:S24–S28. doi: 10.1016/j.ymeth.2012.09.013. [DOI] [PubMed] [Google Scholar]
- 35.Axelrod D. Total internal reflection fluorescence microscopy in cell biology. Traffic. 2001;2:764–774. doi: 10.1034/j.1600-0854.2001.21104.x. [DOI] [PubMed] [Google Scholar]
- 36.Wilson KF, Erickson JW, Antonyak MA, Cerione RA. Rho GTPases and their roles in cancer metabolism. Trends Mol Med. 2013;19:74–82. doi: 10.1016/j.molmed.2012.10.011. [DOI] [PMC free article] [PubMed] [Google Scholar]
- 37.Tan SH, Furusato B, Fang X, He F, Mohamed AA, Griner NB, et al. Evaluation of ERG responsive proteome in prostate cancer. Prostate. 2014;74:70–89. doi: 10.1002/pros.22731. [DOI] [PMC free article] [PubMed] [Google Scholar]
- 38.Stewart J, Fleshner N, Cole H, Sweet J. Comparison of annexin II, p63 and alpha-methylacyl-CoA racemase immunoreactivity in prostatic tissue: a tissue microarray study. J Clin Pathol. 2007;60:773–780. doi: 10.1136/jcp.2006.040808. [DOI] [PMC free article] [PubMed] [Google Scholar]
- 39.Bravo-Cordero JJ, Magalhaes MA, Eddy RJ, Hodgson L, Condeelis J. Functions of cofilin in cell locomotion and invasion. Nature reviews Molecular cell biology. 2013;14:405–415. doi: 10.1038/nrm3609. [DOI] [PMC free article] [PubMed] [Google Scholar]
- 40.Edwards DC, Sanders LC, Bokoch GM, Gill GN. Activation of LIM-kinase by Pak1 couples Rac/Cdc42 GTPase signalling to actin cytoskeletal dynamics. Nat Cell Biol. 1999;1:253–259. doi: 10.1038/12963. [DOI] [PubMed] [Google Scholar]
- 41.Sharma M, Ownbey RT, Sharma MC. Breast cancer cell surface annexin II induces cell migration and neoangiogenesis via tPA dependent plasmin generation. Exp Mol Pathol. 2010;88:278–286. doi: 10.1016/j.yexmp.2010.01.001. [DOI] [PubMed] [Google Scholar]
- 42.Emoto K, Sawada H, Yamada Y, Fujimoto H, Takahama Y, Ueno M, et al. Annexin II overexpression is correlated with poor prognosis in human gastric carcinoma. Anticancer Res. 2001;21:1339–1345. [PubMed] [Google Scholar]
- 43.Vishwanatha JK, Chiang Y, Kumble KD, Hollingsworth MA, Pour PM. Enhanced expression of annexin II in human pancreatic carcinoma cells and primary pancreatic cancers. Carcinogenesis. 1993;14:2575–2579. doi: 10.1093/carcin/14.12.2575. [DOI] [PubMed] [Google Scholar]
- 44.Emoto K, Yamada Y, Sawada H, Fujimoto H, Ueno M, Takayama T, et al. Annexin II overexpression correlates with stromal tenascin-C overexpression: a prognostic marker in colorectal carcinoma. Cancer. 2001;92:1419–1426. doi: 10.1002/1097-0142(20010915)92:6<1419::aid-cncr1465>3.0.co;2-j. [DOI] [PubMed] [Google Scholar]
- 45.Ji NY, Park MY, Kang YH, Lee CI, Kim DG, Yeom YI, et al. Evaluation of annexin II as a potential serum marker for hepatocellular carcinoma using a developed sandwich ELISA method. Int J Mol Med. 2009;24:765–771. doi: 10.3892/ijmm_00000290. [DOI] [PubMed] [Google Scholar]
- 46.Rodrigo JP, Lequerica-Fernandez P, Rosado P, Allonca E, Garcia-Pedrero JM, de Vicente JC. Clinical significance of annexin A2 downregulation in oral squamous cell carcinoma. Head Neck. 2011;33:1708–1714. doi: 10.1002/hed.21661. [DOI] [PubMed] [Google Scholar]
- 47.Pena-Alonso E, Rodrigo JP, Parra IC, Pedrero JM, Meana MV, Nieto CS, et al. Annexin A2 localizes to the basal epithelial layer and is down-regulated in dysplasia and head and neck squamous cell carcinoma. Cancer Lett. 2008;263:89–98. doi: 10.1016/j.canlet.2007.12.029. [DOI] [PubMed] [Google Scholar]
- 48.Gillette JM, Chan DC, Nielsen-Preiss SM. Annexin 2 expression is reduced in human osteosarcoma metastases. J Cell Biochem. 2004;92:820–832. doi: 10.1002/jcb.20117. [DOI] [PubMed] [Google Scholar]
- 49.Ceruti P, Principe M, Capello M, Cappello P, Novelli F. Three are better than one: plasminogen receptors as cancer theranostic targets. Experimental hematology & oncology. 2013;2:12. doi: 10.1186/2162-3619-2-12. [DOI] [PMC free article] [PubMed] [Google Scholar]
- 50.Smitherman AB, Mohler JL, Maygarden SJ, Ornstein DK. Expression of annexin I, II and VII proteins in androgen stimulated and recurrent prostate cancer. J Urol. 2004;171:916–920. doi: 10.1097/01.ju.0000104674.70170.cd. [DOI] [PubMed] [Google Scholar]
Associated Data
This section collects any data citations, data availability statements, or supplementary materials included in this article.