

Abstract
The use of neuroimaging approaches to identify likely treatment outcomes in patients with major depressive disorder is developing rapidly. Emerging work suggests that resting state pretreatment metabolic activity in the fronto-insular cortex may distinguish between patients likely to respond to psychotherapy or medication and may function as a treatment-selection biomarker. In contrast, high metabolic activity in the subgenual anterior cingulate cortex may be predictive of poor outcomes to both medication and psychotherapy, suggesting that nonstandard treatments may be pursued earlier in the treatment course. Although these findings will require replication before clinical adoption, they provide preliminary support for the concept that brain states can be measured and applied to the selection of a specific treatment most likely to be beneficial for an individual patient.
Keywords: antidepressive agent, biological marker, depression, effect modifier, individualized medicine, magnetic resonance imaging, patient outcome assessment, positron-emission tomography, psychotherapy
Abstract
Está en pleno desarrollo el empleo de técnicas de neuroimágenes para identificar las probabilidades del resultado del tratamiento en pacientes con trastorno depresivo mayor, Hay trabajos recientes que sugieren que la actividad metabólica en estado de reposo en la corteza fronto-insular pretratamiento puede distinguir entre pacientes con probabilidad de responder a psicoterapia o a medicación, y puede funcionar como un biomarcador para la selección del tratamiento. A la inversa, la alta actividad metabólica en la corteza angulada anterior subgenual puede predecir un pobre resultado tanto para los fármacos como para la psicoterapia, lo que sugiere que los tratamientos no habituales se podrían emplear más precozmente, Aunque estos hallazgos requieren ser replicados antes de incorporarse en la clínica, ellos aportan un soporte preliminar para el concepto que se refiere a que los estados cerebrales pueden ser medidos y empleados en la selección de un tratamiento específico que tenga la mayor probabilidad de beneficiar a un paciente individual.
Abstract
L'utilisation des techniques de neuro-imagerie pour identifier les résultats thérapeutiques chez des patients atteints de trouble dépressif majeur, se développe rapidement. D'après des travaux récents, l'activité métabolique de repos avant traitement dans le cortex fronto-insulaire pourrait différencier les patients susceptibles de répondre à une psychothérapie ou un médicament et pourrait représenter un biomarqueur du choix thérapeutique. Au contraire, une activité métabolique élevée dans le cortex angulaire antérieur ventral pourrait prédire de mauvais résultats, à la fois pour un traitement psychothérapeutique ou médicamenteux, indiquant de prévoir plus tôt dans le traitement la mise en place de mesures thérapeutiques non usuelles. Ces résultats demandent à être répétés et validés avant d'être adoptés en clinique, mais ils suggèrent le concept que des états cérébraux sont mesurables et peuvent être appliqués à la sélection d'un traitement spécifique plus à même de bénéficier à un patient donné.
Introduction
A leading goal in medical research is to improve the selection of particular treatments most likely to benefit individual patients. Matching individual patients to a specific treatment based on the individual's particular characteristics is called “personalized medicine” or “precision medicine.”1 By using individual characteristics to select the optimal intervention for a given patient from the outset of treatment, costs and side effects should be reduced and outcomes improved. This approach is distinctly different from the practice of selecting treatments based on clinical trial outcomes, in which the “average” improvement in the sample is used to identify efficacious treatments.
Personalized medicine has made major strides in the treatment of a growing number of medical conditions including infectious disease, cancer, and most recently, cystic fibrosis. Notable is the high impact in the treatment of breast cancer; distinguishing between tumors with and without high estrogen or epidural growth factor receptor expression is used to select specific chemotherapeutic agents, such as tamoxifen and trastuzumab, and even to avoid certain agents or their combination when certain combinations of receptors are present.2 Ideally, identification of such specific treatments stems from an understanding of the various pathophysiologies contributing to a disease. This personalized medicine approach is particularly important for diseases defined by syndromes, for which multiple etiopathological mechanisms are believed to produce a similar clinical phenotype. Major depressive disorder (MDD) is a classic example of such a heterogeneous syndrome. Unfortunately, extensive research efforts aiming to subcategorize MDD have thus far failed to identify reliable and distinct pathophysiologies. The problem is particularly pressing for MDD, given its prevalence and status as a leading cause of disability around the world.3
Defining the imaging signature of the depressed brain
Major depressive episodes occur in both MDD and bipolar disorder. As bipolar disorder has distinct neuroimaging characteristics that distinguish it from MDD,4,5 in this paper we limit our focus to MDD. Among the most consistent findings present in MDD patients compared with healthy controls are “hypofrontality” (reduced metabolism) of the dorsolateral prefrontal cortex (DLPFC) and increased activity in limbic regions, such as the amygdala and insula.6 Hyperactivity of the subcallosal cingulate cortex (SCC) is another replicated finding. However, a major caveat to such comparisons is that they are based on the average activity of the MDD sample compared with the controls and thus may mask important heterogeneity within MDD subjects.7 Indeed, some studies have found increased activity in the DLPFC, suggesting that different subgroups of patients may neurologically adapt to the depressive illness in divergent ways.8,9 Another commonly reported finding, reduced hippocampal volume in MDD patients, may also arise from averaging effects.10 Although a subgroup of MDD patients may demonstrate reduced hippocampal volumes, there is currently no biological reason to expect MDD patients to have increased volumes compared with controls. Thus, significant average volume differences between the MDD and control patients may be identified, even though the finding is driven only by those individuals with reduced volumes. Here again the heterogeneity of the sample is masked by use of a sample average measure.
Original efforts to improve MDD treatment employed the classic medical approach of defining the disease pathology, with the aim of developing treatments that would specifically target the identified pathophysiologic process. The first of these approaches was the dexamethasone suppression test,11 followed by identification of a broad array of putative endophenotypes.12 Most recently, the pathophysiologic role of inflammation has been recognized as a potential contributor to depressive illness,13 and the inclusion of patients with high levels of inflammation may confound results from studies examining neuroimaging or other predictors of treatment outcomes.14 Unfortunately, to date, none of the putative pathophysiologic indices have resulted in a replicated measure that can be used to select a specific treatment for an individual patient. In neuroimaging, efforts have been made to associate specific symptom clusters with neuroimaging signatures.15 Other investigators have narrowed their focus to core symptom constructs that comprise MDD, rather than MDD as a whole syndrome. Examples of these symptom constructs include anhedonia, reward processing, and emotion regulation.16,17 By selecting for a more homogenous sample of subjects who share a core symptom construct, researchers hope to better identify the neural circuitry underlying those constructs. However, such approaches can supply only a partial understanding of a patient experiencing a full syndromal major depressive episode, and thus the clinical application of these approaches for treatment selection may be limited.
Network models of major depressive disorder
Neuroimaging studies of MDD are increasingly focused on aberrant function within intrinsically connected networks that seem to mediate specific categories of mental activity. Although there is some divergence between studies in defining all the regions contributing to each network, the broad constructs are generally consistent. One such network is the default mode network (DMN), which includes the medial prefrontal cortex (mPFC), posterior cingulate cortex (PCC), inferior parietal cortex, and medial temporal lobe, and is most active during self-referential processing.18,19 Compared with healthy controls, MDD patients demonstrate changes in activity of the DMN both at rest18 and when engaged in an external task, particularly during tasks that involve processing negative information.20
Another well-characterized network is the central executive network (CEN), comprised primarily of the DLPFC and posterior parietal cortices. The CEN is engaged during externally oriented and goal-directed tasks requiring working memory and planning.21 The ventrolateral PFC and anterior insula (also referred to as the fronto-insular cortex), along with the dorsal anterior cingulate cortex (ACC), are key components of the salience network (SN), which functions to monitor for and orient to potentially relevant internal and external stimuli.21 Although some researchers associate the insular cortex with the DMN,22 others have identified the fronto-insular cortex as a key node in switching between the predominantly self-referentially focused DMN and the external task-focused CEN or task-positive networks.23-25
From remission to treatment selection
Efforts to define the neurobiology of MDD share the aim of improving treatment approaches to the illness. An alternative approach to identifying optimal treatment approaches in MDD is to work backwards from treatment response outcomes to the pretreatment imaging states. This approach is relatively nondirected about the underlying biology of the syndrome, but aims to identify imaging signatures that are associated with differential outcomes to treatments with differing mechanisms of action. In contrast to the symptom-construct reductionist approach (ie, focusing on a core de pressive symptom as the target of biological research), the primary goal of this treatment-based approach is to directly impact clinical care by finding biomarkers that indicate optimal treatment selection. Such treatment-based approaches may eventually provide information on the pathophysiology of disease, but their real value is in improving patient outcomes. In this manuscript, we will review the literature on such treatment-based research for guiding treatment selection and identify future directions and caveats to consider.
Predictors, moderators, and biomarkers
In medicine, the fundamental goals of the clinical encounter with an ill patient are to provide a diagnosis and a prognosis and to select a treatment for the illness. There is inconsistency in the literature regarding the use of terms associated with prediction of outcomes. For the purpose of this article, we differentiate between predictors and moderators. Prognosis stems from predictor (or “prognostic”) variables, ie, those baseline characteristics that have a main effect on outcome regardless of the treatment administered. For example, across all treatments, a chronic episode of depression predicts a poorer outcome compared with a nonchronic episode.26 In contrast, treatment selection depends on moderators, which are pretreatment variables that are associated with differential outcomes between two or more treatments.27 These moderators are of the greatest clinical value as they identify subgroups of patients within heterogeneous conditions who are most likely to benefit from a specific form of treatment. Another commonly used term, “mediator,” refers to a biological or psychological feature thought to contribute to the mechanism of improvement, identified by observing both a change in the feature during treatment and an association of that change with treatment outcome.
“Biomarker” is another term with a variety of uses depending on the specific meaning. Diagnostic biomarkers are measures that can be used to distinguish states of illness and health. These biomarkers do not necessarily inform treatment, but are to be used in making a diagnosis or to determine the subtype in a syndrome. In contrast, a treatment-selection biomarker (TSB) is a biological moderator that can be measured prior to initiating treatment to guide selection of the optimal treatment for particular patients.28 The TSB does not necessarily contribute to making a diagnosis, but is used to maximize treatment outcomes. Other types of biomarkers may be identified in which the degree of change in a biological factor occurring soon after initiating treatment could be used to predict likely treatment outcomes. Such biomarkers do not help select initial treatment, but have clinical value through identifying the utility of continuing an intervention early in the treatment course, thus obviating the need to wait for the full, longer treatment period to determine outcome.29
Neuroimaging biomarkers in major depressive disorder
There are many forms of neuroimaging that have the potential to be used as biomarkers in MDD. Positron emission tomography (PET) can be used to: (i) characterize resting-state metabolic signatures; or (ii) to measure the density of neurotransmitter receptors or transporters for which a radioligand exists. Magnetic resonance imaging (MRI) can be used to measure: (i) brain structure volume (structural MRI); (ii) white matter integrity and density [diffusion tensor imaging (DTI)]; or (iii) functional metabolic activity patterns (fMRI), either in the resting state or in response to a certain challenge or task. fMRI patterns reflect states of brain metabolic activity. Greater metabolic activity in a brain region is accompanied by increases in blood flow, which is detected as alterations within the magnetic field of the MRI scanner. Furthermore, fMRI may be used to examine activity in single brain regions or in coordinated temporal patterns of activity across multiple regions (functional connectivity MRI [fcMRI]).30
This article emphasizes neuroimaging treatment-related biomarkers for MDD, although there is certainly a need for diagnostic biomarkers in MDD, particularly to improve the accuracy of diagnosis in primary care settings. Comprehensive reviews and meta-analyses of neuroimaging predictors of treatment outcomes have recently been published.31,32 These reviews have reported a broad array of potential predictors, identifying a great deal of inconsistency in the results. These inconsistent results are not surprising given that the studies vary substantially on many factors, including patient sample characteristics, treatment types and duration, outcomes definitions, imaging modality, patient activity in the scanner (resting state versus task engagement), and image analysis approaches.
Here, we focus on select biomarkers that appear to be emerging across studies of MDD and that have theoretical support based on other imaging work. We emphasize imaging studies conducted on patients prior to a prospective treatment trial rather than crosssectional case-control studies of historical response/nonresponse, which are subject to a variety of selection biases. We place less weight on studies that investigate pre- to post-treatment changes in brain activity. Although these studies may refer to observed changes in regional activity as “predicting” treatment outcome, they are actually correlates of outcome, because the activity changes can be observed only after the outcome is known, true prediction is not possible from these analyses. These studies are of value in contributing to understanding mediators of change, but mediators do not necessarily serve as moderators of outcome.27 Finally, this review does not include studies in which patients were on medication at the time of their baseline predictor scan due to the effects of medication on neuroimaging measures.
The clinical practice of psychiatry would be substantially enhanced if a reliable TSB could be identified that could guide selection of the initial treatment (ie, a moderator of outcome). First-line treatments for MDD consist of either antidepressant medication or an evidence-based psychotherapy (though in some cases they are applied conjointly).33 These two types of treatments have fundamentally different mechanisms of action, which opens up the possibility that, in patients with MDD, specific brain states may be more or less likely to respond to one of these approaches. If these brain states can be reliably identified, then a TSB could be developed that indicates whether psychotherapy or medication represents the best treatment for particular patients, based on their brain state at the time of treatment initiation.
A second type of treatment biomarker would be one that does not indicate which treatment would likely work for a given patient, but rather identifies which patients are unlikely to benefit from standard MDD treatments (ie, a predictor or prognostic variable). This type of biomarker would indicate that the usual treatment approaches should be skipped and that interventions reserved for highly treatment-resistant patients, such as stimulation treatments (eg, repetitive transcranial magnetic stimulation [rTMS], deep brain stimulation, or electroconvulsive therapy [ECT]) or unconventional medications, should be used earlier in the treatment algorithm. In current clinical practice, applying the standard treatment algorithms of psychotherapy and multiple medication trials requires months before treatment resistance can be determined, making this type of non-responder biomarker arguably of the greatest clinical importance. Integrating biomarker predictors of non-response with the known clinical predictors of poor treatment outcome (eg, a chronic depressive episode or severe medical comorbidity) would save time and money, reduce patient suffering, and reduce the possibilities of despair and suicide.
Single versus multiple treatment modalities
The majority of MDD studies reporting neuroimaging moderators of treatment outcomes have used a single psychotherapeutic or pharmacologic intervention. These studies examine differences in the pretreatment imaging signal between patients who responded to a specific intervention versus those who did not. Without a comparison group, these studies cannot conclusively separate nonspecific predictors of outcome versus a treatment-specific moderator. Reviews of studies that examined regional pretreatment 2-[18F]-fluoro-2-deoxy-D-glucose PET (FDG-PET) metabolism as a predictor of outcome in studies of single treatments found inconsistent results, with the strongest finding being that higher levels of pregenual ACC metabolic activity predicted response to antidepressants and sleep deprivation.31,32,34 Although single-treatment modality imaging studies do not help answer the clinical question of what is the optimal type of intervention for an individual, they may provide supporting data toward understanding treatment response patterns for a specific modality.
More clinically informative are studies that compare two differing treatment options. A small number of imaging studies have examined predictors between two classes of antidepressant medication, but the results, to date, have been difficult to interpret and apply clinically.35-37 As all antidepressants modulate monoamine systems, studies looking to identify imaging predictors specific to individual classes of medications will be very challenging, given the early stage of imaging TSB research. More promising approaches compare interventions with highly divergent mechanisms, such as psychotherapy versus medication.9,28,38-41
Anterior insula metabolism as a treatment selection biomarker (moderator)
The insula is classically divided into three subcomponents that are associated with specific functions.42 The posterior regions of the insula predominantly process pain and viscerosensory sensation. The ventroanterior portion is involved in chemosensory (gustatory, olfactory) processing. In terms of the biology of MDD, the most important component is the dorsoanterior insula, which, in addition to its aforementioned role in the SN, also functions in processing risk, reward, consciousness, and performance monitoring.43,44
The insula's function as a convergence zone of multi-modal sensory processing and subjective state awareness positions it as a crucial hub for affective processing.42 Given the well-established biasing toward negatively valenced stimuli present in depressed patients,45 the fronto-insular cortex is positioned to potentially play a key role in perpetuating the depressed state. Imaging studies of MDD patients have found inconsistent results regarding the level of metabolic activity in the insula relative to healthy controls, both in the resting state and during emotion processing tasks.46,47 This inconsistency likely represents the heterogeneity between studies of the types of MDD patients enrolled. However, it is precisely this variability that opens the possibility of finding brain activity biomarkers that differentially predict treatment outcomes to distinct forms of treatment.
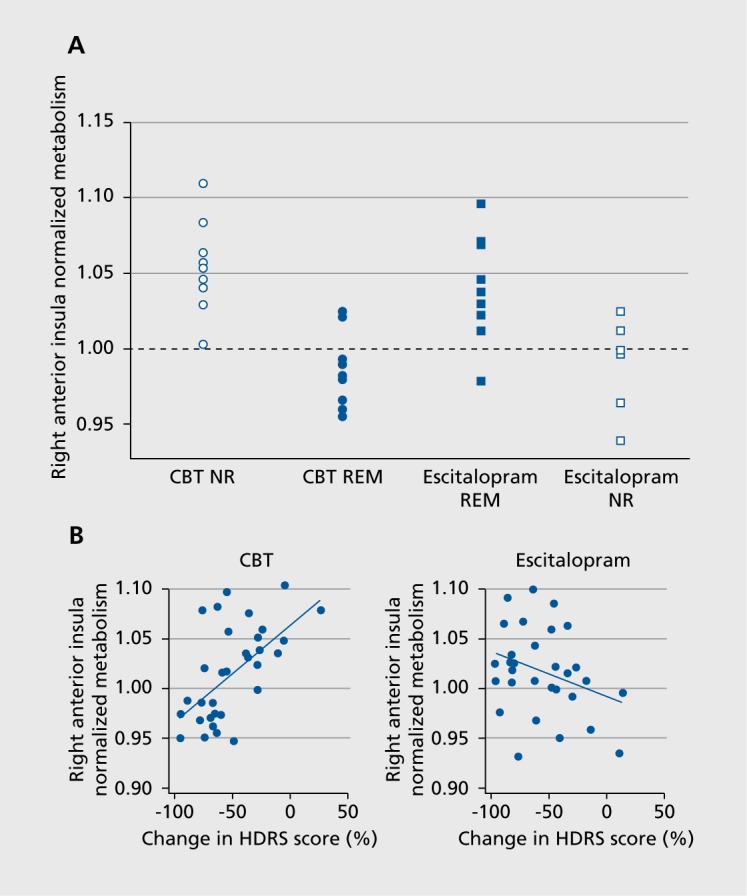
The potential value of insula metabolism as a predictive TSB is supported by findings from several research groups.48 Recently, the first comparative neuroimaging TSB that predicted differential outcomes to 12 weeks of randomly assigned treatment with either a structured psychotherapy (cognitive behavior therapy [CBT]) or antidepressant medication (escitalopram) was published.28 Eighty adults with DSM-IV-TR-defined MDD, aged 18 to 60, underwent pretreatment resting state FDG-PET scanning prior to their randomization to treatment. A total of 63 patients completed the 12 weeks of treatment and had a usable baseline PET scan for analysis. A total of 38 patients with clear outcomes (ie, meeting criteria for either remission, defined as a Hamilton Depression Rating Scale 17-item [HDRS] score of ≤7 at both weeks 10 and 12, or nonresponse, defined as a week 12 HDRS score of ≤30% decrease from baseline) were analyzed. To maximize signal detection, the 25 patients with unclear outcomes (ie, had a response >30% decrease from baseline, but short of full remission) were not used in defining the TSB.
In this analysis, a brain region was considered a potential TSB if it differentiated both the remitter-nonresponder differences (by treatment) and the escitalopram-CBT differences (by outcome, Figure 1A). Six brain regions met the TSB definition: right anterior insula (rAI), right inferior temporal cortex, right motor cortex, left premotor cortex, left amygdala, and left precuneus. Using the combination of these six regions as a predictor did not exceed the predictive utility of the rAI alone. Moreover, across all 63 completing patients, pretreatment metabolic activity in the rAI correlated with percentage reduction in HDRS scores for both CBT (positive correlation) and escitalopram (negative correlation, Figure 1B).
This study also included a second 12-week treatment phase for nonremitting patients. In this phase, patients who did not remit with their initial treatment with either CBT or escitalopram received the combination of these two treatments by continuing their initial treatment and adding the other treatment. A total of 30 patients entered this second phase, 27 of whom completed. The findings from the initial 12-week treatment phase were supported by findings from Phase 2. In this phase patients whose second (added) treatment matched the one indicated by the Phase 1 pre-treatment rAI TSB were more likely to remit than those whose second treatment did not match the TSB (53% vs 25%, respectively; risk ratio, 2.11, 95% confidence interval [CI], 0.59-7.52),49
In one of the few other imaging studies comparing treatment with psychotherapy (interpersonal therapy) or a selective serotonin reuptake inhibitor (SSRI; paroxetine), changes in insula activity emerged as the most statistically significant effect of treatment.38 In both groups, anterior insula metabolism increased after treatment; however, this study did not evaluate baseline metabolic activity as a predictor of outcome. Right ventrolateral PFC activity significantly decreased, but only in the paroxetine-treated patients.38
Support for the relevance of AI metabolism in somatic treatment outcome studies emerges from other studies. Greater insula reactivity to emotional stimuli at baseline predicted improvement to 4 weeks of treatment with venlafaxine or mirtazapine.50 AI metabolic activity was reduced after 6 weeks of effective paroxetine treatment.9,51,52 Poor response to rTMS was associated with reduced pretreatment metabolic activity in bilateral insula and ACC compared with healthy controls, providing partial support for the conceptualization that lower insula metabolism may serve as a biomarker for a form of MDD predictive of poor response to somatic treatments.53 In another rTMS study, response to low-frequency rTMS was correlated with reduced right AI and posterior insula cerebral blood flow after treatment.54
A meta-analysis of functional neuroimaging studies concluded that greater baseline insula (and extending into the right inferior frontal gyrus) and striatum activity is predictive of poorer treatment outcomes across treatments.32 More recently, greater anterior insula response to emotional stimuli predicted poor response to treatment with combination fluoxetine-olanzapine,55 and greater resting state metabolic activity in the anterior insula predicted poor response to vagus nerve stimulation.56 These findings are not necessarily in conflict with the results reviewed above. In the study by McGrath and colleagues described above, although good responses to CBT were predicted in the great majority of patients with low rAI activity, the converse did not hold as strongly (Figure 1). 28 That is, although higher rAI metabolism predicted better response to escitalopram than to CBT, many patients with elevated AI metabolism did not respond to the medication. A reasonable conclusion from these results is that elevated levels of insula activity are a marker for needing a more intensive intervention than psychotherapy, but that optimal treatment selection for these patients may require additional biomarkers beyond the insula state.
Figure 1. (A) Scatterplot of pretreatment 2-[18F]-fluoro-2-deoxyD-glucose positron emission tomography (PET) metabolic activity in the anterior insular cortex of individual patients remitting (REM) and not responding (NR) to treatment with either escitalopram or cognitive behavioral therapy (CBT). Normalized metabolic activity in the anterior insula subdivided patients into hypermetabolic and hypometabolic subgroups. (B) Insula activity correlated with changes in the Hamilton Depression Rating Scale (HDRS) score in the full cohort of subjects treated with either CBT or escitalopram oxalate. From reference 28: McGrath CL, Kelley ME, Holtzheimer PE, et al. Toward a neuroimaging treatment selection biomarker for major depressive disorder. JAMA Psychiatry. 2013:70:821-829.
Low insula resting state activity (and perhaps lower reactivity in challenge tasks) may be a particularly strong indicator that the patient may be a good candidate for psychotherapy. We posit that downregulation of insular activity in the setting of MDD represents intact emotion regulation circuitry, such that the processing of negative emotional states is susceptible to inhibitory controlling forces. With competent psychotherapeutic guidance, this intact regulatory network may be harnessed to permit even greater control, allowing the patient to process and learn from positive experiences, thereby leading to a resolution of the depressive episode. Support for this identification of a psychotherapy-specific form of MDD is found in the long-term follow-up studies of patients treated with psychotherapy or medication. Patients who benefit from psychotherapy showed sustained protection against relapses compared with patients who benefit from medication, but discontinue it after recovery.57
Hippocampal volume as a prognostic biomarker
Volumetric reductions in the hippocampus, basal ganglia, SCC, and orbitofrontal cortex are well-replicated findings in MDD patients versus healthy controls, and are particularly prominent among patients with more severe or chronic forms of depression.10 A recent neuroimaging meta-analysis identified reduced volume of the right hippocampus and reduced gray matter volume in the left DLPFC as structural imaging predictors of nonresponse to antidepressant medication.32 In a study of 46 MDD patients, volume reductions in the body/tail, but not the head, of the hippocampus predicted poorer remission rates after 8 weeks of antidepressant medication.58 In the largest study to date, smaller left hippocampal volumes predicted poorer response among 167 depressed inpatients treated with medication; this effect was primarily driven by patients with recurrent MDD.59 Smaller hippocampal volume is also associated with poorer treatment outcomes continuing through 2 or 3 years of follow-up.60,61 Small studies suggest that treatment with antidepressant medication62 or ECT63 is associated with increases in hippocampal volume. However, improvements in hippocampal volume have not reliably been associated with treatment response, resulting in uncertainty in determining whether reductions in hippocampal volume are a “state” or “trait” marker of MDD. Remarkably, no studies have evaluated the predictive value of hippocampal volume on outcome from MDD with CBT treatment, though a recent study found that CBT increased hippocampal volume among patients with post-traumatic stress disorder.64 Thus, of the structural imaging predictors, reduced hippocampal volume may serve as a nonspecific predictor of a poor treatment outcome, but the data, to date, do not demonstrate its value as a TSB.
Subcallosal cingulate cortex metabolism as a prognostic biomarker
The above study of 46 patients with MDD by McGrath and colleagues included a second phase that provided information for a nonresponse TSB (Figure 2).65 A total of 9 patients completed the combination treatment of phase 2 with a week 24 HDRS score ≤30% (compared with, their phase 1 baseline score). The patients who failed to respond to both psychotherapy (CBT) and escitalopram (P+SSRI =nonresponders) demonstrated a clear pattern of hyperactivity in the SCC at baseline compared with the 36 patients who had achieved remission either by the end of phase 1 or phase 2. These patients also demonstrated hyperactivity in the superior temporal sulcus.65 The importance of the elevated SCC metabolism in predicting poorer treatment outcomes has also been reported in several other studies of medications and CBT41,66,67 Furthermore, hyperactivity in this region is present among patients with multiple treatment failures, including nonresponse to ECT68 Patients with refractory MDD also demonstrate increased connectivity between the SCC and the DMN.69 The need for alternative interventions for patients demonstrating elevated pretreatment SCC activity is supported by studies demonstrating greater reduction in depressive symptoms among patients treated with anterior cingulotomy70 and those receiving deep brain stimulation to this region.68 Furthermore, clinical efficacy of TMS applied to separate regions of the DLPFC was predicted by the degree to which the DLPFC site and the SCC were anticorrelated.71
Figure 2. (A) Percent change in the Hamilton Depression Rating Scale (HDRS) after 12 weeks of treatment with either escitalopram or cognitive behavioral therapy (CBT) correlated with pretreatment metabolic activity in the subcallosal cingulate cortex (SCC) and superior temporal sulcus (STS). (B) Percentage change in HDRS correlated with pretreatment SCC and STS metabolic activity among patients completing 12 weeks of monotherapy followed by 12 weeks of combination escitalopram plus CBT. From reference 65: McGrath CL, Keliey ME, Dunlop BW, Holtzheimer PE, Craighead WE, Mayberg HS. Pretreatment brain states identify likely nonresponse to standard treatments for depression. Biol Psychiatry. 2014:76:527-535.

Integration of findings
Taken together, the results reviewed here provide support for the concept that pretreatment brain states, as identified by neuroimaging, may be used in the prediction of treatment outcomes for MDD. Although confirmatory studies are certainly required, evidence is converging that there is a brain state specifically predictive for response to psychotherapy, in particular CBT.
Psychotherapy-responsive depression may represent a brain state that is able to effectively adapt to negative emotional states (eg, induce downregulation of the anterior insula, amygdala, and SCC), and therefore, is capable of integrating externally presented information, such as psychotherapeutic interventions. This psychotherapy-responsive form of depression possesses the ability to utilize countervailing influences to reduce negative affective states and may require intact hippocampal functioning. In contrast, forms of MDD that do not improve with psychotherapy may reflect brain states that fail to adapt in the setting of negative emotion and cannot effectively incorporate psychotherapy to alter the mood state. These psychotherapy-nonresponsive depressions likely represent several forms of deregulated neurocircuitry, which will require some form of somatic intervention to induce sustained improvements in the affective state. High metabolic activity in the anterior insula may represent a TSB for treatment with medication, but there are likely other biological characteristics that will need to be identified to specifically determine whether a standard antidepressant or some other form of intervention (eg, a stimulation treatment) will be required for remission. Particularly in highly dysregulated cases, represented by patients with the greatest levels of SCC activation, medication may be least likely to be effective and alternative somatic treatments should be pursued. These hypotheses will require careful prospective testing before they are applied in routine clinical settings.
Considerations for future studies
Continued progress in the identification of neuroimaging TSBs requires careful consideration of patient selection and study design. Ideally, such studies will compare two active modalities, either with or without a placebo arm. Imaging from placebo-treated patients can provide information about the mediators of change with treatment and aspects of treatment outcomes shared across treatment types. However, placebo treatment is not an option in the clinical care of patients with MDD; thus, placebo arms are not a necessary component for studies in which the aim is to identify markers to help choose between active treatment options.
Defining treatment outcomes is an important aspect of analyses. Categorical outcomes (as opposed to group-level continuous outcomes, such as overall mean change or percent improvement) are the most appropriate outcome metric for TSB studies because the individual is the unit of analysis, although more sophisticated techniques using random regression models to determine a trajectory of change for each individual patient may allow for more sensitive analyses.16 For categorical outcomes, remission should be the standard for successful treatment, not response as typically defined (ie, ≥50% reduction from baseline score). Response as an outcome is vulnerable to regression to the mean effects and is a less meaningful clinical outcome, in that response short of remission is associated with ongoing role dysfunction and increased risk of depressive episode recurrence. Conversely, previous studies used to identify patients with unequivocal nonresponse have used a definition of ≤30% improvement from baseline.28,72 This standard diminishes regression to the mean effects, and patients who remain close to the illness severity required for study inclusion can be confidently believed to remain significantly ill.
An important aspect of using imaging to identify TSBs is that the results should hold true regardless of previous treatment history or stage of depression that characterizes participants. That is, a patient with advanced illness that is resistant to multiple medication and psychotherapy interventions should show an activity pattern consistent with a poor response to standard treatments. Of course, there are ethical concerns preventing the enrolment of patients in a study using a treatment to which they have already demonstrated a poor response, but the concept that remote prior treatment should not alter the TSB remains applicable.
An individual's TSB should be considered a state, as opposed to a trait, marker because the TSB may change over time depending on the patient's illness progression. A significant proportion of MDD patients who initially show good response to medication over time develop the need for increasingly complex medication regimens and may ultimately lose response to medication altogether. In such patients, the TSB is expected to change from indicating medication-responsiveness to a poor-outcome predictor.
Controlling for some illness-related factors may have a significant adverse effect on neuroimaging studies designed for treatment prediction. For example, controlling for baseline severity in assessing predictors of outcome may eliminate the very imaging difference that could identify treatment outcome differences. The goal of a predictive biomarker is to identify optimal treatments for patients presenting for clinical care, which will require studies to have reasonable generalizability. This need must be balanced against the fact that TSB development is in the early stages of research, so signal detection may require some measures to limit heterogeneity, such as exclusion of patients with significant medical or nondepressive psychiatric comorbidities. Given that active treatment may alter the imaging results, all participants in TSB research should have an ample washout period from any previous treatments prior to obtaining the baseline imaging. Antidepressant medication, regardless of response, may alter connectivity in insular, prefrontal, and subcortical regions.
The financial strains facing health care delivery across the globe, along with limited access to quality imaging systems, make it possible that even if a TSB with reliable accuracy is developed, adoption of neuroimaging to select treatments for patients with MDD may be limited. Thus, there is a need to explore and test simpler, nonimaging methods as part of neuroimaging studies to see if a nonimaging “bedside” surrogate test could be derived from the neuroimaging findings. Electroencephalography (EEG) is a tool with the potential to map on to imaging-based predictors of treatment outcome, and some preliminary investigations have used EEG in the service of response prediction.29,73-76 However, to pursue only research using nonimaging markers would be a mistake because imaging methods provide the most direct assessment of the organ that is the source of the illness. Given the relatively recent application of neuroimaging techniques to treatment outcome prediction in MDD, the progress to date is quite encouraging and portends significant advances in the near future.
Selected abbreviations and acronyms
- CBT
cognitive behavior therapy
- CEN
central executive network
- DLPFC
dorsolateral prefrontal cortex
- DMN
default mode network
- ECT
electroconvulsive therapy
- HDRS
Hamilton Depression Rating Scale
- MDD
major depressive disorder
- mPFC
medial prefrontal cortex
- PCC
posterior cingulate cortex
- PET
positron emission tomography
- rAI
right anterior insula
- rTMS
repetitive transcranial magnetic stimulation
- SCC
subcallosal cingulate cortex
- SN
salience network
- TSB
treatment selection biomarker
Contributor Information
Boadie W. Dunlop, Department of Psychiatry and Behavioral Sciences, Emory University School of Medicine, Atlanta, USA.
Helen S. Mayberg, Department of Psychiatry and Behavioral Sciences, Emory University School of Medicine, Atlanta, USA.
REFERENCES
- 1.National Institute of Mental Health. National Institute of Mental Health Strategic Plan. 2008. Available at: http://www.nimh.nih.gov/about/ strategic-planningreports/nimh-strategic-plan-2008. pdf. Accessed July 10, 2014. [Google Scholar]
- 2.Ellsworth RE., Decewicz DJ., Shriver CD., Ellsworth DL. Breast cancer in the personal genomics era. Curr Genomics. 2010;11:146–161. doi: 10.2174/138920210791110951. [DOI] [PMC free article] [PubMed] [Google Scholar]
- 3.Murray CJ., Vos T., Lozano R., et al Disability-adjusted life years (DALYs) for 291 diseases and injuries in 21 regions, 1990-2010: a systematic analysis for the Global Burden of Disease Study 2010. Lancet. 2012;380:2197–2223. doi: 10.1016/S0140-6736(12)61689-4. [DOI] [PubMed] [Google Scholar]
- 4.Cardosa de Almeida JR., Phillips ML. Distinguishing between unipolar depression and bipolar depression: Current and future clinical and neuroimaging perspectives. Biol Psychiatry. 2013;73:111–118. doi: 10.1016/j.biopsych.2012.06.010. [DOI] [PMC free article] [PubMed] [Google Scholar]
- 5.Phillips ML., Swartz HA. A critical appraisal of neuroimaging studies of bipolar disorder: toward a new conceptualization of underlying neural circuitry and a road map for future research. Am J Psychiatry. 2014;171:829–843. doi: 10.1176/appi.ajp.2014.13081008. [DOI] [PMC free article] [PubMed] [Google Scholar]
- 6.Ressler KJ., Mayberg HS. Targeting abnormal neural circuits in mood and anxiety disorders: from the laboratory to the clinic. Nat Neurosci. 2007;10:1116–1124. doi: 10.1038/nn1944. [DOI] [PMC free article] [PubMed] [Google Scholar]
- 7.Gillihan SJ., Parens E. Should we expect “neural signatures” for DSM diagnoses? J Clin Psychiatry. 2011;72:1383–1389. doi: 10.4088/JCP.10r06332gre. [DOI] [PubMed] [Google Scholar]
- 8.Drevets WC., Videen TO., Price JL., Preskorn SH., Carmichael ST., Raichle ME. A functional anatomical study of unipolar depression. J Neurosci. 1992;12:3628–3641. doi: 10.1523/JNEUROSCI.12-09-03628.1992. [DOI] [PMC free article] [PubMed] [Google Scholar]
- 9.Goldapple K., Segal Z., Garson C., et al Modulation of cortical-limbic pathways in major depression: treatment-specific effects of cognitive behavior therapy. Arch Gen Psychiatry. 2004;61:34–41. doi: 10.1001/archpsyc.61.1.34. [DOI] [PubMed] [Google Scholar]
- 10.Lorenzetti V., Allen NB., Fornito A., Yucel M. Structural brain abnormalities in major depressive disorder: a selective review of recent MRI studies. J Affect Disord. 2009;117:1–17. doi: 10.1016/j.jad.2008.11.021. [DOI] [PubMed] [Google Scholar]
- 11.Arana GW., Baldessarini RJ., Ornsteen M. The dexamethasone suppression test for diagnosis and prognosis in psychiatry. Commentary and review. Arch Gen Psychiatry. 1985;42:1193–1204. doi: 10.1001/archpsyc.1985.01790350067012. [DOI] [PubMed] [Google Scholar]
- 12.Hasler G., Drevets WC., Manji HK., Charney DS. Discovering endophenotypes for depression. Neuropsychopharmacology. 2004;29:1765–1781. doi: 10.1038/sj.npp.1300506. [DOI] [PubMed] [Google Scholar]
- 13.Miller AH., Maletic V., Raison CL. Inflammation and its discontents: the role of cytokines in the pathophysiology of major depression. Biol Psychiatry. 2009;65:732–741. doi: 10.1016/j.biopsych.2008.11.029. [DOI] [PMC free article] [PubMed] [Google Scholar]
- 14.Uher R., Tansey KE., Drew T., et al An inflammatory biomarker as a differential predictor of outcome of depression treatment with escitalopram and nortriptyline. Am J Psychiatry. 2014 Jul 14. Epub ahead of print. doi: 10.1176/appi.ajp.2014.14010094. [DOI] [PubMed] [Google Scholar]
- 15.Milak MS., Parsey RV., Keilp J., Oquendo MA., Malone KM., Mann JJ. Neuroanatomic correlates of psychopathologic components of major depressive disorder. Arch Gen Psychiatry. 2005;62:397–408. doi: 10.1001/archpsyc.62.4.397. [DOI] [PubMed] [Google Scholar]
- 16.Heller AS., Johnstone T., Peterson MJ., Kolden GG., Kalin NH., Davidson RJ. Increased prefrontal cortex activity during negative emotion regulation as a predictor of depression symptom severity trajectory over 6 months. JAMA Psychiatry. 2013;70:1181–1189. doi: 10.1001/jamapsychiatry.2013.2430. [DOI] [PMC free article] [PubMed] [Google Scholar]
- 17.Treadway MT., Pizzagalli DA. Imaging the pathophysiology of major depressive disorder - from localist models to circuit-based analysis. Biol Mood Anxiety Disord. 2014;4:5. doi: 10.1186/2045-5380-4-5. [DOI] [PMC free article] [PubMed] [Google Scholar]
- 18.Raichle ME., MacLeod AM., Snyder AZ., Powers WJ., Gusnard DA., Shulman GL. A default mode of brain function. Proc Natl Acad Sci USA. 2001;98:676–682. doi: 10.1073/pnas.98.2.676. [DOI] [PMC free article] [PubMed] [Google Scholar]
- 19.Buckner RL., Andrews-Hanna JR., Schacter DL. The brain's default network: anatomy, function, and relevance to disease. Ann N Y Acad Sci. 2008;1124:1–38. doi: 10.1196/annals.1440.011. [DOI] [PubMed] [Google Scholar]
- 20.Sheline Yl., Barch DM., Price JL., et al The default mode network and self-referential processes in depression. Proc Natl Acad Sci USA. 2009;106:1942–1947. doi: 10.1073/pnas.0812686106. [DOI] [PMC free article] [PubMed] [Google Scholar]
- 21.Seeley WW., Menon AF., Schatzberg AF., et al Dissociable intrinsic connectivity networks for salience processing and executive control. J Neurosci. 2007;27:2349–2356. doi: 10.1523/JNEUROSCI.5587-06.2007. [DOI] [PMC free article] [PubMed] [Google Scholar]
- 22.Cauda F., D'Agata F., Sacco K., Duca S., Geminiani G., Vercelli A. Functional connectivity of the insula in the resting brain. Neuroimage. 2011;55:823. doi: 10.1016/j.neuroimage.2010.11.049. [DOI] [PubMed] [Google Scholar]
- 23.Sridharan D., Levitin DJ., Menon V. A critical role for the right frontoinsular cortex in switching between central-executive and default-mode networks. Proc Natl Acad Sci U S A. 2008;105:12569–12574. doi: 10.1073/pnas.0800005105. [DOI] [PMC free article] [PubMed] [Google Scholar]
- 24.Menon V., Uddin LQ. Saliency, switching, attention and control: a network model of insula function. Brain Struct Funct. 2010;214:655–667. doi: 10.1007/s00429-010-0262-0. [DOI] [PMC free article] [PubMed] [Google Scholar]
- 25.Hamilton JP., Furman DJ., Chang C., Thomason ME., Dennis E., Gotlib IH. Default-mode and task positive network activity in major depressive disorder: implications for adaptive and maladaptive rumination. Biol Psychiatry. 2011;70:327–333. doi: 10.1016/j.biopsych.2011.02.003. [DOI] [PMC free article] [PubMed] [Google Scholar]
- 26.Fournier JC., DeRubeis RJ., Hollon SG., Shelton RC., Amsterdam JD., Gallop R. Prediction of response to medication and cognitive therapy in the treatment of moderate to severe depression. J Consult Clin Psychol. 2008;77:775–787. doi: 10.1037/a0015401. [DOI] [PMC free article] [PubMed] [Google Scholar]
- 27.Kraemer HC., Wilson GT., Fairburn CG., Agras WS. Mediators and moderators of treatment effects in randomized clinical trials. Arch Gen Psychiatry. 2002;59:877–884. doi: 10.1001/archpsyc.59.10.877. [DOI] [PubMed] [Google Scholar]
- 28.McGrath CL., Kelley ME., Holtzheimer PE., et al Toward a neuroimaging treatment selection biomarker for major depressive disorder. JAMA Psychiatry. 2013;70:821–829. doi: 10.1001/jamapsychiatry.2013.143. [DOI] [PMC free article] [PubMed] [Google Scholar]
- 29.Leuchter AF., Cook IA., Marangell LB., et al Comparative effectiveness of biomarkers and clinical indicators for predicting outcomes of SSRI treatment in Major Depressive Disorder: results of the BRITE-MD study. Psychiatry Res. 2009;169:124–131. doi: 10.1016/j.psychres.2009.06.004. [DOI] [PubMed] [Google Scholar]
- 30.Fox MD., Raichle ME. Spontaneous fluctuations in brain activity observed with functional magnetic resonance imaging. Nat Rev Neurosci. 2007;8:700–711. doi: 10.1038/nrn2201. [DOI] [PubMed] [Google Scholar]
- 31.Milak MS., Parsey RV., Lee L., et al Pretreatment regional brain glucose uptake in the midbrain on PET may predict remission from a major depressive episode after three months of treatment. Psychiatry Res. 2009;173:63–70. doi: 10.1016/j.pscychresns.2008.09.004. [DOI] [PMC free article] [PubMed] [Google Scholar]
- 32.Fu CH., Steiner H., Costafreda SG. Predictive neural biomarkers of clinical response in depression: a meta-analysis of functional and structural neuroimaging studies of pharmacological and psychological therapies. Neurobiol Dis. 2012;52:75–83. doi: 10.1016/j.nbd.2012.05.008. [DOI] [PubMed] [Google Scholar]
- 33.American Psychiatric Association. Practice Guideline for the Treatment of Patients With Major Depressive Disorder. 3rd ed. Arlington, VA: American Psychiatric Association; 2010. [Google Scholar]
- 34.Pizzagalli DA. Frontocingulate dysfunction in depression: toward biomarkers of treatment response. Neuropsychopharmacology. 2011;36:183–206. doi: 10.1038/npp.2010.166. [DOI] [PMC free article] [PubMed] [Google Scholar]
- 35.Little JT., Ketter TA., Kimbrell TA., et al Bupropion and venlafaxine responded differ in pretreatment regional cerebral metabolism in unipolar depression. Biol Psychiatry. 2005;57:220–228. doi: 10.1016/j.biopsych.2004.10.033. [DOI] [PubMed] [Google Scholar]
- 36.Wagner G., Koch K., Schachtzabel C., et al Differential effects of serotonergic and noradrenergic antidepressants on brain activity during a cognitive control task and neurofunctional prediction of treatment outcome in patients with depression. J Psychiatry Neurosci. 2010;35:247–257. doi: 10.1503/jpn.090081. [DOI] [PMC free article] [PubMed] [Google Scholar]
- 37.Frodl T., Scheuerecker J., Schoepf V., et al Different effects of mirtazapine and venlafaxine on brain activation: an open randomized controlled f MRI study. J Clin Psychiatry. 2011;72:448–457. doi: 10.4088/JCP.09m05393blu. [DOI] [PubMed] [Google Scholar]
- 38.Brody, Saxena S., Stoessel P., et al Regional brain metabolic changes in patients with major depression treated with either paroxetine or interpersonal therapy: preliminary findings. Arch Gen Psychiatry. 2001;58:631–640. doi: 10.1001/archpsyc.58.7.631. [DOI] [PubMed] [Google Scholar]
- 39.Martin SD., Martin E., Rai SS., Richardson MA., Royall R. Brain blood flow changes in depressed patients treated with interpersonal psychotherapy or venlafaxine hydrochloride: preliminary findings. Arch Gen Psychiatry. 2001;58:641–648. doi: 10.1001/archpsyc.58.7.641. [DOI] [PubMed] [Google Scholar]
- 40.Kennedy SH., Konarski JZ., Segal ZV., et al Differences in brain glucose metabolism between responders to CBT and venlafaxine in a 16-week randomized controlled trial. Am J Psychiatry. 2007;164:778–788. doi: 10.1176/ajp.2007.164.5.778. [DOI] [PubMed] [Google Scholar]
- 41.Konarski JZ., Kennedy SH., Segal ZV., et al Predictors of nonresponse to cognitive behavioural therapy or venlafaxine using glucose metabolism in major depressive disorder. J Psychiatry Neurosci. 2009;34:175–180. [PMC free article] [PubMed] [Google Scholar]
- 42.Chang LJ., Yarkoni T., Khaw MW., Sanfey AG. Decoding the role of the insula in human cognition: functional panellation and large-scale reverse inference. Cereb Cortex. 2013;23:739–749. doi: 10.1093/cercor/bhs065. [DOI] [PMC free article] [PubMed] [Google Scholar]
- 43.Craig AD. How do you feel - now? The anterior insula and human awareness. Nat Rev Neurosci. 2009;10:59–70. doi: 10.1038/nrn2555. [DOI] [PubMed] [Google Scholar]
- 44.Zhang W-N., Chang S-H., Guo L-Y., Zhang K-L., Wang J. The neural correlates of reward-related processing in major depressive disorder: a metaanalysis of functional magnetic resonance imaging studies. J Affect Disord. 2013;151:531–539. doi: 10.1016/j.jad.2013.06.039. [DOI] [PubMed] [Google Scholar]
- 45.Beck AT. The evolution of the cognitive model of depression and its neurobiological correlates. Am J Psychiatry. 2008;165:969–977. doi: 10.1176/appi.ajp.2008.08050721. [DOI] [PubMed] [Google Scholar]
- 46.Fitzgerald PB., Laird AR., Mailer J., Daskalakis ZJ. A meta-analytic study of changes in brain activation in depression. Hum Brain Mapp. 2008;29:683–695. doi: 10.1002/hbm.20426. [DOI] [PMC free article] [PubMed] [Google Scholar]
- 47.Delaveau P., Jabourian M., Lemogne C., Guionnet S., Bergouignan L., Fossati P. Brain effects of antidepressants in major depression: a metaanalysis of emotional processing studies. J Affect Disord. 2011;130:66–74. doi: 10.1016/j.jad.2010.09.032. [DOI] [PubMed] [Google Scholar]
- 48.Sliz D., Hawley S. Major Depressive disorder and alternations in insular cortical activity: a review of current functional magnetic imaging research. Front Hum Neurosci. 2012;6:323. doi: 10.3389/fnhum.2012.00323. [DOI] [PMC free article] [PubMed] [Google Scholar]
- 49.Dunlop BW., Kelley ME., McGrath CL., Craighead WE., Mayberg HS. Preliminary findings supporting insula metabolic activity as a predictor of outcome to psychotherapy and medication treatments for depression. J Neuropsychiatry Clin Neurosci. 2014. In press. doi: 10.1176/appi.neuropsych.14030048. [DOI] [PMC free article] [PubMed] [Google Scholar]
- 50.Samson AC., Meisezahl E., Scheuerecker J., et al Brain activation predicts treatment improvement in patients with major depressive disorder. J Psychiatr Res. 2011;35:1214–1222. doi: 10.1016/j.jpsychires.2011.03.009. [DOI] [PubMed] [Google Scholar]
- 51.Mayberg HS., Brannan SK., Tekell JL., et al Regional metabolic effects of fluoxetine in major depression: serial changes and relationship to clinical response. Biol Psychiatry. 2000;48:830–843. doi: 10.1016/s0006-3223(00)01036-2. [DOI] [PubMed] [Google Scholar]
- 52.Kennedy SH., Evans KR., Kruger S., et al Changes in regional brain glucose metabolism measured with positron emission tomography after paroxetine treatment of major depression. Am J Psychiatry. 2001;158:899–905. doi: 10.1176/appi.ajp.158.6.899. [DOI] [PubMed] [Google Scholar]
- 53.Paillere Martinet ML., Martinet JL., Ringuenet D., et al Baseline brain metabolism in resistant depression and response to transcranial magnetic stimulation. Neuropsychopharmacology. 2011;36:2710–2719. doi: 10.1038/npp.2011.161. [DOI] [PMC free article] [PubMed] [Google Scholar]
- 54.Kito S., Hasegawa T., Koga Y. Neuroanatomical correlates of therapeutic efficacy of low-frequency right prefrontal transcranial magnetic stimulation in treatment-resistant depression. Psychiatry Clin Neurosci. 2011;65:175–182. doi: 10.1111/j.1440-1819.2010.02183.x. [DOI] [PubMed] [Google Scholar]
- 55.Rizvi SJ., Salomons TV., Konarski JZ., et al Neural response to emotional stimuli associated with successful antidepressant treatment and behavioral activation. J Affect Disord. 2013;151:573–581. doi: 10.1016/j.jad.2013.06.050. [DOI] [PubMed] [Google Scholar]
- 56.Conway CR., Chibnall JT., Gangwani S., et al Pretreatment cerebral metabolic activity correlates with antidepressant efficacy of vagus nerve stimulation in treatment-resistant major depression: a potential marker for response? J Affect Disord. 2012;139:283–290. doi: 10.1016/j.jad.2012.02.007. [DOI] [PMC free article] [PubMed] [Google Scholar]
- 57.Craighead WE., Dunlop BW. Combination psychotherapy and antidepressant medication for depression: for whom, when and how. Ann Rev Psychol. 2014;65:267–300. doi: 10.1146/annurev.psych.121208.131653. [DOI] [PubMed] [Google Scholar]
- 58.MacQueen GM., Yucel K., Taylor VH., Macdonald K., Joffe R. Posterior hippocampal volumes are associated with remission rates in patients with major depressive disorder. Biol Psychiatry. 2008;64:880–883. doi: 10.1016/j.biopsych.2008.06.027. [DOI] [PubMed] [Google Scholar]
- 59.Samann PG., Hohn D., Chechko N., et al Prediction of antidepressant treatment response from gray matter volume across diagnostic categories. Eur Neuropsychopharmacoi. 2013;23:1503–1515. doi: 10.1016/j.euroneuro.2013.07.004. [DOI] [PubMed] [Google Scholar]
- 60.Frodl T., Jager M., Smajstrlova I., et al Effect of hippocampal and amygdala volumes on clinical outcomes in major depression: a 3-year prospective magnetic resonance imaging study. J Psychiatry Neurosci. 2008;33:423–430. [PMC free article] [PubMed] [Google Scholar]
- 61.Kronmuller KT., Pantel J., Kohler S., et al Hippocampal volume and 2-year outcome in depression. Br J Psychiatry. 2008;192:472–373. doi: 10.1192/bjp.bp.107.040378. [DOI] [PubMed] [Google Scholar]
- 62.Arnone E., McKie S., Elliott R., et al State-dependent changes in hippocampal grey matter in depression. Mol Psychiatry. 2013;18:1265–1272. doi: 10.1038/mp.2012.150. [DOI] [PubMed] [Google Scholar]
- 63.Tendolkar I., van Beek M., van Oostrom I., et al Electroconvulsive therapy increases hippocampal and amygdala volume in the therapy refractory depression: a longitudinal pilot study. Psychiatry Res: Neuroimaging. 2013;30:197–203. doi: 10.1016/j.pscychresns.2013.09.004. [DOI] [PubMed] [Google Scholar]
- 64.Levy-Gigi E., Szabo C., Kelemen O., Keri S. Association among clinical response, hippocampal volume, and FKBP5 gene expression in individuals with posttraumatic stress disorder receiving cognitive behavioral therapy. Biol Psychiatry. 2013;74:793–800. doi: 10.1016/j.biopsych.2013.05.017. [DOI] [PubMed] [Google Scholar]
- 65.McGrath CL., Kelley ME., Dunlop BW., Holtzheimer PE., Craighead WE., Mayberg HS. Pretreatment brain states identify likely nonresponse to standard treatments for depression. Biol Psychiatry. 2014;76:527–535. doi: 10.1016/j.biopsych.2013.12.005. [DOI] [PMC free article] [PubMed] [Google Scholar]
- 66.Siegle GJ., Carter CS., Thase ME. Use of FMRI to predict recovery from unipolar depression with cognitive behavior therapy. Am J Psychiatry. 2006;163:735–738. doi: 10.1176/ajp.2006.163.4.735. [DOI] [PubMed] [Google Scholar]
- 67.Siegle GJ., Thompson WK., Collier A., et al Toward clinically useful neuroimaging in depression treatment: prognostic utility of subgenual cingulate activity for determining depression outcome in cognitive therapy across studies, scanners, and patient characteristics. Arch Gen Psychiatry. 2012;69:913–924. doi: 10.1001/archgenpsychiatry.2012.65. [DOI] [PMC free article] [PubMed] [Google Scholar]
- 68.Mayberg HS., Lozano AM., Voon V., et al Deep brain stimulation for treatment-resistant depression. Neuron. 2005;45:651–660. doi: 10.1016/j.neuron.2005.02.014. [DOI] [PubMed] [Google Scholar]
- 69.Greicius MD., Flores BH., Menon V., et al Resting-state functional connectivity in major depression: abnormally increased contributions from subgenual cingulate cortex and thalamus. Biol Psychiatry. 2007;62:429–437. doi: 10.1016/j.biopsych.2006.09.020. [DOI] [PMC free article] [PubMed] [Google Scholar]
- 70.Dougherty DD., Weiss AP., Cosgrove GR., et al Cerebral metabolic correlates as potential predictors of response to anterior cingulotomy for treatment of major depression. J Neurosurg. 2003;99:1010–1017. doi: 10.3171/jns.2003.99.6.1010. [DOI] [PubMed] [Google Scholar]
- 71.Fox MD., Buckner RL., White MP., Greicius MD., Pascual-Leone A. Efficacy of transcranial magnetic stimulation targets for depression is related to intrinsic functional connectivity with the subgenual cingulate. Biol Psychiatry. 2012;72:595–603. doi: 10.1016/j.biopsych.2012.04.028. [DOI] [PMC free article] [PubMed] [Google Scholar]
- 72.Kocsis JH., Gelenberg AJ., Rothbaum BO., et al REVAMP Investigators. Cognitive behavioral analysis system of psychotherapy and brief supportive psychotherapy for augmentation of antidepressant nonresponse in chronic depression: the REVAMP Trial. Arch Gen Psychiatry. 2009;66:1178–1188. doi: 10.1001/archgenpsychiatry.2009.144. [DOI] [PMC free article] [PubMed] [Google Scholar]
- 73.Pizzagalli D., Pascual-Marqui RD., Nitschke JB., et al Anterior cingulate activity as a predictor of degree of treatment response in major depression: evidence from brain electrical tomography analysis. Am J Psychiatry. 2001;158:405–415. doi: 10.1176/appi.ajp.158.3.405. [DOI] [PubMed] [Google Scholar]
- 74.Bruder GE., Sedoruk JP., Stewart JW., McGrath PJ., Quitkin FM., Tenke CE. Electroencephalographic alpha measures predict therapeutic response to a selective serotonin reuptake inhibitor antidepressant: pre- and posttreatment findings. Biol Psychiatry. 2008;63:1171–1177. doi: 10.1016/j.biopsych.2007.10.009. [DOI] [PMC free article] [PubMed] [Google Scholar]
- 75.Tenke CE., Kayser J., Manna CG., et al Current source density measures of electroencephalographic alpha predict antidepressant treatment response. Biol Psychiatry. 2011;70:388–394. doi: 10.1016/j.biopsych.2011.02.016. [DOI] [PMC free article] [PubMed] [Google Scholar]
- 76.Rentzsch J., Adli M., Wiethoff K., Gomez-Carrillo de Castro A., Gallinat J. Pretreatment anterior cingulate activity predicts antidepressant treatment response in major depressive episodes. Eur Arch Psychiatry Clin Neurosci. 2014;264:213–223. doi: 10.1007/s00406-013-0424-1. [DOI] [PubMed] [Google Scholar]