

Abstract
Background:
The impact of honey or vinegar on several metabolic abnormalities has been studied separately, a mixture of these two ingredients known as honey vinegar syrup (HVS) has not been investigated previously so far. The aim of this study was to assess the impact of HVS consumption (Iranian's traditional syrup) on glycemic parameters and lipid profiles in healthy individuals.
Methods:
We conducted a 4-week, randomized, controlled, parallel study consisting of two groups of nonobese healthy volunteers. All subjects were asked to stay on their normal diet. Intervention group (n = 36) received a cup of HVS daily in the evening snack for 4-week (250 cc syrup contains 21.66 g honey vinegar). Assessments of fasting blood sugar (FBS), insulin, homeostasis model assessment of insulin resistance (HOMA-IR), total cholesterol (TC), triglyceride (TG), high-density lipoprotein cholesterol (HDL-C) and low-density lipoprotein cholesterol (LDL-C) were conducted at the baseline and after 4-week of study.
Results:
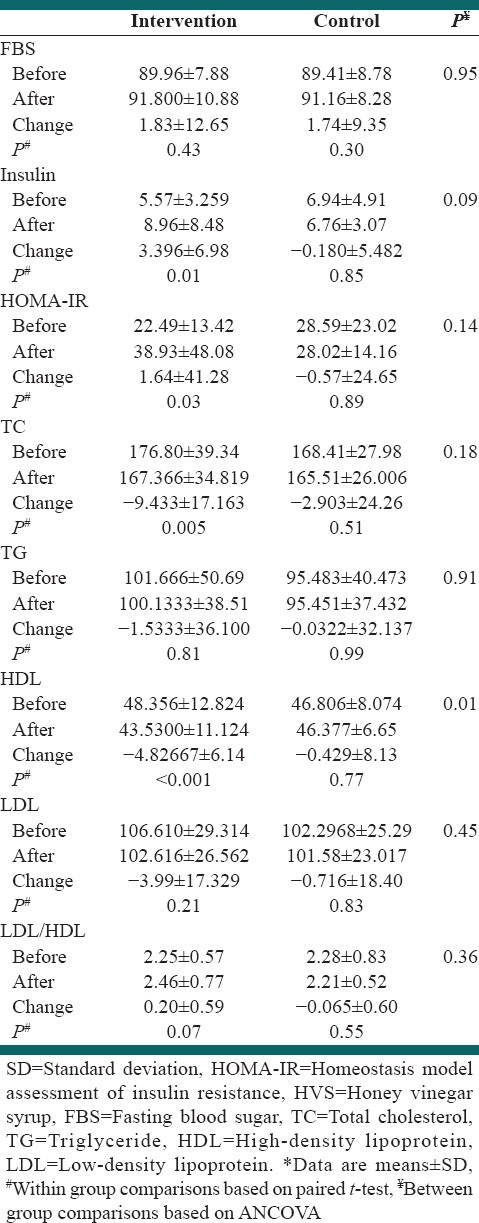
We observed no significant effect of HVS on FBS, HOMA-IR, LDL-C and TG. A significant effect of HVS was found on increasing fasting insulin and HOMA-IR and reduction in TC level only in intervention group (Δ =3.39 P = 0.01, Δ =1.65 P = 0.03, Δ = −9.43 P = 0.005, respectively). Changes of FBS, TG and LDL-C were 1.83 mg/dl, −1.53 mg/dl and − 3.99 mg/dl respectively in the intervention group. These changes were not significant. An unfavorable and significant reduction in HDL-C level was also observed between two groups (Δ = −4.82 P < 0.001 in the intervention group).
Conclusions:
Honey vinegar syrup increased fasting insulin level and decreased TC level in the intervention group. HVS had an unfavorable effect on HDL-C level. Further prospective investigations are warranted to confirm these findings.
Keywords: Blood glucose, honey vinegar syrup, lipid profile
INTRODUCTION
Abnormal blood sugar levels may be an indicator of a medical condition. The persistently high level of blood sugar is referred to as hyperglycemia. Long-term hyperglycemia causes health problems including heart disease, eye, kidney, and nerve damage.[1,2,3,4] Diabetes mellitus is the most prevalent disease related to failure of blood glucose regulation.[1] The prevalence of diabetes is increasing significantly around the world. It is estimated that the number of people with diabetes will alter from 171 million to 336 million in the period 2000–2030.[5]
Studies have shown that blood lipids are related to several factors such as lifestyle, diet, and smoking, body mass index (BMI), waist circumference, physical activity, sex and age.[6,7,8] Dyslipidemia consists of different abnormalities in lipid profile and is one of the main risk factors of several diseases such as cardiovascular disease (CVD), diabetes mellitus, hypertension, stroke, or acute pancreatitis.[9] Increasing its prevalence is related to unhealthy diet and lifestyle changes in the most developed and developing countries.[10,11,12]
Healthy diet and natural food are so important to prevention and sometime treatment of diseases. Finding the beneficial natural ingredients have been noted for prevention or treatment of metabolic disorders due to the expensive medications and the side effects of drugs.[13] Recently, findings showed vinegar and acetic acid (the main ingredient of vinegar) affect postprandial glucose, lipid profiles, blood pressure and weight loss.[14] Studies showed that consuming acetic acid and apple cider vinegar reduced postprandial glucose and insulin responses in healthy subjects, type 2 diabetes and insulin resistant.[15,16] In spite of the evidences that demonstrate the hypoglycemic effect of vinegar, lack of antihyperglycemic action of vinegar in humans was also reported.[17]
Honey is a natural food and a complex mixture of sugars, in which fructose and glucose are the main constituents.[18] Fructose is a monosaccharide, which is absorbed more slowly from the gastrointestinal tract compared to glucose, so after fructose consumption blood glucose increases slightly.[19] In addition, natural honey contains various antioxidants and according to previous findings, antioxidant intake was associated with weight loss in obese individuals and beneficial effects on risk factors of CVD.[20,21] Studies showed that honey intake considerably decreased postprandial glycemic response or had less adverse effect on plasma glucose than other sugars or sweeteners in diabetic patients.[22,23] However, another study reported that, 8-week consumption of natural honey led to a significant elevation in glycosylated hemoglobin (HbA1C) level, with no significant change in fasting blood sugar (FBS) concentration in diabetic patients.[24] This negative effect on HBA1C can be due to the high dose or high glucose: fructose constituent of honey administered.[19] Studies showed vinegar and honey had some beneficial effects on blood glucose or lipid profiles separately. However, their combinations have not been investigated previously. Honey vinegar syrup (HVS), a mixture of these two ingredients is traditional syrup. Sekanjabin is one of the oldest Iranian drinks, which is made by sugar and vinegar. Sucrose can cause lots of disorders. In the present study using natural honey as beneficial ingredient instead of sugar for preparation of HVS, may be useful. The aim of this study was to investigate the effect of HVS consumption on CVD risk factors in healthy individuals.
METHODS
Participants
The study included 72 healthy male and female volunteers (32 male and 40 female) aged 20–40 years and BMI between 18.5 and 30 kg/m2. Inclusion criteria were lack of medications affecting blood glucose, lipid or appetite, no acute or chronic diseases, no smoking, no pregnancy or lactation. The exclusion criteria were having special diet, honey or vinegar consumption during the last 3 months prior the study, pregnancy during the trial, diagnosis of disease (such as bacterial or viral infections, seasonal allergies or acute illnesses) and start drug therapy during the trial, volunteers with known/suspected drug or alcohol abuse, and allergies to HVS.
Demographic characteristics information was taken by questionnaire. All subjects signed an informed consent and withdrawal from the study was permitted at any time. This study was approved by Ethics Committee of the Isfahan University of Medical Sciences. This trial was registered at Iranian registry of clinical trials as 2014020816529N1.
Study design
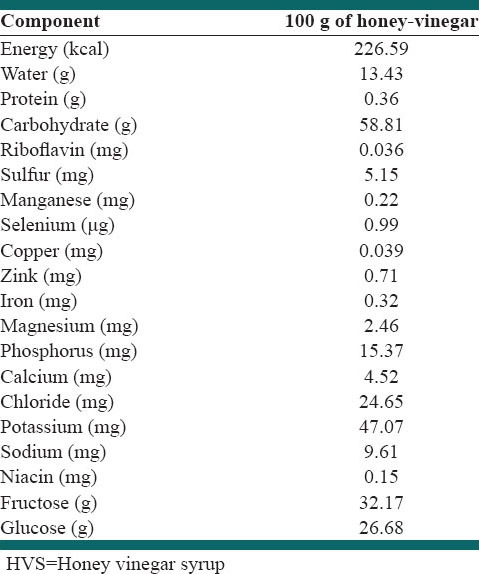
This study was designed as a controlled, randomized, parallel clinical trial. Eligible subjects were randomly assigned to either control (normal diet, n = 36) or intervention group (normal diet plus 21.66 g honey vinegar, n = 36) for 4-week. The main composition of honey vinegar is shown in Table 1. For the preparation of HVS, 1 kg of natural honey was mixed with six units of water (1500 ml) and was heated for a few minutes. Some branches of mint were added to the mixture and let the syrup to be condensed. Then 300 g of vinegar was added to the syrup, after fewer pimples were removed from the heat it is allowed to be cooled, and the syrup poured into the bottles and was delivered to the participants. Participants should mix two tablespoons of HVS (21.66 g) with 250 cc water and drank it in mid-morning or early evening snack daily for 4-week. We give 36 cups to participants in order to equalize water consumption. Weight of each HVS bottle was 649.8 g and had about 2220.3 kcal. Composition of honey included 17.1% water, 38.38% fructose, 31% glucose, 7.2% maltose, 1.5% sucrose, 4% oligosaccharides, 0.5% vitamins, minerals and enzymes, etc., Total phenolic content was 79.63 ± 0.11 mg gallic acid equivalents/100 g honey, total flavonoids content was 7.94 ± 0.54 mg catechin equivalents/100 g, hydroxymethylfurfural level was 3.80 ± 0.14 mg/100 g and diastase activity (α-amylase) values was 17.4 ± 2.8 Schade units. Dietary recommendations were based on healthy food pyramid. In both groups, we recommended 25–30% energy from lipid, 15% from protein, and 55–60% from carbohydrate. Intervention group received extra calories (about 75 kcal) via HVS consumption. During the study, we called or used text messages twice a week to remind participants to drink HVS regularly. Dietary assessments were performed using 3 days food records (2 days mid-week and a weekend day) 3 times during the study period: baseline, week 2 and week 4. We used NUTRITION 4 software (First DataBank, San Bruno, CA) for nutrient analysis.
Table 1.
Nutrient composition of the HVS
Biochemical assessments
Blood samples were obtained from fasting subjects between 7:00 and 8:00 A.M. after at least 12 h fasting at week 0 and week 4. Fasting blood glucose (FBS) and serum insulin was measured by colorimetry and enzyme-linked immunosorbent assay respectively. Total cholesterol (TC), high-density lipoprotein cholesterol (HDL-C) and triglycerides (TG) were measured by enzymatic methods using Autoanalyzer Elan 2000. Low-density lipoprotein cholesterol (LDL-C) concentration in serum samples with TG ≥ 400 mg/dl was calculated by Friedewald et al. formula.[25] We calculated the homeostasis model assessment of insulin resistance (HOMA-IR), with the following formula, HOMA-IR = (fasting insulin [mIU/L] × fasting glucose [mmol/L])/22.5.[26]
Statistical analysis
We used Kolmogorov–Smirnov test to examine the normal distribution of variables. Log transformation was applied for nonnormally distributed variables. Values in the text are mean ± standard deviation (quantitative variables) or percent (qualitative variables). Paired t-test was used to compare changes of variables within groups. Analysis of covariance was used to compare changes of variables included FBS, insulin, HOMA-IR, TC, TG, HDL-C, LDL-C and LDL-C/HDL-C between two groups of control and intervention. Independent sample t-test was used for assessing dietary intake between two groups. All data were analyzed by SPSS version 19. (SPSS Inc., USA) P < 0.05 was considered as significant.
RESULTS
Study subjects
Sixty-one of 72 volunteers (84.7%) completed the study. Eleven participants discontinued the study (overall attrition rate = 15.3%) for some reasons. Five participants (three in the intervention group and two in the control group) withdrew during the study period for personal reasons. Four participants (two in the intervention group and two in the control group) were excluded because of viral infection and drug therapy. One subject in the control group was excluded because of seasonal allergies and drug therapy and one participant from the intervention group withdrew because of adverse effects (nausea, stomach ache and headache). Thus, the main analyses were conducted with 61 participants (intervention group, n = 30; control group, n = 31) [Figure 1].
Figure 1.
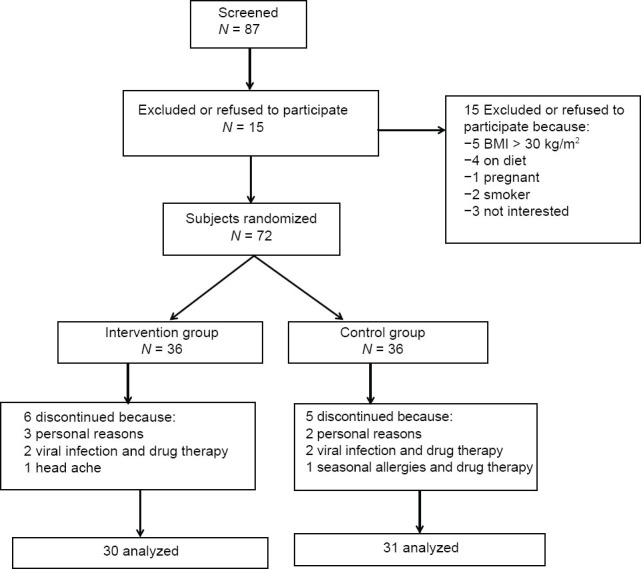
Summary of subject flow diagram
Baseline characteristics
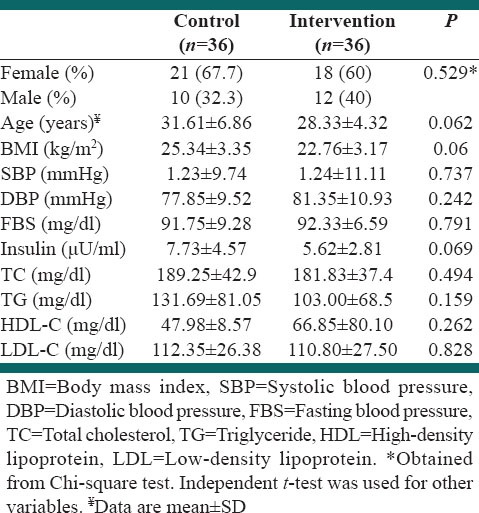
The baseline demographic characteristics of the 72 study subjects are summarized in Table 2. There were no differences between the groups for sex, educational status, job, age and daily caloric intake at baseline. No between-group differences were found in BMI and blood examination findings at baseline.
Table 2.
Baseline characteristics of the study population
Diets
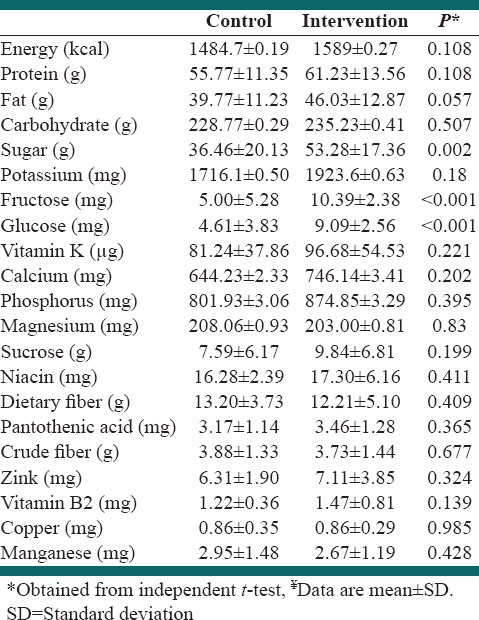
Dietary intake data from 16 subjects (22.22%) were not analyzed because they had incomplete food records (the attrition rate at the first, second and the third, three-dimensional food records was = 4.16, 8.69 and 11.11%, respectively). A total of 56 subjects (77.77%) were included in the analysis of dietary data (n = 27 and 29 from intervention and control groups, respectively). There were no significant differences in the energy and macronutrient intake. Sugar, fructose and glucose intake were higher among the intervention group [Table 3].
Table 3.
Dietary intakes of study participants throughout the study¥
Effects of honey vinegar syrup on clinical laboratory findings
Insulin level increased (P = 0.01) and HDL-C concentration (P < 0.001) and TC (P = 0.05) decreased in intervention group significantly. However, changes of insulin level and TC concentration were not significant between groups. The changes in HDL-C in two groups of intervention and control were different significantly. No significant changes were observed in FBS, TG and LDL-C [Table 4].
Table 4.
The effect of HVS on glucose metabolism and lipid profiles*
Adverse events
No serious adverse events were reported. Subjects who withdrew from the study did not report any serious adverse events as a reason for withdrawal. Only one participant reported nausea, stomach ache and headache after 15 days of HVS consumption.
DISCUSSION
This present pilot hypothesis-testing study investigated the potential effect of HVS on blood sugar and lipid profiles. HVS caused a significant reduction on HDL-C level.
Previous studies showed that the honey could ameliorate CVD or diabetes mellitus risk factors.[21,27] Honey contains some trace elements such as copper, zinc and antioxidants.[21]
Several studies have shown that supplementation with honey or vinegar improved serum lipids.[14,24] In contrast, we did not observe amelioration in HDL-C level. According to the previous findings, this adverse effect may be attributed to fructose. Our findings are in accordance with the previous human or experimental studies, which reported a negative significant effect of fructose on HDL-C level.
Study on patients with nonalcoholic fatty liver disease showed fructose consumer group had lower fasting serum glucoses, TG and HDL-C.[28] The short-term effect of oral fructose on patients with chronic kidney disease showed TC, LDL-C, and HDL-C significantly decreased and serum TG markedly increased.[29] Animal studies reported high-fructose feeding (60 g/100 g diet) to normal rats led to a significant increase in the concentrations of cholesterol, TG, very low-density lipoprotein cholesterol and LDL-C, but HDL-C reduced significantly.[30] High fructose diet in metabolic syndrome rats were accompanied by high significant increase in serum TG, TC and LDL-C while HDL-C level was significantly decreased as compared to control groups.[31]
Honey lowered serum concentrations of TG compared with diets of equal energy densities in rats. However, there were no significant differences in serum TC or HDL-C.[32]
Human studies showed fructooligosaccharides had no significant effect on lipid profiles.[33,34]
Our results are in disagreement with some other studies. Findings showed honey consumption decreased TC, LDL-C and increased HDL-C level in healthy subjects and patients with hyperlipidemia.[35] Similarly, a recent study found that 8-week honey intake significantly reduced TG, TC, LDL-C, LDL/HDL ratio and increased HDL-C compared with baseline in type 2 diabetic patients.[24] Another study indicated that the intake of vinegar along with high-fat meal increased TG levels significantly without any notable effect on other lipid variables. These results showed vinegar could ameliorate unfavorable effects of high-fat diet on lipid profiles.[36] According to findings, acetate in vinegar inhibits lipogenesis and stimulates fatty acid oxidation and may lead to beneficial effects on lipid profiles.[37]
The precise mechanism of action in not clearly understood, but it can be explained by the role of fructose in reducing the lipoprotein lipase (LPL) and lecithin cholesterol acyl transferase (LCAT) activities in plasma. LCAT, the enzyme that catalyzes esterification of cholesterol with FFAs, along with LPL is responsible for HDL-C synthesis. It plays an important role in cholesterol and TG transport and metabolism. Reduction in the LPL activity, an insulin-sensitive enzyme, in HVS consumers can be ascribed to the insulin resistance induced by fructose. Fructose can lead to a decrease in the ability of insulin to stimulate the activity of LPL.[30,38]
Our study showed both FBS and fasting insulin level increased in the intervention group. Bahrami et al. showed,[24] honey consumption for 8-week augmented HbA1C levels in patients with type 2 diabetes. Conversely, other studies reported honey consumption reduced serum glucose levels in nondiabetic subjects.[21,27] The major copound of HVS is honey (approximately 70% honey vs. 30% grape vinegar); therefore, its effects on variables can be explained mostly via the honey's ingredients. The underlying mechanisms of the effect of HVS can be explained via two different ways: (1) Honey reduces prostaglandin levels and elevates nitric oxide. It was demonstrated that PGE2 is one of the major physiological inhibitors of insulin and glucose-induced insulin secretion,[39] (2) polyphenol compounds of grape vinegar improve insulin sensitivity or insulin release via the PI3 kinase-Akt pathway and activate sirtuin-1 and adenine monophosphate kinase.[40]
In the present study, we did not find favorable changes in variables significantly. The interaction between nutrients in honey and grape vinegar may lead to different effect in comparison with consumption of honey and vinegar separately. Zinc and copper are two trace elements in honey that are important for insulin and glucose metabolism;[41,42] however, in the present study after HVS consumption we observed no favorable changes in these variables.
The strengths of this study are its randomized, controlled design; this study is the first trial that investigated the effect of honey and vinegar together.
The study design also had some limitations. The intervention period was relatively short, and blindness of our study was impossible.
CONCLUSIONS
We observed no significant effect of HVS on blood sugar and lipid profile between groups except for HDL-C. However, TC level decreased, and fasting insulin increased significantly in the intervention group. An unfavorable effect was observed in HDL-C level. Further studies are needed to confirm these findings and identify the responsible mechanisms.
ACKNOWLEDGEMENTS
This study was extracted from MSc dissertation which was approved by school of Nutrition and Food Sciences, Isfahan University of Medical Sciences (Project Number 392437)
Footnotes
Source of Support: Nil
Conflict of Interest: None declared.
REFERENCES
- 1.Association AD. Diagnosis and classification of diabetes mellitus. Diabetes Care. 2010;33:S62–9. doi: 10.2337/dc10-S062. [DOI] [PMC free article] [PubMed] [Google Scholar]
- 2.Field JB. Hypoglycemia. Definition, clinical presentations, classification, and laboratory tests. Endocrinol Metab Clin North Am. 1989;18:27–43. [PubMed] [Google Scholar]
- 3.Blackman JD, Towle VL, Lewis GF, Spire JP, Polonsky KS. Hypoglycemic thresholds for cognitive dysfunction in humans. Diabetes. 1990;39:828–35. doi: 10.2337/diab.39.7.828. [DOI] [PubMed] [Google Scholar]
- 4.Service FJ. Classification of hypoglycemic disorders. Endocrinol Metab Clin North Am. 1999;28:501–17. doi: 10.1016/s0889-8529(05)70085-2. [DOI] [PubMed] [Google Scholar]
- 5.Wild S, Roglic G, Green A, Sicree R, King H. Global prevalence of diabetes estimates for the year 2000 and projections for 2030. Diabetes Care. 2004;27:1047–53. doi: 10.2337/diacare.27.5.1047. [DOI] [PubMed] [Google Scholar]
- 6.Oancă ME, Azoicăi D, Manole A, Ivan A. Contributions at clinical epidemiological peculiarities of essential arterial hypertension knowledge in a geographical area from Moldavia, Romania. Rev Med Chir Soc Med Nat Iasi. 2007;111:1012–6. [PubMed] [Google Scholar]
- 7.Feng Y, Zang T, Xu X, Xu X. Familial aggregation of metabolic syndrome and its components in a large Chinese population. Obesity (Silver Spring) 2008;16:125–9. doi: 10.1038/oby.2007.22. [DOI] [PubMed] [Google Scholar]
- 8.Kolovou GD, Anagnostopoulou KK, Damaskos DS, Mihas C, Mavrogeni S, Hatzigeorgiou G, et al. Gender influence on postprandial lipemia in heterozygotes for familial hypercholesterolemia. Ann Clin Lab Sci. 2007;37:335–42. [PubMed] [Google Scholar]
- 9.Reiner Ž, Tedeschi-Reiner E. Prevalence and types of persistent dyslipidemia in patients treated with statins. Croat Med J. 2013;54:339–45. doi: 10.3325/cmj.2013.54.339. [DOI] [PMC free article] [PubMed] [Google Scholar]
- 10.Wietlisbach V, Paccaud F, Rickenbach M, Gutzwiller F. Trends in cardiovascular risk factors (1984-1993) in a Swiss region: Results of three population surveys. Prev Med. 1997;26:523–33. doi: 10.1006/pmed.1997.0167. [DOI] [PubMed] [Google Scholar]
- 11.Yamada M, Wong FL, Kodama K, Sasaki H, Shimaoka K, Yamakido M. Longitudinal trends in total serum cholesterol levels in a Japanese cohort, 1958-1986. J Clin Epidemiol. 1997;50:425–34. doi: 10.1016/s0895-4356(96)00423-4. [DOI] [PubMed] [Google Scholar]
- 12.Hodge AM, Dowse GK, Toelupe P, Collins VR, Zimmet PZ. The association of modernization with dyslipidaemia and changes in lipid levels in the Polynesian population of Western Samoa. Int J Epidemiol. 1997;26:297–306. doi: 10.1093/ije/26.2.297. [DOI] [PubMed] [Google Scholar]
- 13.Shishehbor F, Mansoori A, Sarkaki AR, Jalali MT, Latifi SM. Apple cider vinegar attenuates lipid profile in normal and diabetic rats. Pak J Biol Sci. 2008;11:2634–8. doi: 10.3923/pjbs.2008.2634.2638. [DOI] [PubMed] [Google Scholar]
- 14.Kondo T, Kishi M, Fushimi T, Ugajin S, Kaga T. Vinegar intake reduces body weight, body fat mass, and serum triglyceride levels in obese Japanese subjects. Biosci Biotechnol Biochem. 2009;73:1837–43. doi: 10.1271/bbb.90231. [DOI] [PubMed] [Google Scholar]
- 15.Johnston CS, Kim CM, Buller AJ. Vinegar improves insulin sensitivity to a high-carbohydrate meal in subjects with insulin resistance or type 2 diabetes. Diabetes Care. 2004;27:281–2. doi: 10.2337/diacare.27.1.281. [DOI] [PubMed] [Google Scholar]
- 16.Brighenti F, Castellani G, Benini L, Casiraghi MC, Leopardi E, Crovetti R, et al. Effect of neutralized and native vinegar on blood glucose and acetate responses to a mixed meal in healthy subjects. Eur J Clin Nutr. 1995;49:242–7. [PubMed] [Google Scholar]
- 17.Salbe AD, Johnston CS, Buyukbese MA, Tsitouras PD, Harman SM. Vinegar lacks antiglycemic action on enteral carbohydrate absorption in human subjects. Nutr Res. 2009;29:846–9. doi: 10.1016/j.nutres.2009.10.021. [DOI] [PubMed] [Google Scholar]
- 18.Al-Waili N, Salom K, Al-Ghamdi A, Ansari MJ, Al-Waili A, Al-Waili T. Honey and cardiovascular risk factors, in normal individuals and in patients with diabetes mellitus or dyslipidemia. J Med Food. 2013;16:1063–78. doi: 10.1089/jmf.2012.0285. [DOI] [PubMed] [Google Scholar]
- 19.Erejuwa OO, Sulaiman SA, Wahab MS. Honey – A novel antidiabetic agent. Int J Biol Sci. 2012;8:913–34. doi: 10.7150/ijbs.3697. [DOI] [PMC free article] [PubMed] [Google Scholar]
- 20.Bogdanov S, Jurendic T, Sieber R, Gallmann P. Honey for nutrition and health: A review. J Am Coll Nutr. 2008;27:677–89. doi: 10.1080/07315724.2008.10719745. [DOI] [PubMed] [Google Scholar]
- 21.Yaghoobi N, Al-Waili N, Ghayour-Mobarhan M, Parizadeh SM, Abasalti Z, Yaghoobi Z, et al. Natural honey and cardiovascular risk factors; effects on blood glucose, cholesterol, triacylglycerole, CRP, and body weight compared with sucrose. ScientificWorldJournal. 2008;8:463–9. doi: 10.1100/tsw.2008.64. [DOI] [PMC free article] [PubMed] [Google Scholar]
- 22.Shambaugh P, Worthington V, Herbert JH. Differential effects of honey, sucrose, and fructose on blood sugar levels. J Manipulative Physiol Ther. 1990;13:322–5. [PubMed] [Google Scholar]
- 23.Samanta A, Burden AC, Jones GR. Plasma glucose responses to glucose, sucrose, and honey in patients with diabetes mellitus: An analysis of glycaemic and peak incremental indices. Diabet Med. 1985;2:371–3. doi: 10.1111/j.1464-5491.1985.tb00654.x. [DOI] [PubMed] [Google Scholar]
- 24.Bahrami M, Ataie-Jafari A, Hosseini S, Foruzanfar MH, Rahmani M, Pajouhi M. Effects of natural honey consumption in diabetic patients: An 8-week randomized clinical trial. Int J Food Sci Nutr. 2009;60:618–26. doi: 10.3109/09637480801990389. [DOI] [PubMed] [Google Scholar]
- 25.Friedewald WT, Levy RI, Fredrickson DS. Estimation of the concentration of low-density lipoprotein cholesterol in plasma, without use of the preparative ultracentrifuge. Clin Chem. 1972;18:499–502. [PubMed] [Google Scholar]
- 26.Matthews DR, Hosker JP, Rudenski AS, Naylor BA, Treacher DF, Turner RC. Homeostasis model assessment: Insulin resistance and beta-cell function from fasting plasma glucose and insulin concentrations in man. Diabetologia. 1985;28:412–9. doi: 10.1007/BF00280883. [DOI] [PubMed] [Google Scholar]
- 27.Abdulrhman M, El-Hefnawy M, Hussein R, El-Goud AA. The glycemic and peak incremental indices of honey, sucrose and glucose in patients with type 1 diabetes mellitus: Effects on C-peptide level-a pilot study. Acta Diabetol. 2011;48:89–94. doi: 10.1007/s00592-009-0167-7. [DOI] [PubMed] [Google Scholar]
- 28.Abdelmalek MF, Suzuki A, Guy C, Unalp-Arida A, Colvin R, Johnson RJ, et al. Increased fructose consumption is associated with fibrosis severity in patients with nonalcoholic fatty liver disease. Hepatology. 2010;51:1961–71. doi: 10.1002/hep.23535. [DOI] [PMC free article] [PubMed] [Google Scholar]
- 29.Zawiasa A, Nowicki M. Acute effects of fructose consumption on uric acid and plasma lipids in patients with impaired renal function. Metabolism. 2013;62:1462–9. doi: 10.1016/j.metabol.2013.05.020. [DOI] [PubMed] [Google Scholar]
- 30.Thirunavukkarasu V, Anitha Nandhini AT, Anuradha CV. Effect of alpha-lipoic acid on lipid profile in rats fed a high-fructose diet. Exp Diabesity Res. 2004;5:195–200. doi: 10.1080/15438600490486778. [DOI] [PMC free article] [PubMed] [Google Scholar]
- 31.Al-Rasheed N, Al-Rasheed N, Bassiouni Y, Faddah L, Mohamad AM. Potential protective effects of Nigella sativa and Allium sativum against fructose-induced metabolic syndrome in rats. J Oleo Sci. 2014;63:839–48. doi: 10.5650/jos.ess14027. [DOI] [PubMed] [Google Scholar]
- 32.Nemoseck TM, Carmody EG, Furchner-Evanson A, Gleason M, Li A, Potter H, et al. Honey promotes lower weight gain, adiposity, and triglycerides than sucrose in rats. Nutr Res. 2011;31:55–60. doi: 10.1016/j.nutres.2010.11.002. [DOI] [PubMed] [Google Scholar]
- 33.Giacco R, Clemente G, Luongo D, Lasorella G, Fiume I, Brouns F, et al. Effects of short-chain fructo-oligosaccharides on glucose and lipid metabolism in mild hypercholesterolaemic individuals. Clin Nutr. 2004;23:331–40. doi: 10.1016/j.clnu.2003.07.010. [DOI] [PubMed] [Google Scholar]
- 34.Luo J, Van Yperselle M, Rizkalla SW, Rossi F, Bornet FR, Slama G. Chronic consumption of short-chain fructooligosaccharides does not affect basal hepatic glucose production or insulin resistance in type 2 diabetics. J Nutr. 2000;130:1572–7. doi: 10.1093/jn/130.6.1572. [DOI] [PubMed] [Google Scholar]
- 35.Al-Waili NS. Natural honey lowers plasma glucose, C-reactive protein, homocysteine, and blood lipids in healthy, diabetic, and hyperlipidemic subjects: Comparison with dextrose and sucrose. J Med Food. 2004;7:100–7. doi: 10.1089/109662004322984789. [DOI] [PubMed] [Google Scholar]
- 36.Yun SN, Ko SK, Lee KH, Chung SH. Vinegar-processed ginseng radix improves metabolic syndrome induced by a high fat diet in ICR mice. Arch Pharm Res. 2007;30:587–95. doi: 10.1007/BF02977653. [DOI] [PubMed] [Google Scholar]
- 37.Yamashita H, Fujisawa K, Ito E, Idei S, Kawaguchi N, Kimoto M, et al. Improvement of obesity and glucose tolerance by acetate in Type 2 diabetic Otsuka Long-Evans Tokushima Fatty (OLETF) rats. Biosci Biotechnol Biochem. 2007;71:1236–43. doi: 10.1271/bbb.60668. [DOI] [PubMed] [Google Scholar]
- 38.Anurag P, Anuradha CV. Metformin improves lipid metabolism and attenuates lipid peroxidation in high fructose-fed rats. Diabetes Obes Metab. 2002;4:36–42. doi: 10.1046/j.1463-1326.2002.00178.x. [DOI] [PubMed] [Google Scholar]
- 39.Cheng H, Straub SG, Sharp GW. Protein acylation in the inhibition of insulin secretion by norepinephrine, somatostatin, galanin, and PGE2. Am J Physiol Endocrinol Metab. 2003;285:E287–94. doi: 10.1152/ajpendo.00535.2002. [DOI] [PubMed] [Google Scholar]
- 40.Park CE, Kim MJ, Lee JH, Min BI, Bae H, Choe W, et al. Resveratrol stimulates glucose transport in C2C12 myotubes by activating AMP-activated protein kinase. Exp Mol Med. 2007;39:222–9. doi: 10.1038/emm.2007.25. [DOI] [PubMed] [Google Scholar]
- 41.Sitasawad S, Deshpande M, Katdare M, Tirth S, Parab P. Beneficial effect of supplementation with copper sulfate on STZ-diabetic mice (IDDM) Diabetes Res Clin Pract. 2001;52:77–84. doi: 10.1016/s0168-8227(00)00249-7. [DOI] [PubMed] [Google Scholar]
- 42.Song MK, Hwang IK, Rosenthal MJ, Harris DM, Yamaguchi DT, Yip I, et al. Antidiabetic actions of arachidonic acid and zinc in genetically diabetic Goto-Kakizaki rats. Metabolism. 2003;52:7–12. doi: 10.1053/meta.2003.50031. [DOI] [PubMed] [Google Scholar]