Figure 3.
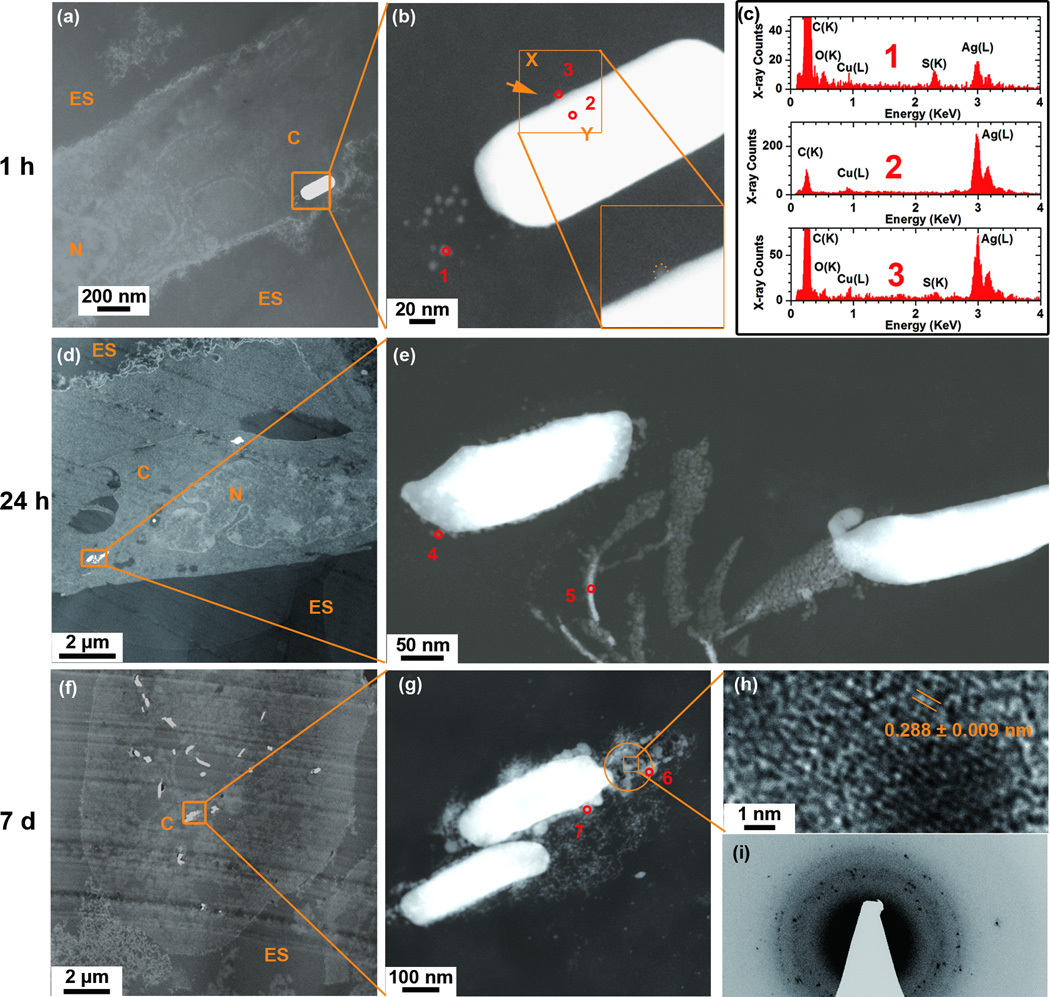
Changes in the morphology and composition of the AgNWs as a function of time after their uptake by TT1 epithelial cells at 1 h (a-c), and at 24 h (d-e) and 7 days (f-i) following the pulsed exposure, using unstained cell sections. (a) HAADF-STEM image of an AgNW inside the cell cytoplasm showing particles surrounding the tip of the AgNW. (b) A corresponding higher resolution HAADF-STEM image depicts the boxed area in (a). The insert in (b) shows a higher magnification image of the AgNW edge. (c) STEM-EDX spectra taken from corresponding areas 1–3 marked in (b). (d-e) HAADF-STEM images where image (e) depicts the boxed area in (d). (f-i) HAADF-STEM images where (g) depicts the boxed area in (f). (h) An HRTEM image of the boxed area in image (g). (i) SAED pattern from the circled area in (g) using a selected area aperture size of ~130 nm. STEM-EDX spectra collected from areas 4–7 marked in (e) and (g) are presented in supplementary, Figure S2.

