1. INTRODUCTION
Noninvasive evaluation of the electrical status of the heart and noninvasive diagnosis of cardiac arrhythmias are still based on the standard ECG, which records signals on the body surface, far away from the heart. The ECG has been a most useful clinical tool over more than 100 years. However, because it records the reflection of cardiac excitation as seen far from the heart at a limited number of sites, it lacks sensitivity and specificity and its spatial resolution is very low. Moreover, each individual ECG electrode records the integrated signal generated by activity over the entire heart1,2. Consequently, geometrical information on cardiac location of electrophysiologic events (e.g., a focus of focal arrhythmia, or the circuit of a reentrant arrhythmia) is lost in the ECG. To overcome these limitations, invasive mapping techniques, using intra-cardiac catheters, have been developed and used extensively for diagnosis and guidance of therapy. Many arrhythmias require that mapping be conducted simultaneously over the atria or ventricles with sufficient spatial resolution and continuously in time over a sufficiently long duration. These requirements cannot be met with current invasive, catheter-based mapping techniques. Also, the risk, complexity and cost of invasive mapping limit its application for arrhythmic risk stratification and repeated follow-up tests following therapy. Clearly, a method for noninvasive mapping of the heart's electrical activity is much desired; it would serve cardiac electrophysiology (EP) in a similar role to that of established noninvasive imaging modalities (CT, MRI, and ultrasound) that are used extensively in the practice of modern medicine.
Motivated by this need, Electrocardiographic Imaging (ECGI) was developed in the Rudy laboratory for application in cardiac patients3. ECGI (also called Electrocardiographic Mapping, ECM) reconstructs potentials, electrograms, activation sequences (isochrones) and repolarization patterns on the heart surface. The reconstruction is performed simultaneously over the entire heart and is done continuously on a beat-by-beat basis. In this review article, we provide a brief description of the ECGI procedure and selected previously published examples of its application in important clinical conditions, including heart failure and cardiac resynchronization therapy (CRT)4,5,6, atrial arrhythmias7,8,9, and ventricular tachycardia (VT)10. All reported studies were approved by the Institutional Review Board of the participating institutions (University Hospitals of Cleveland, the Cleveland Clinic and Washington University in St. Louis) and informed consent was obtained from all patients.
2. THE ECGI METHOD
ECGI computes potentials on the epicardial surface of the heart from recorded body surface potentials, a procedure that solves the inverse problem of electrocardiography, formulated in terms of potentials2,11,12; (the forward problem computes body surface potentials from epicardial potentials). In mathematical terms, this constitutes an inverse solution to Laplace's equation, which describes the electric potential field in the volume between the heart surface and the body surface. The inverse problem is ill-posed, meaning that even small errors in the measured data (measurement noise, uncertainty in electrode positions) can result in very large errors in the computed epicardial potentials. To suppress these errors, we have applied two different computational schemes in the ECGI application: Tikhonov regularization13 (a method that imposes constraints on the solution) and the generalized minimal residual (GMRes) iterative technique14. From the time sequence of computed epicardial potentials, ECGI constructs electrograms (EGMs) at many locations on the epicardium and from these the epicardial activation sequence (isochrones) and repolarization pattern.
In addition to the electrocardiographic potential over the entire torso surface, the ECGI algorithm requires knowledge of the geometries of the heart and torso surfaces. To obtain the torso potentials, 250 electrodes mounted on strips or in a vest are applied to the patient's torso (both anterior and posterior) and connected to a mapping system (Figure 1). The electrodes are sampled at 1ms intervals. Each electrode contains a marker that is visible in a CT scan. The patient undergoes thoracic non-contrast gated CT scan with axial resolution of 3mm, providing the epicardial geometry and torso electrode positions in the same frame of reference. The recorded torso potential and CT-derived geometrical information provide the input data for the ECGI algorithm. The computation of epicardial potentials, EGMs and activation/repolarization sequences is performed during a single beat and does not require accumulating data from many beats. This property makes it possible to image non-sustained and polymorphic arrhythmias, and arrhythmias that are not hemodynamically tolerated. It should be mentioned that we use very low radiation during the CT scan (less than 2 rads) and this is further decreasing with the improving CT technology. For longitudinal studies over time, we only obtain one CT scan at the first ECGI procedure. We have used MRI instead of CT in subjects without implanted devices; once it becomes safe to apply MRI in the presence of such devices, the use of MRI could be expanded. It is also conceivable that in the future high quality 3-dimensional echocardiography could be used to obtain the geometry.
Figure 1.
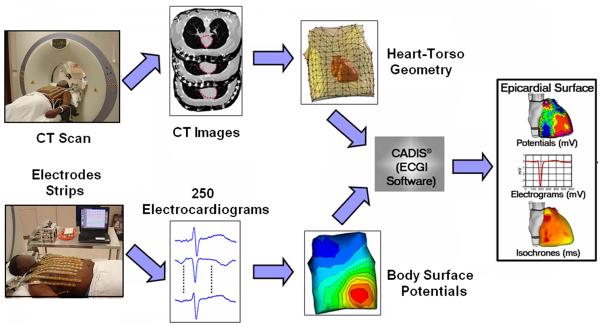
The ECGI procedure. Bottom: recording the body surface electric data with 250 electrodes. Top: obtaining the geometric data using CT. The ECGI software algorithms combine the electric and geometric data to produce maps of potentials, electrograms, activation and repolarization on the epicardial surface of the heart. (Adapted from Ramanathan C, Ghanem RN, Jia P, Ryu K, Rudy Y. Noninvasive electrocardiographic imaging for cardiac electrophysiology and arrhythmia. Nat Med. 2004;10:422–428; with permission.)
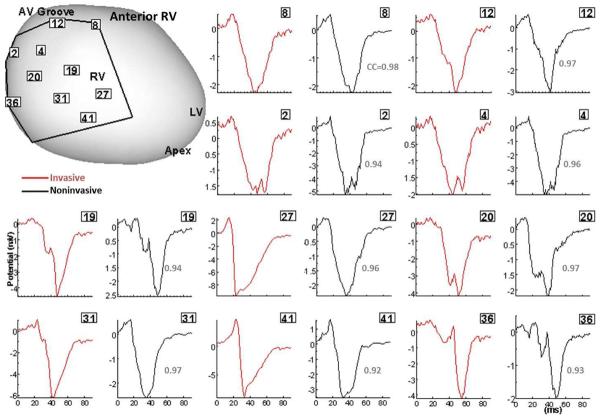
ECGI has been validated extensively under different physiological and pathological conditions in animal models, including a human-shaped torso-tank with a perfused dog heart suspended in the correct anatomical position15–19. In this setup, torso potentials (the ECGI input) were measured simultaneously with epicardial potentials that provided a “gold standard” for evaluating the accuracy of ECGI. Experiments were conducted in normal and infarcted hearts during sinus rhythm, multiple-site pacing, and reentrant VT. Correlation coefficients between ECGI generated and directly measured epicardial EGMs were > 0.9 for 72% of all epicardial locations, indicating very good agreement. Validation in humans included comparison to direct intra-operative mapping in open heart surgery patients during sinus rhythm and RV epicardial and endocardial pacing (Figure 2)20.
Figure 2.
Validation of ECGI in patients undergoing intraoperative cardiac mapping (sinus rhythm). Invasive (red) and noninvasive ECGI reconstructed (black) QRS epicardial electrograms from corresponding positions on anterior RV (framed numbers) are shown side by side. Correlation coefficients (CC) are provided for each pair. The intraoperative recording patch boundaries and electrode positions are marked on the heart image. Similar results were obtained for posterior LV. RV, right ventricle; LV, left ventricle; LAD, left anterior descending coronary artery; AV, atrialventricular. (From Ghanem RN, Jia P, Ramanathan C, Ryu K, Markowitz A, Rudy Y. Noninvasive Electrocardiographic Imaging (ECGI): comparison to intraoperative mapping in patients. Heart Rhythm. 2005;2:339–354; with permission.)
There is a need to emphasize that ECGI is not body surface potential mapping (BSPM), as there is confusion in the literature regarding the difference between the two and these terms are sometimes used interchangeably. BSPM is only an extension of the body surface ECG, accomplished through the application of a large number of electrodes to the torso surface. The output of BSPM is potentials on the body surface, not on the heart. In contrast, ECGI provides cardiac electrophysiologic (EP) data on the heart and maps cardiac electrical excitation in relation to the heart's anatomy.
3. THE EP SUBSTRATE OF HEART FAILURE
Delayed ventricular activation, predominantly of the left ventricle (LV), accompanies more than 30% of moderate to severe heart failure (HF) cases21. Body-surface electrocardiographic characteristics in many HF patients include a wide QRS complex and a left bundle branch block (LBBB) pattern22; this provides some insight on the global excitation sequence. However, a detailed description of activation patterns in the in situ heart of HF patients has been lacking. Taking advantage of its noninvasive nature, we used ECGI to obtain this information. The patient population included eight heart failure patients (6 males, 2 females; age 72±11 years; New York Heart Association functional class III – IV) with ventricular conduction delay, receiving CRT through implanted atrial-biventricular pacing device.4
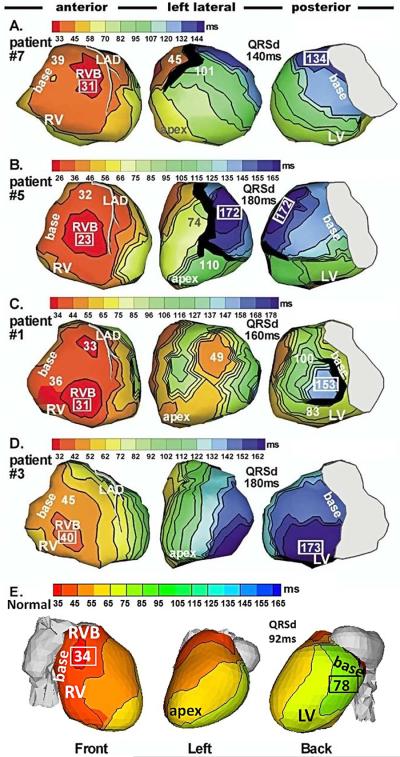
Figure 3 shows the epicardial activation sequences (isochrone maps) during native rhythm (NR) in 4 HF patients (4 top rows). The bottom row shows an isochrone map of a normal heart for reference. In all HF patients, activation of the right ventricle (RV) is completely normal. RV epicardial excitation starts from a breakthrough site (round isochrone) at the typical normal location, indicating a normally functioning right bundle of the specialized conduction system. As in normal hearts,23,24 there is radial, uniform spread of excitation from the breakthrough site, with the basal or anterior/inferior paraseptal regions activating last. Areas of conduction slowing (indicated by crowding of isochrones) or conduction block (thick black lines) are not present in the RV. Mean duration of RV activation was 25ms, similar to normal.
Figure 3.
Epicardial activation maps of native rhythm in four representative HF patients (A to D) and in a normal heart (E). Three views are shown for each heart, as indicated at the bottom. Thick black lines indicate conduction block. All HF maps show sequential activation of right ventricle (RV) followed by greatly delayed left ventricular (LV) activation (left bundle branch block, LBBB pattern). RV activation is normal in all patients. LV activation patterns vary among patients; importantly, there is wide variation in the region of latest LV activation. Normal activation (panel E) is highly synchronized, without conduction delays or block. Numbers indicate activation times (from QRS onset) in milliseconds. Earliest and latest ventricular activation times are indicated by framed numbers. RVB, right ventricular epicardial breakthrough; QRSd = QRS duration (Adapted from Jia P, Ramanathan C, Ghanem RN, Ryu K, Varma N, Rudy Y. Electrocardiographic imaging of cardiac resynchronization therapy in heart failure: observations of variable electrophysiologic responses. Heart Rhythm.2006;3:296–310; with permission.)
In contrast, LV activation is delayed in all patients, accounting for the LBBB pattern of the body surface ECG. Unlike RV activation, which is similar for all patients, LV activation patterns are heterogeneous and different among patients, with variable locations of lines of conduction block (thick black lines) and regions of slow conduction (crowded isochrones). Importantly, the location of latest activation (blue) varies greatly. A common occurrence is the presence of anterior lines of block, which prevent the activation front from propagating deeper into the LV after crossing the inter-ventricular septum from the RV; the wave front propagates in a U-shaped pattern to reach the lateral wall by way of the apical or inferior LV. This U-shaped pattern was also observed with invasive catheter mapping25. As a consequence of the delayed and regionally non-uniform excitation, ventricular activation becomes desynchronized, leading to reduced cardiac function.
3.1. Cardiac Resynchronization Therapy
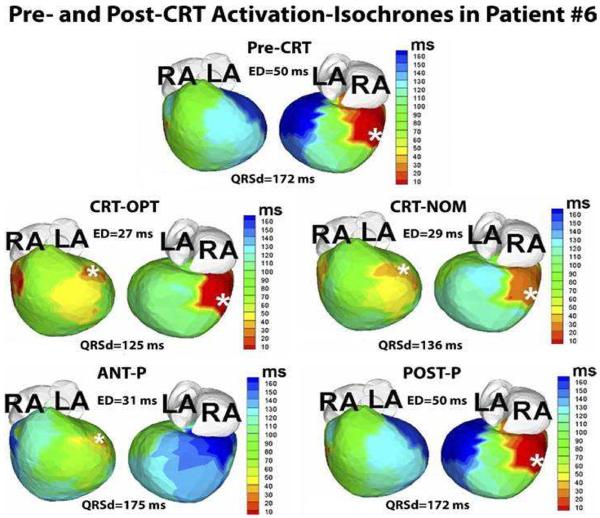
Cardiac resynchronization therapy (CRT) applies biventricular (BiV) pacing to restore ventricular synchrony. Through pacing, it attempts to accelerate excitation of the most delayed LV activation region. CRT has been shown to improve patients' symptoms, LV performance and long term survival in about 70% of cases (approximately 33% of patients do not respond to CRT)26. The ability to achieve synchrony with CRT depends on the site of LV lead placement. As seen in the ECGI maps of Figure 3, the region of most delayed LV activation (the desired pacing location) is variable and patient specific (compare the dark blue regions in patients #7 and #3). Also, other properties of the electrophysiologic substrate should be taken into consideration when deciding on lead placement. For example, in patient #1 the region of latest activation (blue; 153ms) is surrounded by a line of block and slow conduction and pacing from this region is unlikely to capture. Mapping of the substrate with ECGI prior to CRT device implantation can provide useful information for guiding optimal electrode placement. Figure 4 shows an example of ECGI-guided electrode placement in the area of latest activation in a pediatric HF patient with congenital heart disease5.
Figure 4.
Guidance of lead placement with ECGI. Activation maps for 5 pacing regimes (Pre-CRT, CRT-OPT, CRT-NOM, ANT-P, POST-P) are shown in 2 views, anterior (left) and inferior (right). This patient is an 8-year-old male with hypoplastic left heart syndrome, mitral atresia, and double outlet right ventricle who had a DDD epicardial pacemaker implanted at the age of 3 months for postoperative complete heart block. The pacing lead was placed in a right posterior area (white asterisk, pre-CRT panel). At 4 years of age, he had a fenestrated extra-cardiac Fontan operation. Over the following several years he developed worsening HF. His pre-CRT activation map (top panel) showed a severely elevated electrical dyssynchrony (ED) index (ED = 50ms; text for ED definition), with severely delayed activation of the left anterior basal and inferior basal areas of the ventricle (dark blue, pre-CRT). These areas were designated as suitable sites for the resynchronization lead. The patient underwent surgical implant of an epicardial lead at the left anterior basal area. Repeated ECGI 3 months after implant showed a dramatically improved synchrony during optimal BiV pacing, with ED dropping to the normal range (ED = 27ms; CRT-OPT); improvement with nominal BiV pacing(without optimization of inter-ventricular pacing delay) was slightly less (ED = 29ms; CRT-NOM). LA, left atrium; RA, right atrium; ANT-P, anterior lead pacing only; POST-P, posterior lead pacing only. White asterisks denote sites of pacing leads. (From Silva JN, Ghosh S, Bowman TM, Rhee EK, Woodard PK, Rudy Y. Cardiac Resynchronization Therapy in Pediatric Congenital heart Disease: Insights from Noninvasive Electrocardiographic Imaging. Heart Rhythm 2009;6:1178–1185; with permission.)
3.2. Responders to CRT
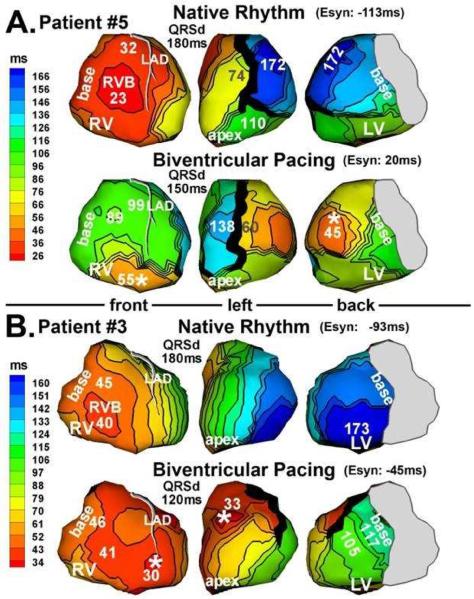
Figure 5 shows epicardial activation during both NR (top row of each panel) and BiV pacing (bottom row of each panel) in two patients (Panel A: #5, Panel B: #3). The LV pacing lead of patient #5 was located at the lateral wall (Figure 5A, white asterisk). Activation from the pacing site captured most of the LV and eliminated the very late activation region at 174ms during NR. The line of block on the anterior LV, present during NR, was maintained during BiV, although its geometry was somewhat modified. Latest activation occurred at anterior LV, adjacent to this line of block, at 138ms. Relative to NR, ventricular activation was much better synchronized during BiV. Patient #3 (Figure 5B) had an anterior LV lead which captured the LV and eliminated the very late activation region at 173ms, present during NR. A functional line of block, not present during NR, emerged anterolaterally during BiV pacing. LV activation pivoted around this block and ended at lateral basal LV at 117ms, with much better electrical synchrony than during NR. Both patients responded well to CRT as judged by post-implant echo parameters.
Figure 5.
Activation maps from 2 patients (panel A and panel B) who responded to CRT. Native rhythm (top) and BiV pacing (bottom) maps are shown for each patient. Format is similar to that in Figure 3. Pacing sites are marked by asterisks. (From Jia P, Ramanathan C, Ghanem RN, Ryu K, Varma N, Rudy Y. Electrocardiographic imaging of cardiac resynchronization therapy in heart failure: observations of variable electrophysiologic responses. Heart Rhythm.2006;3:296–310; with permission.)
3.3. Non-responders to CRT
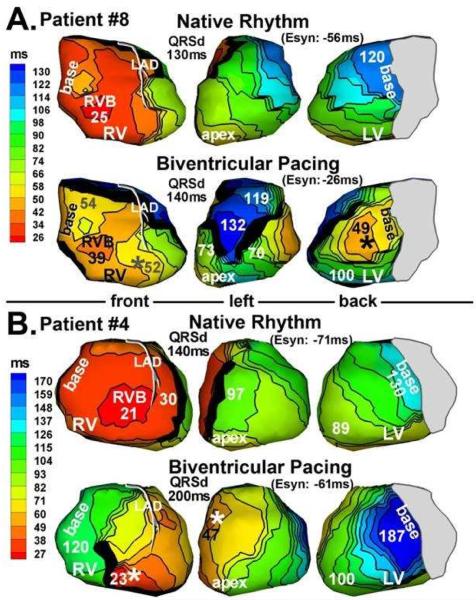
Figure 6 shows examples of patients who did not respond to CRT. Patient #8 had a lateral LV lead (Figure 6A). While pacing from this site captured the late LV basal region, activated at 120ms during NR, it created an anterolateral functional line of block which forced the wave front to pivot and activate a large portion of anterior LV very late and asynchronously at 132ms. Figure 6B shows patient #4 who had an anterior LV pacing lead. LV lateral wall activation was slowed relative to NR and took twice as long to reach the basal LV (dark blue at 187ms).
Figure 6.
Activation maps from 2 patients (panel A and panel B) who did not respond to CRT. Native rhythm (top) and BiV pacing (bottom) maps are shown for each patient. Format is similar to that in Figure 3. Pacing sites are marked by asterisks. (From Jia P, Ramanathan C, Ghanem RN, Ryu K, Varma N, Rudy Y. Electrocardiographic imaging of cardiac resynchronization therapy in heart failure: observations of variable electrophysiologic responses. Heart Rhythm.2006;3:296–310; with permission.)
It is important to note that the EP substrate is dynamic; it depends on the activation pattern and changes in response to pacing. With changing direction and orientation of the activation fronts relative to the anatomical structure of the myocardium, new functional lines of block and regions of slow conduction emerge, while others disappear. ECGI can capture these dynamic changes because it maps the activation continuously with a panoramic view of the ventricles. ECGI has also been able to delineate the EP substrate associated with post myocardial infarction scars27,28
The ECGI observation that RV activation is normal in HF and utilizes the specialized conduction system suggested that CRT can be achieved with LV pacing alone. We demonstrated in 3 of 4 patients with AV conduction that with optimal atrial-ventricular delay, synchronization was achieved by fusion between intrinsic excitation from the RV and paced excitation from the LV electrode (figure 7 in reference 4).
3.4. Evaluating and Quantifying Synchrony with ECGI
As mentioned earlier, each ECG electrode on the body surface records a signal that is generated by activity in the entire heart. Consequently, a fundamental limitation of the body surface ECG is its inability to provide accurate information about regional activation in the heart and the spatial-temporal relationships between activities in different regions. By definition, this relationship is precisely what determines the degree of electrical synchrony. Despite this limitation, the QRS duration (QRSd) on the body surface ECG has been used as an index of cardiac electrical synchrony, with the interpretation that a longer QRSd indicates reduced synchrony29. The QRSd is noninvasive and easily obtainable; however, it is only an estimate of the duration of global ventricular activation as reflected on the body surface ECG. As an illustration of its limitation in measuring synchrony, a small region of delayed activation that is insignificant to overall synchrony and cardiac function can skew the QRSd to very long values. In contrast to the body surface ECG, ECGI reconstructs the pattern of regional electrical activity in the heart and the spatial-temporal relationships between activities in the different regions, which define the degree of synchrony. Using ECGI activation maps, we defined and computed an intra-LV electrical dyssynchrony index (ED) as the standard deviation of activation times at 500 sites on the LV epicardium, including the epicardial aspect of the septum6. ED, by definition, is a measure of the spatial dispersion of activation times across the LV and depends on how much of the LV activates late relative to the rest of LV myocardium. Control value of ED in a population of 22 young healthy subjects without heart failure was determined at 20 ± 4ms; LV is defined to be electrically asynchronous when ED is 28ms or greater.
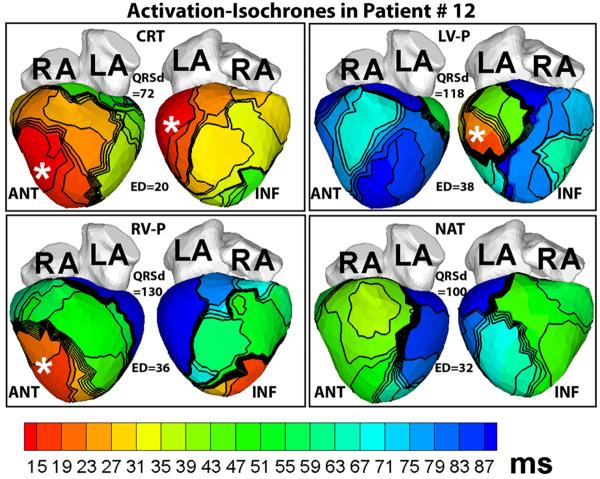
Figure 7 illustrates the usefulness of ED as an index of electrical synchrony. It shows ECGI activation maps of a patient who responded to CRT. Although his native QRSd is normal at only 100ms, the native activation pattern (NAT, Figure 7) is very dyssynchronous (ED = 32ms), characterized by lines of block and delayed activation of extensive areas of the LV lateral and inferior wall (blue, NAT panel, Figure 7). CRT restores LV synchrony and reduces ED to a normal value of 20ms.
Figure 7.
Activation maps in a patient who had a normal QRSd despite LBBB pattern before implant. Note the large electrical dyssynchrony (ED = 32ms) in the native rhythm (NAT panel) in spite of a normal QRS duration (QRSd = 100ms). Cardiac resynchronization therapy (CRT panel) restored electrical synchrony (ED = 20ms) in the normal range. Pacing sites are indicated by asterisks. Each panel shows anterior (ANT, left) and inferior (INF, right) four-chamber views. RV-P and LV-P indicate RV pacing only or LV pacing only, respectively. (From Ghosh S, Silva JN, Canham RM, et al. Electrophysiologic substrate and intra¬ventricular left ventricular dyssynchrony in nonischemic heart failure patients undergoing cardiac resynchronization therapy. Heart Rhythm 2011;8:692–699; with permission.)
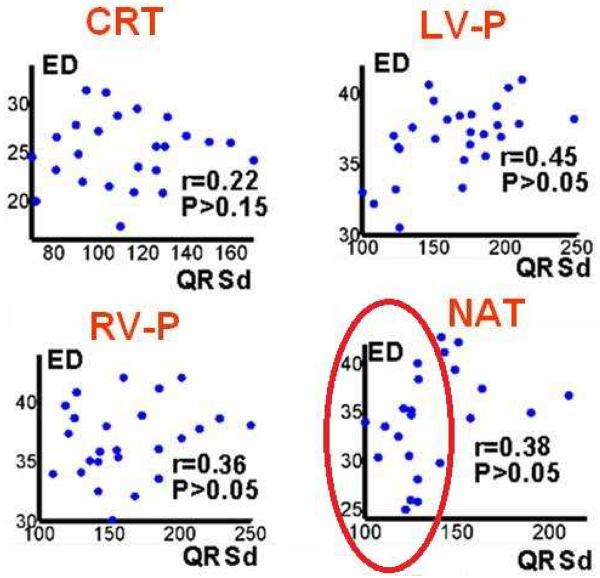
In an ECGI study of 25 HF patients undergoing CRT6, we observed that LV electrical dyssynchrony is consistently high (ED ~30ms) for native QRSd >130ms. However, among patients with native QRSd ~130ms, electrical dyssynchrony varied widely. Four patients with QRSd between 120 and 130ms had synchronized LV activation (ED <28ms); as could have been predicted, all of them were non-responders to CRT because their LV was already synchronized in native rhythm. Two patients had very dyssynchronous LV activation (ED = 32 and 34ms) during native rhythm despite QRSd <120ms; they both responded to CRT. These data suggest that the ECGI-determined ED could complement the QRSd as a predictor of CRT response, especially in the range of QRSd between 100ms and 130ms where QRSd is not a reliable index of synchrony. This is illustrated further in the scatter plots of Figure 8, which show only very weak correlation between ED and QRSd. During native rhythm (NAT) for the range of QRSd < 130ms (encircled by the elliptical frame), ED is a sensitive index of synchrony but QRSd shows little variation between patients.
Figure 8.
Scatter plots of electrical dyssynchrony (ED) versus QRSd for CRT rhythm; left ventricular paced rhythm (LV-P); right ventricular paced rhythm (RV- P); and native sinus rhythm (NAT). r is Pearson correlation coefficient; P<0.05 is considered significant correlation. (From Ghosh S, Silva JN, Canham RM, et al. Electrophysiologic substrate and intra¬ventricular left ventricular dyssynchrony in nonischemic heart failure patients undergoing cardiac resynchronization therapy. Heart Rhythm 2011;8:692–699; with permission.)
4. VENTRICULAR ARRHYTHMIAS
Symptomatic ventricular arrhythmias often are not responsive to medical therapy or the medications required to suppress the arrhythmia are not tolerated. Ablation of ventricular arrhythmias has evolved to become a major treatment option for patients with symptomatic PVCs or sustained ventricular arrhythmias. The major challenges of ablation therapy are that the arrhythmia may not occur spontaneously or be inducible at the time of study, and in some patients the hemodynamic instability of ventricular tachycardia (VT) poses an important limitation on accurate identification of the mechanism and site of origin of the arrhythmia. Moreover, point by point mapping with an ablation catheter may not provide sufficient detail to determine the origin, and patients often have multiple VT morphologies representing different circuits that increase the difficulty of the procedure and may compromise the long-term outcome.
Simultaneous acquisition of global ventricular activation offers promise for rapid and accurate identification of the mechanism of VT that could guide ablation of the critical elements, expedite the time required to perform the procedure, and improve outcomes of arrhythmias that are difficult to map using standard point by point endocardial mapping.
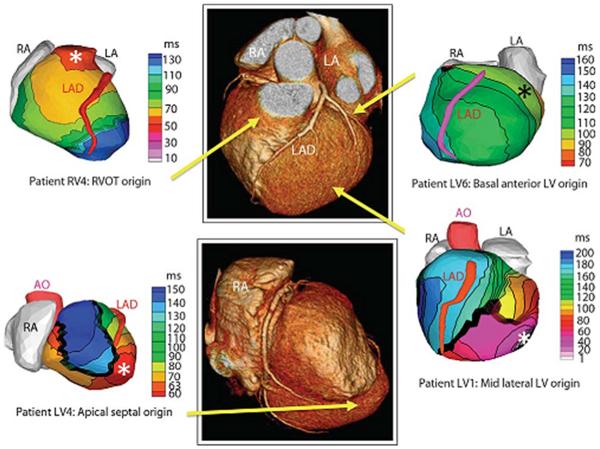
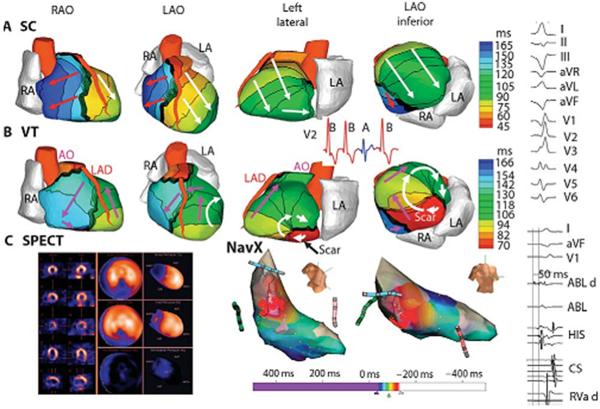
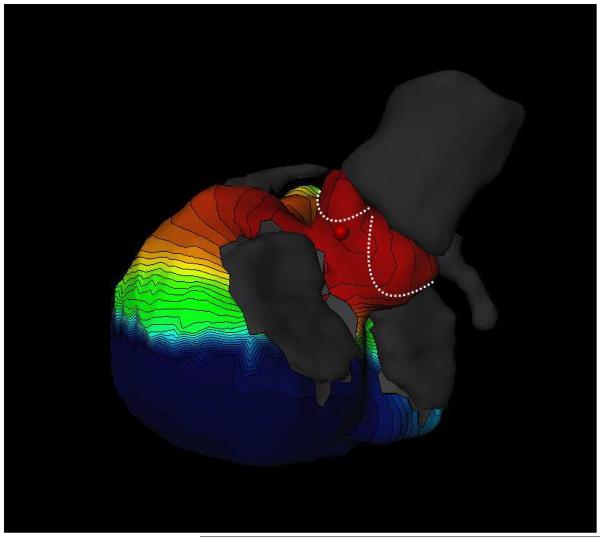
Preliminary studies have shown that ECGI accurately identifies the site of early ventricular activation in patients with accessory pathways (31), distinguishes the origin of premature ventricular contractions (32,33,34), and can be used to construct the activation sequence of reentrant VT (34). Figure 9 shows examples of epicardial activation recorded using ECGI in four patients with focal mechanisms arising from the right ventricular outflow tract and different sites within left ventricles that were concordant with endocardial mapping. Figure 10 demonstrates epicardial ventricular activation during a sinus capture beat compared with reentrant VT with early activation of a region on the border of a scar documented by nuclear imaging. In some patients, adjacent but anatomically distinct origins, such as the RVOT and coronary cusps, may take time to differentiate using standard catheter based point by point mapping. Figure 11 was recorded from an ECGI prototype developed for commercial use (CardioInsight). It correctly identifies the origin of a premature ventricular contraction arising from the left coronary cusp.
Figure 9.
Examples of noninvasive ECGI isochrones maps for localization of VT site of origin. Epicardial isochrone maps are shown for four patients with earliest epicardial activation marked with an asterisk. EP study-determined sites of origin are indicated under the ECGI maps. Yellow arrows point to VT origin on a representative CT scan. RA, right atrium; LA, left atrium; AO, aorta; LAD, left anterior descending coronary artery; LV, left ventricle: RVOT, right ventricular outflow tract. (From Wang Y, Cuculich PS, Zhang J, Desouza KA, Vijayakumar R, Chen J, Faddis MN, Lindsay BD, Smith TW, Rudy Y. Noninvasive electroanatomic mapping of human ventricular arrhythmias with electrocardiographic imaging (ECGI). Science Transl Med 2011;3:1–10; with permisson.)
Figure 10.
Example of ECGI reentrant VT from inferobasal scar. (A) Four views of activation sequence during a sinus capture (SC) beat (blue on the V2 ECG). Arrows indicate direction of the activation wavefronts. (B) Activation sequence during VT beats (red on the V2 ECG). White arrows indicate a clockwise lateral loop (left lateral and left anterior oblique inferior views); purple arrows show propogation into the RV in a counterclockwise fasshion. (C) (left) SPECT images showing a scar at the inferobasal LV region (blue). (Right) Limited invasive endocardial map of VT activation (red, early;blue late). (Right column) (Top) Twelve-lead surface ECG during VT. (Lower) Ablation catheter signals. The earliest electrogram signal is seen at the inferoseptal border zone, 50 ms before the onset of the surface QRS. ABL d, bipolar electrogram at the distal ablation catheter; HIS, AV junction/His bundle; CS, coronary sinus; RVa d, right ventricular apex. (From Wang Y, Cuculich PS, Zhang J, Desouza KA, Vijayakumar R, Chen J, Faddis MN, Lindsay BD, Smith TW, Rudy Y. Noninvasive electroanatomic mapping of human ventricular arrhythmias with electrocardiographic imaging (ECGI). Science Transl Med 2011;3:1–10; with permisson.)
Figure 11.
Focal ventricular ectopy. Noninvasive electocardiographic mapping demonstrating early activation from the region of the aortic cusps. (Courtesy of Meleze Hocini, Bordeaux, France.)
Figure 12 provides an example of reentry on the lateral wall of the left ventricle in a patient with an infiltrative cardiomyopathy. Although there is some beat to beat variation in activation that would not be appreciated with point by point mapping, the wavefront of activation propagated to the LV lateral base where it reached a line of block in the inferolateral base.
Figure 12.
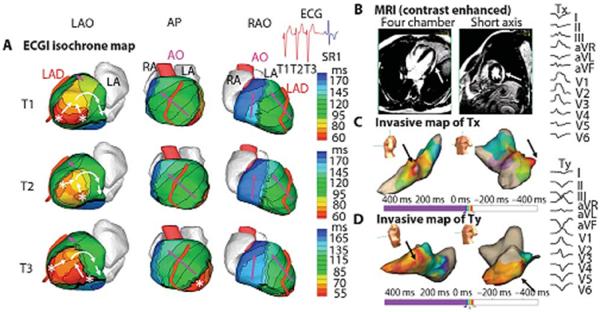
Example of ECGI of reentrant VT in LV lateral wall in infiltrative cardiomyopathy. (A). ECGI isochrone map. Activation patterns for three consecutive VT beats (T1, T2, and T3). ECGI identified two distinct areas of early epicardial activation (white asterisks), which differered from beat to beat. The propagation pattern varied somewhat depending on the relative contribution of the two sources, but for all beats, the wavefront turned clockwise and propagated to the LV lateral base with a high degree of curvature, where it reached a line of block in the infero-lateral base. (B) A gadolinium-enhanced MRI revealed a patch of myocardial enhancement in the lateral LV (white arrows), consistent with focal myocarditis or cardiac sarcoid. (C) Invasive electroanatomic map created during the presenting VT (arbitrarily named Tx). The region of earliest activation is shown by black arrows. (D) Invasive electroanatomic map created during a different VT (arbitrarily named Ty) after initial ablation at the site of earliest activation. The earliest activation (black arrows) is shifted more apically. (Right) Twelve-lead ECGs of two VT morphologies (Tx and Ty). AP, anterior-posterior view; SR1, first sinus rhythm beat after VT. (From Wang Y, Cuculich PS, Zhang J, et al. Noninvasive electroanatomic mapping of human ventricular arrhythmias with electrocardiographic imaging (ECGI). Science Transl Med 2011;3:1–10; with permisson).
The accuracy of ECGI mapping has been demonstrated over a wide range of origins and distinguishes focal from macro-reentrant mechanisms with a high degree of spatial resolution in the range of 6 mm (35). Because of the linkage to the CT scan specific to the patient under study, the maps correlate with the anatomy of the individual patient. There are limitations with this approach, which records epicardial activation, because there are differences in activation between the endocardium and epicardium. This is affected by thickness of the myocardium, fiber orientation and scar. Nonetheless, it provides useful supplemental information to facilitate endocardial mapping.
5. FOCAL AND MACRO-REENTRANT ATRIAL ARRHYTHMIAS
The evolution of ablation procedures has encompassed a variety of sustained atrial arrhythmias that depend on either focal or reentrant mechanisms. Ablation of premature atrial complexes is uncommon because they tend not to be associated with severe symptoms, yet in some patients triggers of atrial fibrillation that arise outside of the pulmonary veins may be important, yet they are difficult to map and often cannot be induced reliably enough to map accurately. Early attempts to map atrial arrhythmias using ECGI were directed towards focal mechanism because the specific anatomic location could be confirmed by endocardial mapping and compared with results of ECGI; they were later followed by studies of reentry (36,37).
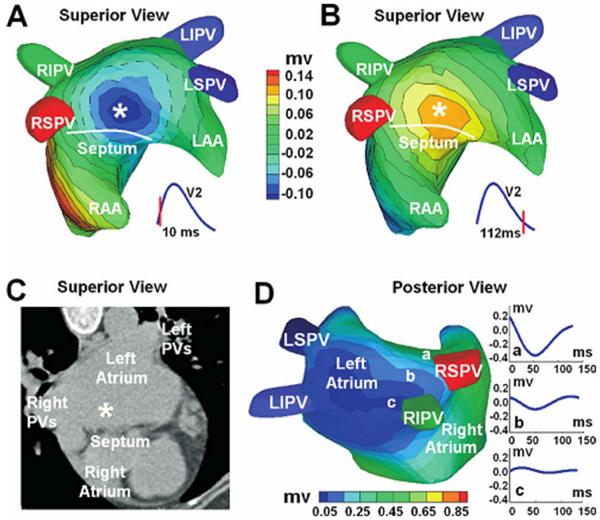
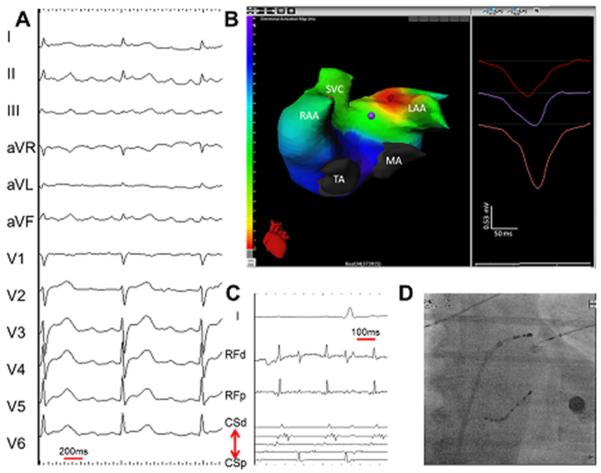
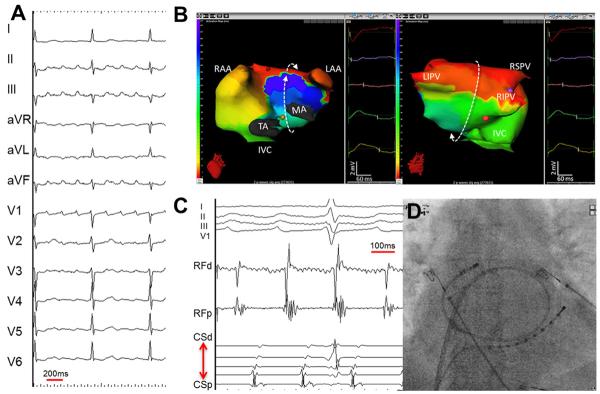
Figure 13 shows ECGI three-dimensional images that were recorded in a patient with a history of rheumatic heart disease and mitral valve commissurotomy who had undergone a prior pulmonary vein antral isolation and subsequently developed a focal atrial tachycardia (36). An epicardial breakthrough (local potential minimum) was recorded high in the left atrium near the septum. Results of ECGI mapping showed a good correlation with endocardial electroanatomic map and the site of ablation. Another example, shown in Figure 14, illustrates a focal atrial tachycardia with centrifugal activation from the base of the left atrial appendage (37). This image was recorded with the same prototype system that was used in Figure 11.
Figure 13.
ECGI three-dimensional voltage and electrogram maps of focal atrial tachycardia (AT). A and B: Atrial epicardial potential maps at 10 and 112 ms after the onset of the surface P wave. Panel A captures the epicardial breatkthrough pattern during activation, and panel B shows the repolarization pattern with reverse polarity. The white asterisk indicates the site of earliest activation as predicted by ECGI. Panel C shows the ECGI-determined earliest activation site (white asterisk) on a CT image of the atria. Panel D is an electrogram magnitude map (peak-to-peak) reconstructed by ECGI (posterior view). The dark blue represents a region of low-magnitude electrograms, indicating a scar region. Three electrograms selected from a nonscar region (a) and from the scar region (b, c) are shown. Location of the low-magnitude electrograms is consistent with prior PV isolations and left atrial substrate modification. RIPV = right inferior PV; LIPV = left inferior PV; RSPV = right superior PV; LSPV = superior PV; LAA = left atrial appendage; RAA = right atrial appendage. (From Wang Y, Cuculich PS, Woodard PK, et al. Focal atrial tachycardia after pulmonary vein isolation: noninvasive mapping with electrocardiographic imaging (ECGI). Heart Rhythm 2007;4:1082–1084; with permisson.)
Figure 14.
Focal left atrial tachycardia. (A) A 12-lead electrocardiogarm of clinical tachycardia. (B) an ishochronal activation electrocardiomap of a basal left atrial appendage source centrifugal AT. The morphology of the virtual unipolar electrogram at the source displays typical QS morphology. (C) Intracardiac electrograms from the lateral left atrium and coronary sius recorded during ablation of the left atrial source centrifugal AT. (D) Postero-anterior fluoroscopic image showing the location of intracardiac catheters. LAA = left atrial apendage; MA = mitral annulus; RAA = right atrial appendage; SVC = superior vena cava; TA = tricuspid annulus. (From Shah AJ, Hocini M, Xhaet O, et al. Validation of novel 3-dimensional eletrocardiographic mapping of atrial tachycardias. Invasive mapping and ablation. A multicenter study. J Am Coll Cardiol 2013:62-889-97; with permisson)
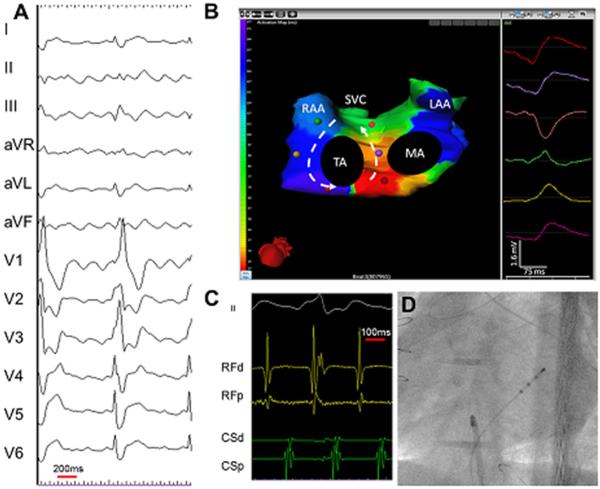
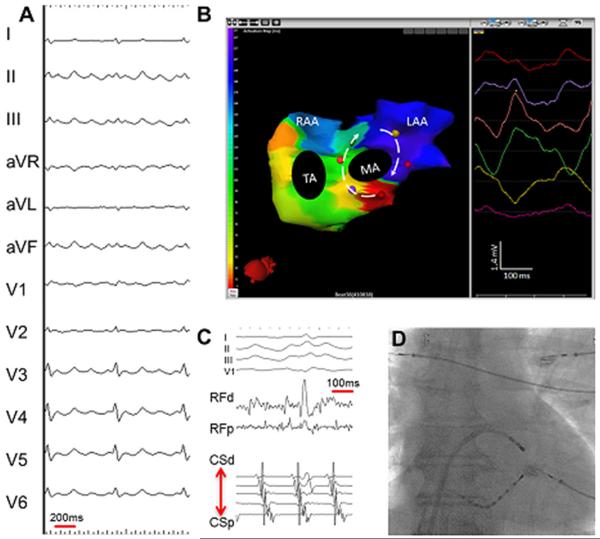
Additional studies using the electrocardiographic mapping system (CardioInsight) evaluated the efficacy in both focal mechanisms of atrial tachycardia and macro-reentry involving cavotricuspid isthmus-dependent, perimitral and left atrial roof dependent reentry (37). Figure 15 shows cavotricuspid isthmus-dependent counter-clockwise rotation around the tricuspid valve. Figure 16 is an example of perimitral atrial flutter, and Figure 17 shows macro-reentrant roof dependent left atrial flutter. Electrocardiographic mapping correctly diagnosed the mechanism of atrial tachycardias in 92% of patients with focal or macro-reentrant mechanisms that were located in either the right or left atrium. The main limitations were that the system did not provide direct mapping of the septum; however, a septal source often can be deduced by analyzing the location and timing of epicardial activation near the interatrial groove.
Figure 15.
Cavotricuspid isthmus-dependent atrial tachycardia. (A) A 12- lead electrocardiogram of clinical tachycardia from a patient who previously underwent extensive ablation for atrial fibrillation. (B) An isochronal activation electrocardiomap of counterclockwise cavotricuspid isthmus-dependent atrial tachycardia (AT). Typically, the interatrial groove is activated from below upward followed by sequential activation of the right atrial free wall from above downward. The left atrial breakthroughs at the coronary sinus and the Bachman bundle result in septal-to-lateral activation of the anterior and posterior left atrium. The morphology of the virtual unipolar electrograms displayed from atrial sites distributed around the tricuspid annulus concurs with this activation pattern. The color of the unipolar electrogram corresponds to the color of the spot marked on the biatrial geometry. On the color scale, the earliest activation site is red and the latest is purple. The color map shows 160 ms of activation. The cycle length here is 244 ms. The remainder of the cycle length is within the slow conduction zone (cavotricuspid isthmus), on either side of which purple meets red. (C) Intracardiac electrograms from the isthmus and coronary sinus recorded during the ablation of cavotricuspid isthmus-dependent AT. (D) Postero-anterior fluoroscopic image showing the location of intracardiac catheters. LAA = left atrial apendage; MA = mitral annulus; RAA = right atrial appendage; SVC = superior vena cava; TA = tricuspid annulus. (From Shah AJ, Hocini M, Xhaet O, et al. Validation of novel 3-dimensional eletrocardiographic mapping of atrial tachycardias. Invasive mapping and ablation. A multicenter study. J Am Coll Cardiol 2013:62-889-97; with permisson)
Figure 16.
Perimitral AT. (A) A 12-lead electrocardiogram of clinical tachycardia. (B) An isochronal activation electrocardiomap of clockwise perimitral AT. Typically, the coronary sinus and contiguous posterior-inferior left atrium are activated from a lateral to septal direction, and the Bachmann bundle activation proceeds in the opposite direction, covering almost the entire tacycardia cycle length. The morphology of the virtual unipolar electrograms displayed from 6 atrial sites distributed around the mitral annlus confirms the activation pattern. The right atrial free wall is typically activated from above downard during perimitral AT. The cavotricuspid isthmus is activated laterally (toward the right atrial free wall) from the septum (coronary sinus ostium level) without substantial conduction delay confirming the bystander role of the right atrium in perimitral AT. (C) Intracardiac electrograms from the lateral mitral isthmus and coronary sinus recorded during the ablation of perimitral AT. (D) Postero-anterior fluoroscopic image showing the location of intracardiac catheters. LAA = left atrial apendage; MA = mitral annulus; RAA = right atrial appendage; SVC = superior vena cava; TA = tricuspid annulus. (From Shah AJ, Hocini M, Xhaet O, et al. Validation of novel 3-dimensional eletrocardiographic mapping of atrial tachycardias. Invasive mapping and ablation. A multicenter study. J Am Coll Cardiol 2013:62-889-97; with permisson).
Figure 17.
Left atrial roof-dependent AT. (A) A 12-lead electrocardiogram of clinical tachycardia. (B) an ishochronal activation of electrocardiomap of a typical macro-reentrant roof-dependent AT. The below to upward activation of the anterior wall of the left atrium is shown on the left and the top to bottom activation of the posterior left atrium is shown on the right. The bystander right atrial free wall is activated from above downward. The entire tachycardia cycle length is covered along the AT circuit, and the morphologies of the virtual unipolar electorgrams displayed from 5 atrial sites distributed along the trajectory of the macro-rentry concur with this activation pattern (C) intracardiac electrograms from the left atrial roof and coronary sinus recorded during the ablation of roof-dependent AT. (D) Postero-anterior fluoroscopic image showing the location of the intracardiac catheters. LAA = left atrial apendage; MA = mitral annulus; RAA = right atrial appendage; SVC = superior vena cava; TA = tricuspid annulus. (From Shah AJ, Hocini M, Xhaet O, et al. Validation of novel 3-dimensional eletrocardiographic mapping of atrial tachycardias. Invasive mapping and ablation. A multicenter study. J Am Coll Cardiol 2013:62-889-97; with permisson)
6. ATRIAL FIBRILLATION
The physiology of human atrial fibrillation has been difficult to study because of the need for simultaneous recordings in both atria and sophisticated computer algorithms to reconstruct complex electrical activation. Moreover, the physiology of atrial fibrillation may differ depending on whether it is recorded in an animal model or human. In patients the atria may be affected by hypertension, myopathies, valvular heart disease, or other comorbidities. There is compelling clinical and experimental evidence that long duration of atrial fibrillation is associated with more complex physiology. It also appears to be dependent on both anatomic barriers and progressive changes at a cellular level that affect cell to cell conduction and refractoriness. The multiple wavelet hypothesis proposed by the seminal work of Moe has been widely accepted for many years, yet it was based on a canine model of atrial fibrillation dependent on vagal nerve stimulation, which provided the basis for computer modeling (38). Allessie promoted the leading circle concept for atrial fibrillation that was independent of anatomic barriers or areas of conduction block and found evidence of 4–6 simultaneous randomly circulating wavelets in Langendorff perfused atria with an acetylcholine infusion (39). Other studies based on different animal models have raised the possibility that diverse mechanisms are involved (40–44). Waldo performed high density mapping during vagal nerve stimulation in the canine heart and concluded that multiple foci of varying cycle lengths and duration induced wave fronts that merged or collided without random wave fronts of reentry (44).
Early epicardial mapping of induced atrial fibrillation obtained from humans in the operating room employed 156 electrodes applied to the right atrial free wall, the posterior left atrial tissue beneath the posterior septum and pulmonary veins, and the transvers sinus to map the anterior right and left atrial tissue (45–46). These studies commonly observed multiple dynamic wave fronts interacting with changing arcs of conduction block and slow conduction. Sometimes transient macro-reentry was observed without anatomic obstacles but these circuits were transient and unstable with cycle lengths of 200–240 ms. While most circuits were centered in the left atrium, others were recorded in the right atrium. More recent intra-operative mapping studies of patients with chronic atrial fibrillation that employed 404 epicardial electrodes demonstrated two patterns (47). In one, parts of the atria demonstrated short regular cycle lengths that could be consistent with a driver with irregular activation of the rest of the atria. The second pattern showed no regions of regular activation.
Current strategies for ablation of atrial fibrillation have focused on elimination of the triggers of atrial fibrillation or modification of the substrate required to prevent atrial fibrillation, yet complex activation sequences that occur during atrial fibrillation cannot be interpreted by single point endocardial mapping.
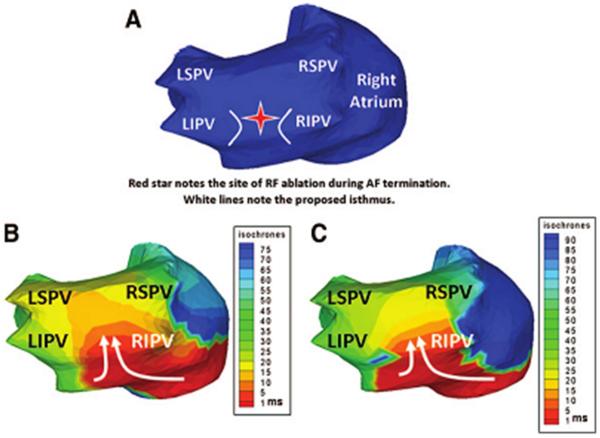
Preliminary studies showing the complexity of mapping electrical activation during atrial fibrillation highlighted individual variation and differences between patients with paroxysmal compared with persistent atrial fibrillation (35). In aggregate, multiple wavelets are observed in a high percentage of patients (92%) and focal mechanisms can be demonstrated in pulmonary and nonpulmonary vein origins. Figure 18 shows a posterior view of the left atrium recorded during atrial fibrillation and demonstrates a reentrant wavefront recorded at two points in time that enters the posterior left atrium through a protected isthmus. Figure 19 shows the spectrum of complexity of AF (the reader is referred to reference 35 for actual ECGI maps and movies of complex activation in persistent AF). There are statistical differences in the number of wavelets and focal mechanisms when paroxysmal, persistent, and long-standing persistent atrial fibrillation are compared. The observation that paroxysmal atrial fibrillation has less complex wavelets and fewer focal mechanisms helps to explain why the success rate of catheter ablation is higher in patients with paroxysmal atrial fibrillation as opposed to atrial fibrillation of long-standing duration. While these patterns are often repetitive in patients with paroxysmal atrial fibrillation, the repetition of patterns decreases with the complexity of atrial fibrillation.
Figure 18.
Noninvasive ECGI of AF using a critical isthmus in the posterior LA during AF radiofrequency ablation. (A) Posterior view of the atria with a red star marking the location of the ablation that terminated AF. B and C, ECGI ishochrone maps during AF at two separate time points immediately before successful ablation. For both images a wavefront enters the posterior LA (white arrows) through a protected isthmus. LSPV indicates left superior pulmonary vein (PV); LIPV, left inferior PV; RSPV right superior PV; and RIPV, right inferior PV. (From Cuculich PS, Wang Y, Lindsay BD, et al. Noninvasive characterization of epicardial activation in humans with diverse atrial fibrillation patterns. Circulation 2010;122:1364–1372; with permisson)
Figure 19.
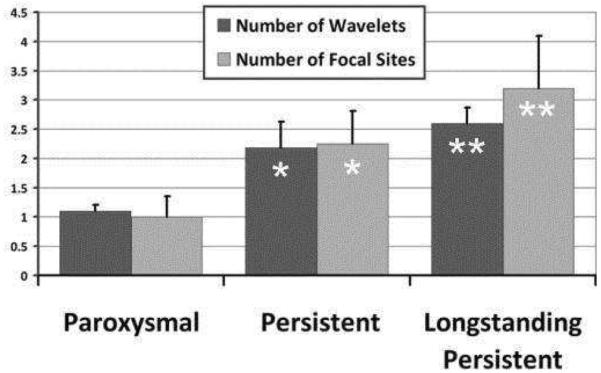
AF complexity. Increasing complexity of AF stratified by clinical classification of paroxysmal, persistent, and long-standing persistent AF. With increasing AF duration, ECGI imaged more focal sites and wavelets (ANOVA for wavelet P=0.11; focal sites, P=0.031). Asterisk denotes P < 0.05 compared to paroxysmal. Double asterisk denotes P < 0.05 compared to both paroxysmal and persistent. (Adapted from Cuculich PS, Wang Y, Lindsay BD, et al. Noninvasive characterization of epicardial activation in humans with diverse atrial fibrillation patterns. Circulation 2010;122:1364–1372; with permisson).
These observations are concordant with panoramic mapping of atrial fibrillation reported by Haissaguerre et al. who recorded reconstructed unipolar electrograms during atrial fibrillation using an array of 252 body surface electrodes (CardioInsight) registered to a noncontrast computed tomography scan (48). As shown in Figure 20, this study observed continuously changing reentrant patterns lasting a median 2.6 rotations. Although the wave fronts varied over time and space, repetitive wave front patterns and focal drivers were observed and provided a potential target for ablation. Approximately 70% of the reentrant patterns and focal drivers were recorded in the left atrium. As with the prior study reported by Cuculich et al., the number of targeted drivers increased from a median of 2 to 6 in relation to the duration of atrial fibrillation. Ablation in these regions terminated 75% of persistent and 15% of long-standing atrial fibrillation. but the probability of termination decreased sharply in patients with atrial fibrillation longer than 6 months in duration.
Figure 20.
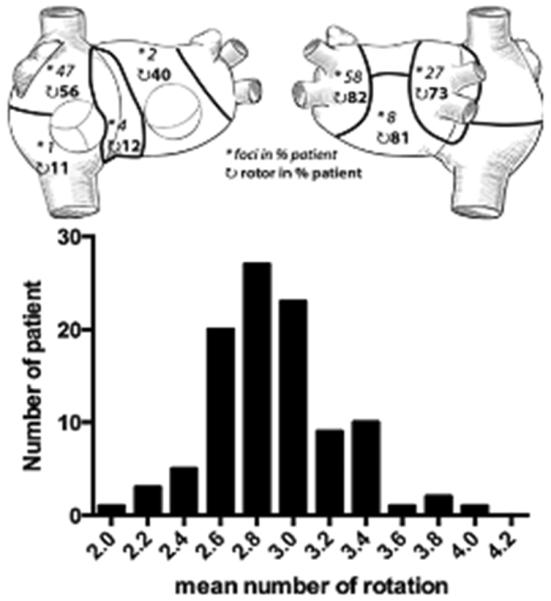
Persistent AF. Top. Distribution of drivers (focal breathroughs, asterisk; reentry events, curved arrows) in 7 regions is reported as the percentage of patients. For example, 82% of the 103 patients had repetitive reentries, and 58% had repetitive focal breakthtroughs in the left pulmonary vein-appendage region. Bottom. Bar diagram shows the distribution of the mean number of rotations in 103 patients. (From Haissaguerre M, Hocini M, Denis A, et al. Driver domains in persistent atrial fibrillation. Circulation 2014:130:530–538; with permisson.)
Limitations of the mapping system developed by CardioInsight are that electrograms recorded from tissue that is heavily scarred with low amplitude signals requires careful interpretation. The mapping system reconstructs electrograms relative to the epicardial surface, so activation of the septum can be inferred but wave fronts in the depth of the septum are not recorded directly.
In aggregate, animal and human studies testify to the complexity of atrial fibrillation that depends on chronicity, the extent of fibrosis, and other factors. The development of improved ablation strategies and other therapeutic approaches will depend on improved understanding of the physiology of atrial fibrillation gained by these sophisticated mapping systems.
Key Points.
Noninvasive ECG imaging (ECGI; also called ECG mapping, ECM) can reconstruct potentials, electrograms, activation sequences and repolarization patterns on the epicardial surface of the heart with high resolution.
ECGI maps show normal RV activation and diverse patterns of delayed LV activation in heart failure patients.
ECGI can possibly be used to quantify synchrony, identify potential responders/non-responders to cardiac resynchronization therapy, and guide electrode placement for effective resynchronization therapy.
ECGI accurately determines the origins of focal atrial and ventricular arrhythmias; it also accurately defines atrial and ventricular macro-reentrant circuits.
ECGI recordings of atrial fibrillation highlight differences in the complexity of atrial activation in patients with paroxysmal compared with persistent atrial fibrillation.
Multiple wavelets are observed in a high percentage of patients with atrial fibrillation and focal mechanisms can be demonstrated in pulmonary and nonpulmonary vein origins.
During atrial fibrillation wave fronts vary continuously over time and space; repetitive wave front patterns and focal drivers provide potential targets for ablation of atrial fibrillation.
Acknowledgments
Funding Sources: NIH–NHLBI grants R01-HL-033343 and R01-HL-049054 (to Y. Rudy) and Washington University Institute of Clinical and Translational Sciences grant UL1 TR000448 from the National Center for Advancing Translational Sciences (NCATS) of the NIH. Y. Rudy is the Fred Saigh Distinguished Professor at Washington University.
Footnotes
Publisher's Disclaimer: This is a PDF file of an unedited manuscript that has been accepted for publication. As a service to our customers we are providing this early version of the manuscript. The manuscript will undergo copyediting, typesetting, and review of the resulting proof before it is published in its final citable form. Please note that during the production process errors may be discovered which could affect the content, and all legal disclaimers that apply to the journal pertain.
Disclosures: Dr. Rudy co-chairs the scientific advisory board, holds equity in and receives royalties from CardioInsight Technologies (CIT). CIT does not support any research conducted in Dr. Rudy's laboratory.
REFERENCES
- 1.Plonsey R, Barr RC. Bioelectricity—a quantitative approach. 3rd Springer; New York: 2007. [Google Scholar]
- 2.Barr RC, Ramsey M, III, Spach MS. Relating epicardial to body surface potential distributions by means of transfer coefficients based on geometry measurements. IEEE Trans Biomed Eng. 1977;24:1–11. doi: 10.1109/TBME.1977.326201. [DOI] [PubMed] [Google Scholar]
- 3.Ramanathan C, Ghanem RN, Jia P, Ryu K, Rudy Y. Noninvasive electrocardiographic imaging for cardiac electrophysiology and arrhythmia. Nat Med. 2004;10:422–428. doi: 10.1038/nm1011. [DOI] [PMC free article] [PubMed] [Google Scholar]
- 4.Jia P, Ramanathan C, Ghanem RN, Ryu K, Varma N, Rudy Y. Electrocardiographic imaging of cardiac resynchronization therapy in heart failure: observations of variable electrophysiologic responses. Heart Rhythm. 2006;3:296–310. doi: 10.1016/j.hrthm.2005.11.025. [DOI] [PMC free article] [PubMed] [Google Scholar]
- 5.Silva JN, Ghosh S, Bowman TM, Rhee EK, Woodard PK, Rudy Y. Cardiac Resynchronization Therapy in Pediatric Congenital heart Disease: Insights from Noninvasive Electrocardiographic Imaging. Heart Rhythm. 2009;6:1178–1185. doi: 10.1016/j.hrthm.2009.04.017. [DOI] [PMC free article] [PubMed] [Google Scholar]
- 6.Ghosh S, Silva JN, Canham RM, et al. Electrophysiologic substrate and intra¬ventricular left ventricular dyssynchrony in nonischemic heart failure patients undergoing cardiac resynchronization therapy. Heart Rhythm. 2011;8:692–699. doi: 10.1016/j.hrthm.2011.01.017. [DOI] [PMC free article] [PubMed] [Google Scholar]
- 7.Cuculich PS, Wang Y, Lindsay BD, Faddis MN, Schuessler RB, Damiano RD, Li L, Rudy Y. Noninvasive characterization of epicardial activation in humans with diverse atrial fibrillation patterns. Circulation. 2010;122:1364–1372. doi: 10.1161/CIRCULATIONAHA.110.945709. [DOI] [PMC free article] [PubMed] [Google Scholar]
- 8.Wang Y, Schuessler RB, Damiano RJ, Woodard PK, Rudy Y. Noninvasive Electrocardiographic Imaging (ECGI) of scar-related atypical atrial flutter. Heart Rhythm. 2007;4:1565–1567. doi: 10.1016/j.hrthm.2007.08.019. [DOI] [PMC free article] [PubMed] [Google Scholar]
- 9.Wang Y, Cuculich PS, Woodard PK, Lindsay BD, Rudy Y. Focal atrial tachycardia after pulmonary vein isolation: noninvasive mapping with Electrocardiographic Imaging (ECGI) Heart Rhythm. 2007;4:1081–1084. doi: 10.1016/j.hrthm.2007.04.014. [DOI] [PMC free article] [PubMed] [Google Scholar]
- 10.Wang Y, Cuculich PS, Zhang J, Desouza KA, Vijayakumar R, Chen J, Faddis MN, Lindsay BD, Smith TW, Rudy Y. Noninvasive Electroanatomic Mapping of Human Ventricular Arrhythmias with Electrocardiographic Imaging. Sci Transl Med. 2011;3:191–200. doi: 10.1126/scitranslmed.3002152. [DOI] [PMC free article] [PubMed] [Google Scholar]
- 11.Colli Franzone P, Guerri L, Taccardi B, Viganotti C. The direct and inverse potential problems in electrocardiology: Numerical aspects of some regularization methods and application to data collected in isolated dog heart experiments. Lab Anal Numerica CNR. 1979;222 [Google Scholar]
- 12.Rudy Y, Messinger-Rapport BJ BJ. The Inverse Problem in Electrocardiography: Solutions in terms of Epicardial Potentials. CRC Critical Reviews in Biomedical Engineering. 1988;16:215–268. [PubMed] [Google Scholar]
- 13.Tikhonov AN, Arsenin VY. Solution of Ill-Posed Problems. John Wiley and Sons; New York: 1977. [Google Scholar]
- 14.Ramanathan C, Jia P, Ghanem RN, Calvetti D, Rudy Y. Noninvasive Electrocardiographic Imaging (ECGI): application of the generalized minimal residual (GMRes) method. Ann Biomed Eng. 2003;31:981–994. doi: 10.1114/1.1588655. [DOI] [PMC free article] [PubMed] [Google Scholar]
- 15.Oster HS, Taccardi B, Lux RL, Ershler PR, Rudy Y. Noninvasive Electrocardiographic Imaging: reconstruction of epicardial potentials, electrograms and isochrones, and localization of single and multiple electrocardiac events. Circulation. 1997;96:1012–1024. doi: 10.1161/01.cir.96.3.1012. [DOI] [PubMed] [Google Scholar]
- 16.Oster HS, Taccardi B, Lux RL, Ershler PR, Rudy Y. Electrocardiographic imaging: noninvasive characterization of intramural myocardial activation from inverse reconstructed epicardial potentials and electrograms. Circulation. 1998;97:1496–1507. doi: 10.1161/01.cir.97.15.1496. [DOI] [PubMed] [Google Scholar]
- 17.Burnes JE, Taccardi B, Rudy Y. A noninvasive imaging modality for cardiac arrhythmias. Circulation. 2000;102:2152–2158. doi: 10.1161/01.cir.102.17.2152. [DOI] [PMC free article] [PubMed] [Google Scholar]
- 18.Burnes JE, Taccardi B, MacLeod RS, Rudy Y. Noninvasive Electrocardiographic Imaging of electrophysiologically abnormal substrate in infarcted hearts: a model study. Circulation. 2000;101:533–540. doi: 10.1161/01.cir.101.5.533. [DOI] [PubMed] [Google Scholar]
- 19.Ghanem RN, Burnes JE, Waldo AL, Rudy Y. Imaging Dispersion of Myocardial Repolarization II. Noninvasive Reconstruction of Epicardial Measures. Circulation. 2001;104:1306–1312. doi: 10.1161/hc3601.094277. [DOI] [PubMed] [Google Scholar]
- 20.Ghanem RN, Jia P, Ramanathan C, Ryu K, Markowitz A, Rudy Y. Noninvasive Electrocardiographic Imaging (ECGI): comparison to intraoperative mapping in patients. Heart Rhythm. 2005;2:339–354. doi: 10.1016/j.hrthm.2004.12.022. [DOI] [PMC free article] [PubMed] [Google Scholar]
- 21.Abraham WT, Fisher WG, Smith AL, Delurgio DB, Leon AR, Loh E, Kocovic DZ, Packer M, Clavell AL, Hayes DL, Ellestad M, Messenger J, Trupp RJ, Underwood J, Pickering F, Truex C. McAtee P: Cardiac resynchronization in chronic heart failure. New England Journal of Medicine. 2002;346:1845–53. doi: 10.1056/NEJMoa013168. [DOI] [PubMed] [Google Scholar]
- 22.Fung JW, Yu CM, Yip G, Zhang Y, Chan H, Kum CC. Sanderson JE: Variable left ventricular activation pattern in patients with heart failure and left bundle branch block. Heart (British Cardiac Society) 2004;90:17–9. doi: 10.1136/heart.90.1.17. [DOI] [PMC free article] [PubMed] [Google Scholar]
- 23.Durrer D, Van Dam RT, Freud G, Janse M, Meijler F, Arzbaecher R. Total excitation of the isolated human heart. Circulation. 1970;41:899–912. doi: 10.1161/01.cir.41.6.899. [DOI] [PubMed] [Google Scholar]
- 24.Ramanathan C, Jia P, Ghanem R, Ryu K, Rudy Y. Activation and repolarization of the normal human heart under complete physiological conditions. Proceedings of the National Academy of Sciences; 2006. pp. 6309–6314. [DOI] [PMC free article] [PubMed] [Google Scholar]
- 25.Auricchio A, Fantoni C, Regoli F, Carbucicchio C, Goette A, Geller C, Kloss M, Klein H. Characterization of left ventricular activation in patients with heart failure and left bundle-branch block. Circulation. 2004;109:1133–1139. doi: 10.1161/01.CIR.0000118502.91105.F6. [DOI] [PubMed] [Google Scholar]
- 26.Bradley DJ, Bradley EA, Baughman KL, Berger RD, Calkins H, Goodman SN, Kass DA, Powe NR. Cardiac resynchronization and death from progressive heart failure: a meta-analysis of randomized controlled trials. JAMA. 2003;289:730–40. doi: 10.1001/jama.289.6.730. [DOI] [PubMed] [Google Scholar]
- 27.Cuculich PS, Zhang J, Wang Y, Desouza KA, Vijayakumar R, Woodard PK, Rudy Y. The electrophysiologic cardiac ventricular substrate in patients after myocardial infarction: noninvasive characterization with electrocardiographic imaging. J Am Coll Cardiol. 2011;58:1893–1902. doi: 10.1016/j.jacc.2011.07.029. [DOI] [PMC free article] [PubMed] [Google Scholar]
- 28.Rudy Y. Noninvasive electrocardiographic imaging of arrhythmogenic substrates in humans. Circulation Research. 2013;112:863–874. doi: 10.1161/CIRCRESAHA.112.279315. [DOI] [PMC free article] [PubMed] [Google Scholar]
- 29.Thibault B, Ducharme A, Harel F, et al. Left ventricular versus simultaneous biventricular pacing in patients with heart failure and a QRS complex ≥120 milliseconds. Circulation. 2011;124:2874–2881. doi: 10.1161/CIRCULATIONAHA.111.032904. [DOI] [PubMed] [Google Scholar]
- 30.Ghosh S, Rhee EK, Avari JN, Woodard PK, Rudy Y. Cardiac Memory in WPW Patients: Noninvasive Imaging of Activation and Repolarization before and after Catheter Ablation. Circulation. 2008;118:907–915. doi: 10.1161/CIRCULATIONAHA.108.781658. [DOI] [PMC free article] [PubMed] [Google Scholar]
- 31.Hocini M, Shah AJ, Cochet H, Maury P, Arnaud D, Haissaguerre M. Noninvasive electrocardiomapping facilitates previously failed ablation of right appendage diverticulum associated life-threating accessory pathway. J Cardiovasc Electrophysiolol. 2013;24:583–585. doi: 10.1111/jce.12053. [DOI] [PubMed] [Google Scholar]
- 32.Wang Y, Li l, Cuculich PS, Rudy Y. Electrocardiogarphic imaging of ventricular bigeminy in a human subject. Circ Arrhythmia Electrophysiol. 2008;1:74–75. doi: 10.1161/CIRCEP.107.753194. [DOI] [PMC free article] [PubMed] [Google Scholar]
- 33.Zhang J, Desouza KA, Cuculich PS, Cooper DH, Chen J, Rudy Y. Continuous ECGI mapping of spontaneous VT initiation, continuation, and termination with antitachycardia pacing. Heart Rhythm. 2013;10:1244–1245. doi: 10.1016/j.hrthm.2012.01.001. [DOI] [PMC free article] [PubMed] [Google Scholar]
- 34.Wang Y, Cuculich PS, Zhang J, Desouza KA, Vijayakumar R, Chen J, Faddis MN, Lindsay BD, Smith TW, Rudy Y. Noninvasive electroanatomic mapping of human ventricular arrhythmias with electrocardiographic imaging (ECGI) Science Transl Med. 2011;3:1–10. doi: 10.1126/scitranslmed.3002152. [DOI] [PMC free article] [PubMed] [Google Scholar]
- 35.Cuculich PS, Wang Y, Lindsay BD, et al. Noninvasive characterization of epicardial activation in humans with diverse atrial fibrillation patterns. Circulation. 2010;122:1364–1372. doi: 10.1161/CIRCULATIONAHA.110.945709. [DOI] [PMC free article] [PubMed] [Google Scholar]
- 36.Wang Y, Cuculich PS, Woodard PK, Lindsay BD, Rudy Y. Focal atrial tachycardia after pulmonary vein isolation: noninvasive mapping with electrocardiographic imaging (ECGI) Heart Rhythm. 2007;4:1082–1084. doi: 10.1016/j.hrthm.2007.04.014. [DOI] [PMC free article] [PubMed] [Google Scholar]
- 37.Shah AJ, Hocini M, Xhaet O, et al. Validation of novel 3-dimensional eletrocardiographic mapping of atrial tachycardias. Invasive mapping and ablation. A multicenter study. J Am Coll Cardiol. 2013;62:889–97. doi: 10.1016/j.jacc.2013.03.082. [DOI] [PubMed] [Google Scholar]
- 38.Moe GK, Abildskov JA. Atrial fibrillation as a self-sustaining arrhythmia independent of focal discharge. Am Heart J. 1959;58:59–70. doi: 10.1016/0002-8703(59)90274-1. [DOI] [PubMed] [Google Scholar]
- 39.Allessie MA, Lammers WJEP, Bonke FIM, Hollen SJ. Experimental evaluation of Moe's multiple wavelet hypothesis of atrial fibrillation. In: Zipes DP, Jalife J, editors. Cardiac Electrophysiology ad Arrhythmias. Grune & Stratton; New York: 1985. pp. 265–75. [Google Scholar]
- 40.Scheussler RB, Grayson TM, Bromberg BI, Cox JL. Boineau JP: Cholinergically mediated tachyarrhythmias induced by a single extrastimulus in the isolated canine right atrium. Circ Res. 1992;71:12–540167. doi: 10.1161/01.res.71.5.1254. [DOI] [PubMed] [Google Scholar]
- 41.Kumagai K, Khrestian C. Waldo AL: Simultaneous multisite mapping studies during induced atrial fibrillation in the sterile pericarditis model: Insights into the mechanism of its maintenance. Circulation. 1997;95:511–521. doi: 10.1161/01.cir.95.2.511. [DOI] [PubMed] [Google Scholar]
- 42.Skanes AC, Mandapati R, Berenfeld O, Davidenko JM. Jalife J: Spatiotemporal periodicity during atrial fibrillation in the isolated sheep heart. Circulation. 1998;98:1236–1248. doi: 10.1161/01.cir.98.12.1236. [DOI] [PubMed] [Google Scholar]
- 43.Mandapati R, Skanes A, Chen J, Berenfeld O. Jalife J: Stable microreentrant sources as a mechanism of atrial fibrillation in the isolated sheep heart. Circulation. 2000;101:194–199. doi: 10.1161/01.cir.101.2.194. [DOI] [PubMed] [Google Scholar]
- 44.Lee S, Sahadevan J, Khrestian C, Durand DM, Waldo AL. High density mapping of atrial fibrillation during vagal nerve stimulation in the canine heart: Restudying the Moe Hypothesis. J Cardiovasc Electrophysiol. 2013;24:328–335. doi: 10.1111/jce.12032. [DOI] [PubMed] [Google Scholar]
- 45.Cox JL, Canavan TE, Schuessler RB, Cain ME, Lindsay BD, Stone C, Smith PI, Corr BP, Boineau JP. The surgical treatment of atrial fibrillation. II. Intraoperative electrophysiologic mapping and description of the electrophysiolgic basis of atrial flutter and atrial fibrillation. J Thorac Cardiovasc Surg. 1991;101:406–26. [PubMed] [Google Scholar]
- 46.Ferguson TB, Jr, Schuessler RB, Hand DE, Boineau JP, Cox JL. Lessons learned from computerized mapping of the atrium. Surgery for atrial fibrillation and flutter. J Electrocardiology. 1993;(26 Supple):210–219. [PubMed] [Google Scholar]
- 47.Sahadevan J, Kyungmoo R, Peltz L, Khrestia CM, Stewart RW, Markowitz AH, Waldo AL. Epicardial mapping of chronic atrial fibrillation in patients. Preliminary observations. Circulation. 2004;110:3293–3299. doi: 10.1161/01.CIR.0000147781.02738.13. [DOI] [PubMed] [Google Scholar]
- 48.Haissaguerre M, Hocini M, Denis A, et al. Driver domains in persistent atrial fibrillation. Circulation. 2014;130:530–538. doi: 10.1161/CIRCULATIONAHA.113.005421. [DOI] [PubMed] [Google Scholar]


