Abstract
Recently, large-scale gene expression profiling is often performed using RNA extracted from unfixed frozen or formalin-fixed paraffin embedded (FFPE) samples. However, both types of samples have drawbacks in terms of the morphological preservation and RNA quality. In the present study, we investigated 30 human prostate tissues using the PFA-AMeX method (fixation using paraformaldehyde (PFA) followed by embedding in paraffin by AMeX) with a DNA microarray combined with laser-capture microdissection. Morphologically, in contrast to the case of atypical adenomatous hyperplasia, loss of basal cells in prostate adenocarcinomas was as obvious in PFA-AMeX samples as in FFPE samples. As for quality, the loss of rRNA peaks 18S and 28S on the capillary electropherograms from both FFPE and PFA-AMeX samples showed that the RNA was degraded equally during processing. However, qRT-PCR with 3’ and 5’ primer sets designed against human beta-actin revealed that, although RNA degradation occurred in both methods, it occurred more mildly in the PFA-AMeX samples. In conclusion, the PFA-AMeX method is good with respect to morphology and RNA quality, which makes it a promising tool for DNA microarrays combined with laser-capture microdissection, and if the appropriate RNA quality criteria are used, the capture of credible GeneChip data is well over 80% efficient, at least in human prostate specimens.
Keywords: PFA, AMeX method, laser-capture microdissection, RNA quality, DNA microarray, prostate
Introduction
Over the last 15 years, large-scale gene expression profiling of cancer with DNA microarray technology has provided crucial information that contributes to understanding tumor biology and predicting cancer progression and/or response to treatment1. Although the studies have provided informative knowledge, the sources of RNA for the earlier works were extracted from homogenized whole cancer tissues of grossly dissected organs or from thinly sliced frozen sections that were composed of heterogeneous elements of tumors and the surrounding noncancerous tissues, including normal parenchymal and stromal cells and other infiltrating cells. These heterogeneous tissues may confound molecular analysis because it is currently impossible to know which RNA changes are due to which cellular components in a given tissue lysate2.
To overcome this drawback, laser-capture microdissection (LCM) systems were developed to obtain tissue elements separately as a source of RNA2,3,4,5,6,7,8. Although frozen tissue is widely used and it preserves a high-quality yield of RNA, it may not provide the level of morphological detail necessary for dissection of tissue using this technology2. For instance, it is well known that in frozen specimens, prostatic adenocarcinoma Gleason patterns 2 and 3 are difficult to distinguish from a noncancerous region, such as atypical adenomatous hyperplasia, because of their morphological similarities9,10,11. In contrast, the process of fixing tissue by formalin and paraffin embedding (FFPE) is considered to preserve good morphology, but the loss of transcriptional information in FFPE tissues has been discussed in several previous reports2, 12,13,14,15,16,17,18. To overcome this trade-off relationship between RNA quality and morphology, a tissue-processing method other than FFPE has become increasingly needed15,16,17,18,19.
Previously, we reported that the PLP-AMeX method of tissue processing is superior, because it preserves antigens and enzymes well and is applicable to the in situ hybridization technique20, 21. In the current report, first we compared the RNA quality of three tissue-processing methods (frozen, FFPE, and PFA-AMeX) using xenograft tissues of a prostatic cancer cell line to avoid deviation of the clinical setting. After that, we obtained RNA extracts from clinical prostatic samples and, after selecting ones with high RNA quality, used them to test what effect the LCM/DNA microarray combination has on the abovementioned trade-off relationship.
Materials and Methods
Human prostate specimens
Fresh surgical specimens of 13 prostatic adenocarcinomas and 17 benign prostatic hyperplasias (BPHs) were provided by patients that gave their informed consent, as approved by the ethical committee at PharmaLogicals Research Pte. Ltd. (Singapore) and Parkway Laboratory Services in Singapore, during the period from May 2003 to March 2005. Full pathology reports containing the diagnoses for all cases were also provided by pathologists at Parkway Laboratory Services.
Each of the thirty surgical prostate specimens was divided into three pieces under sterile conditions. One of the three pieces of each tissue was prepared as a fresh frozen (F-F) block with Tissue-Tek® O.C.T. Compound (Sakura Finetek Japan Co., Ltd., Tokyo, Japan) and with dry ice/acetone–cooled hexane; another piece was fixed in 10% formalin neutral buffer solution (pH 7.4) for 16–24 h at room temperature and embedded in paraffin wax following conventional procedures (FFPE); and the remaining piece was fixed in 4% paraformaldehyde (PFA) in 0.01 mol/L phosphate buffer (pH 7.4) for 16–24 h at 4°C and embedded into paraffin using the AMeX method (PFA-AMeX). After processing of hematoxylin and eosin (H&E) sections, the F-F, FFPE and PFA-AMeX blocks were stored for 2 to 22 months at −80°C, room temperature and 4°C, respectively.
Preparation of an LNCaP xenograft model
Six 5-week-old male NOD/SCID/γcnull mice22 were provided by the breeding facility at the Central Institute for Experimental Animals (Kanagawa, Japan) and subjected to the experiment between 8 and 11 weeks of age. All animals were housed in plastic cages within a bioBubble system (bioBubble, Fort Collins, CO, USA) in a specific pathogen-free state at a temperature of 23 ± 1°C with 60–80% humidity and a 12 h light/dark cycle. The animals were allowed free access to food and drinking water.
The human prostate carcinoma cell line LNCaP was obtained from the American Type Culture Collection (Manassas, VA, USA) and cultured in RPMI 1640 medium supplemented with 10% (v/v) fetal bovine serum. The LNCaP cells (2×10⁶) were suspended in 50% MatrigelTM (Becton, Dickinson and Company, Franklin Lakes, NJ, USA) and inoculated subcutaneously into the flanks of the mice. The LNCaP xenograft mice were sacrificed by exsanguination under deep anesthesia 54–67 days after inoculation. Prior to use, all F-F, FFPE and PFA-AMeX blocks were stored for several months at −80°C, room temperature and 4°C, respectively. All studies and procedures involving animal subjects were approved by the Animal Care and Use Committee at PharmaLogicals Research. The animals used in this experiment were treated in accordance with the Animal Research Guideline of PharmaLogicals Research.
RNA extraction and RNA quality evaluation
F-F sections (4 μm thick) of LNCaP xenograft tissue were cut with a Leica CM3050 (Leica Microsystems K.K., Tokyo, Japan) at −18°C, transferred to a microcentrifuge tube, immediately processed by adding 350 μL Buffer RLT (Qiagen, Hilden, Germany), and stored at −80°C. Using an RNeasy MinElute Cleanup Kit (Qiagen), RNA was extracted from F-F samples (whole section) as instructed by the manufacturer.
All FFPE and PFA-AMeX sections (both 10 μm thick) of LNCaP xenograft tissue or human prostate specimens were cut with a microtome at room temperature and transferred to a microcentrifuge tube. These samples were immediately processed for protein digestion using a lysis buffer (20 mM Tris-HCl, 20 mM EDTA, 1% SDS, 500 μg/mL Proteinase K, pH7.5) with overnight incubation at 60°C, followed by incubation for 10 min at 95°C, and stored at −80°C. The RNA was extracted from FFPE and PFA-AMeX samples (whole section) using TRIzol LS Reagent (Invitrogen, Carlsbad, CA, USA), according to the manufacturer’s instructions.
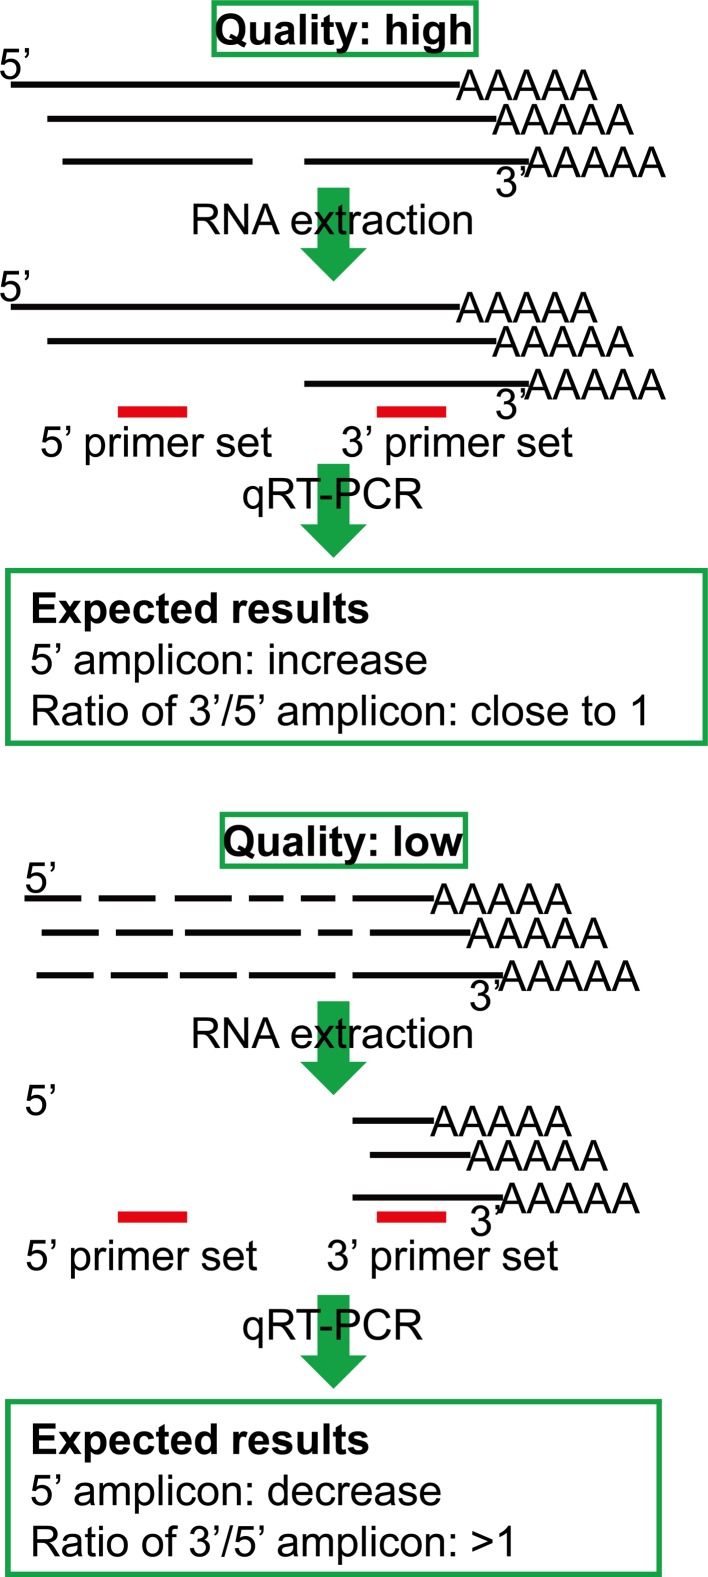
The quality and yield of extracted total RNAs were assessed using an Agilent Bioanalyzer 2100 system (Agilent Technologies, Santa Clara, CA, USA) and RiboGreen RNA quantitation kit (Invitrogen) according to the manufacturers’ instructions. In addition to this, we also checked the RNA quality with a quantitative reverse transcriptase polymerase chain reaction (qRT-PCR) assay using 3’ and 5’ primer sets for beta-actin according to a user guide distributed by Life Technologies (Carlsbad, CA, USA) (Fig. 1). In this method, two pairs of primers were designed against the human beta-actin sequence at positions 1369 (5’ primer set: 5’-ACA ATG TGG CCG AGG ACT TT (forward), 5’-TGT GTG GAC TTG GGA GAG GA (reverse)) and 1600 (3’ primer set: 5’-TTG TTT TAT TTT GAA TGA TGA GCC TTC GT (forward), 5’-GGT GTG CAC TTT TAT TCA ACT GGT C (reverse)). The amplification was carried out using a LightCycler system (Roche Diagnostics, Mannheim, Germany), and amounts of the product and the ratio of both primer sets were calculated. Based on the concept of this quality control system, if the RNA structure was intact, the amount of PCR products from the 3’ and 5’ primer sets would be almost the same, and theoretically, the ratio would be near to 1. On the other hand, because RNA was extracted by oligo(dT), if the RNA structure was degraded, the PCR product from the 5’ primer would decrease, while the 3’ amplicon would remain the same, and this would increase the 3’/5’ ratio (Fig. 1). Based on this quality check, we set a cutoff line for the RNA quality of clinical samples in order to select samples for the next step of evaluating LCM/DNA microarray analysis.
Fig. 1.
Schematic drawings of the assay concept for evaluating RNA quality by qRT-PCR using 3’and 5’ primer sets for beta-actin. Based on the assay concept, the amounts of 3’ and 5’ amplicons will be close to equal in high-quality RNA samples, but the amount of 5’ amplicon will be decreased in low-quality RNA samples. Black bar: mRNA. Red bar: primer sets.
LCM and DNA microarray analysis
To obtain a homogeneous cellular population of prostate adenocarcinoma and hyperplasia for analysis, LCM (AS-LMD; Leica Microsystems K.K.) was performed on samples processed by FFPE and PFA-AMeX. FFPE and PFA-AMeX sections (both 4 μm thick) of human tissue were cut at room temperature, floated in a RNase-free water bath and transferred to FrameSlides® (Leica Microsystems K.K.) for LCM. About 10000 cells were laser microdissected from adenocarcinoma and BPH samples, and each microdissected sample was processed to extract total RNA by the procedure mentioned above.
After RNA extraction, biotin-labeled cRNA was generated from total RNA by the two-cycle amplification method according to Small Sample Labeling Protocol version II (Affymetrix, Santa Clara, CA, USA). In the first cycle, 10 ng of total RNA was used to synthesize cDNA using an oligonucleotide probe with the 24 oligo-dT plus T7 promoter as the primer. Following double-stranded cDNA synthesis, the products were purified by ethanol extraction, and antisense cRNA was generated through in vitro transcription using a MEGAscript T7 kit (Ambion, Foster City, CA, USA). In the second cycle, the cRNA was used to synthesize cDNA using two oligonucleotide probes as primers, the 24 oligo-dT plus T7 promoter and Random Primers (Invitrogen). The same procedures for purification and generation of cRNA was repeated. Twenty micrograms of the biotin-labeled cRNA was fragmented at 95°C for 35 min (40 mM Tri-acetate, pH 8.1, 100 mM KOAc, 30 mM MgOAC), and 12.5 μg of total fragmented cRNA was hybridized to Human X3P GeneChip® Arrays (Affymetrix) for 16 h at 45°C with constant rotation (60 rpm). Fluorescence was detected using an Affymetrix GeneChip Scanner 3000 (Affymetrix), and image analysis of each GeneChip was done with the GCOS software from Affymetrix using the standard default settings.
To assess the quality of the GeneChip data, the percentage of present calls (%P-call: percentage of transcripts that are considered significantly hybridized to the chip (present) by the algorithm) and scaling factor (SF: related to the overall intensity of the chip and used to confirm a similar level of signal intensity and staining throughout the samples) were compared with generally accepted levels for these parameters23, 24.
Results
Morphology of prostate lesions in specimens processed by F-F, FFPE and PFA-AMeX
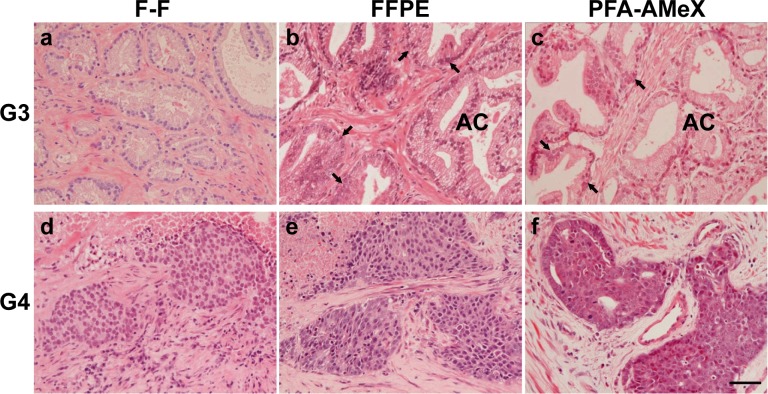
In general, histopathological classification of prostatic cancer was made according to Gleason grading, which focuses on structural atypia rather than cellular atypia or differentiation25. In prostatic adenocarcinoma with Gleason pattern 4, cancer cells had lost their normal ductal structure and were easily distinguishable from the surrounding connective tissues in H&E sections made from all F-F, FFPE and PFA-AMeX samples (Fig. 2). On the other hand, a key finding of Gleason pattern 3 is loss of basal cells, especially in small acinar proliferation, and although this was recognizable in the FFPE and PFA-AMeX samples, the difficulty of recognizing basal cells in the F-F sections made it impossible to distinguish tumor cells at this grade from the surrounding hyperplastic tissue (Fig. 2).
Fig. 2.
Histological features of prostatic adenocarcinoma Gleason patterns 3 (a, b, c), and 4 (d, e, f). In adenocarcinomas with Gleason pattern 3, the basal cells were indistinct in F-F specimens (a) and were clearly identified in glands adjacent to adenocarcinoma in FFPE (b) and PFA-AMeX specimens (c). In adenocarcinomas with Gleason pattern 4, cancer cells were clearly distinguishable from the noncancerous and surrounding connective tissues of F-F (d), FFPE (e) and PFA-AMeX specimens (f). AC, adenocarcinoma. Arrows, distinguishable basal cells. H&E staining: bar = 50 μm.
Quality and quantity of total RNA extracted from LNCaP xenograft tissues processed by F-F, FFPE and PFA-AMeX
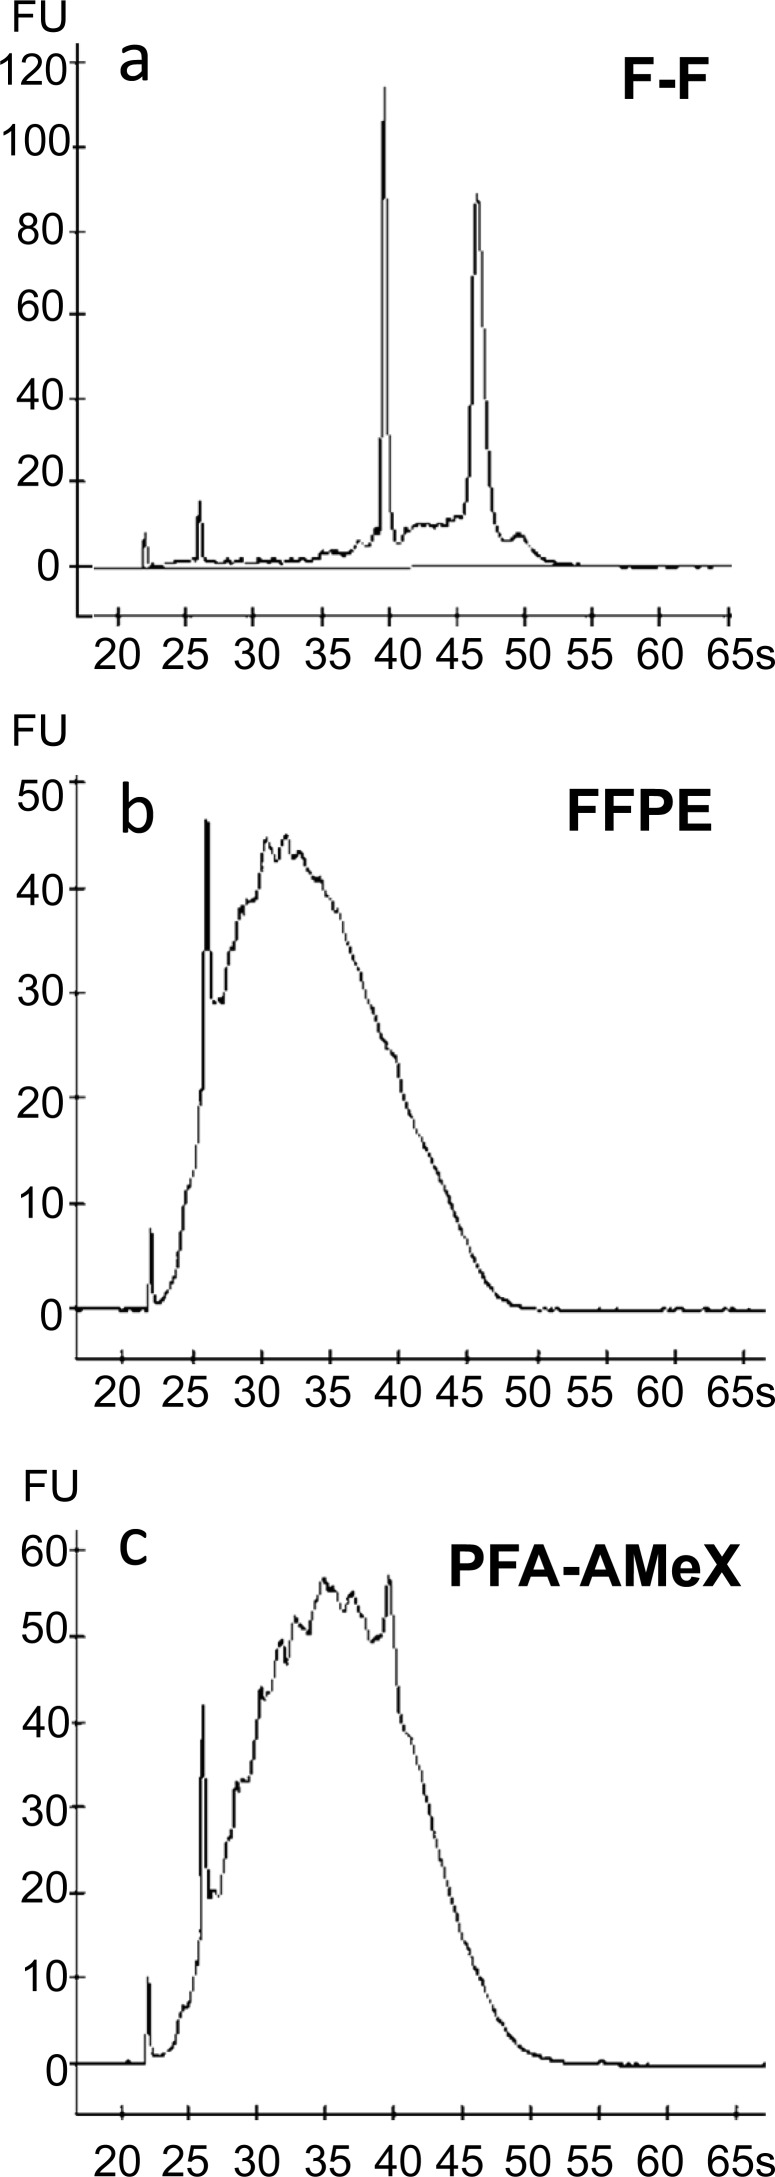
Almost the same amount of total RNA was extracted from LNCaP-xenograft tissue processed by the three different methods (Table 1). On capillary electropherograms, the peaks of 18S and 28S rRNA were recognizable in the F-F samples with small amounts of degraded RNA of less than 200 bp, but in the FFPE and PFA-AMeX samples, the peaks of 18S and 28S rRNA had disappeared, with almost all the RNA degraded into fragments of less than 1000 bp (Fig. 3).
Table 1. The Yield of Total RNA from F-F, FFPE and PFA-AMeX Samples of LNCaP Xenograft Tissue.

Fig. 3.
RNA quality of xenograft tissues evaluated with a bioanalyzer. Typical capillary electropherograms of total RNA from F-F (a), FFPE (b) and PFA-AMeX (c) samples of LNCaP xenograft tissue.
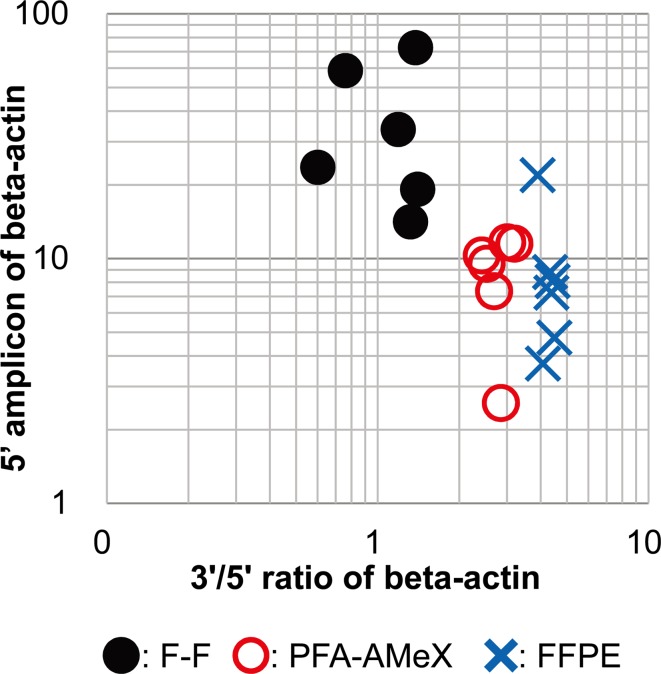
Using the same RNA samples, the amount of beta-actin mRNA was measured by qRT-PCR with 3’ and 5’ primer sets designed against human beta-actin, and the amounts of amplicons and their 3’/5’ ratio were calculated (Fig. 1). The ratios were low in F-F samples, high in FFPE samples and between the other values in PFA-AMeX samples (Table 1, Fig. 4). A higher amount of 5’ amplicon was obtained from F-F processing, while the amounts were almost equal for the other processing methods (Table 1, Fig. 4).
Fig. 4.
RNA quality of xenograft tissues evaluated by measuring beta-actin mRNA. Log scale scatter plot for 5’ amplicon amounts and 3’/5’ ratios of beta-actin in F-F, FFPE and PFA-AMeX samples of LNCaP xenograft tissue.
Quality and quantity of total RNA extracted from human prostate samples processed by FFPE and PFA-AMeX
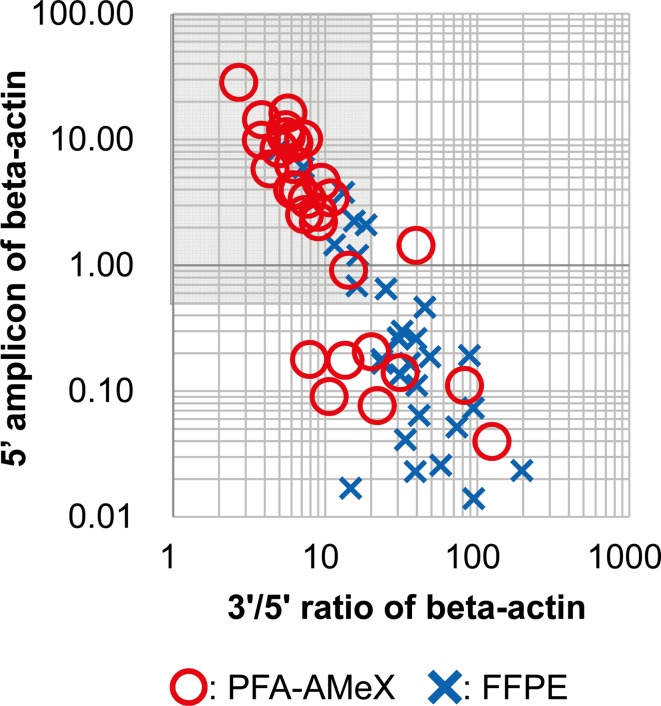
Total RNA was extracted from whole sections of FFPE- and PFA-AMeX-processed human prostate specimens (adenocarcinoma, n=13; BPH, n=17); the amount of beta-actin mRNA was measured by qRT-PCR, and the 3’/5’ ratio was calculated (Fig. 1). The amounts of 5’ amplicons were higher, and the ratio of 3’/5’ amplicons was lower in PFA-AMeX tissue than in FFPE tissue (Table 2, Fig. 5).
Table 2. The Yield of Total RNA in FFPE and PFA-AMeX Samples of Human Prostate Tissue.

Fig. 5.
RNA quality of human prostate samples evaluated by measuring beta-actin mRNA. Log scale scatter plot for 5’ amplicon amounts and 3’/5’ ratios of beta-actin from FFPE and PFA-AMeX samples of human prostate tissue. The Shaded area shows the cutoff line for RNA quality (5’ amplicon ≥0.5, 3’/5’ ratio ≤20).
Based on the above data, we set our cutoff line for RNA quality as a 3’/5’ amplicon ratio ≤20 and 5’ amplicon amount ≥0.5 (shaded area of Fig. 5). Based on this line, 8 samples (adenocarcinoma, n=4; BPH, n=4) of FFPE tissue (25.8%) and 21 samples (adenocarcinoma, n=6; BPH, n=15) of PFA-AMeX tissue (70.0%) were accepted and subjected to GeneChip analysis.
Quality of GeneChip data from accepted human prostate samples processed by FFPE and PFA-AMeX
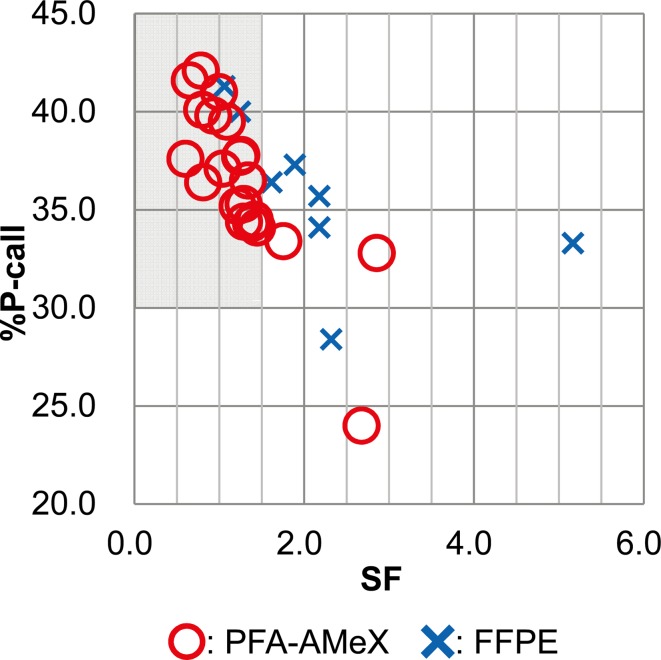
Human prostate tissues processed by FFPE and PFA-AMeX and accepted according to the cutoff line mentioned above were microdissected, total RNAs were extracted and hybridized for Human X3P GeneChip® Arrays (Affymetrix, Santa Clara, CA, USA). In FFPE tissues, the averages of %Pcall and SF were 35.81% and 2.21, respectively, while in PFA-AMeX-processed tissues, %Pcall and SF were 36.44% and 1.28, respectively (Fig. 6). Once the generally accepted criteria for GeneChip data quality (%Pcall ≥ 30% and SF ≤ 1.5)12, 14, 16, were applied, 2 of the FFPE (25.0%) and 18 of PFA-AMeX (85.7%) samples were found to meet the criteria (shaded area of Fig. 6).
Fig. 6.
Evaluating the quality of GeneChip human prostate data. Scatter plot of %Pcall and SF of GeneChip data for human prostate tissue from FFPE and PFA-AMeX samples. The shaded area shows the sector that matched the GeneChip QC criteria (%Pcall ≥30, SF ≤1.5).
Discussion
The DNA microarray is a powerful tool for investigating the expression patterns of thousands of genes, and when combined with LCM technology, it is capable of obtaining the gene expression profiles of specific tissue elements within heterogeneous tissues2. For this technique to provide comprehensive data, the trade-off relationship between the RNA quality and the morphological detail of the tissue specimens needs to be balanced, and to balance the relationship, adequate tissue fixation and processing methods are needed15,16,17,18,19. As a possible candidate for improving the trade-off relationship, we evaluated the effects of the PFA-AMeX method on LCM/DNA microarray analysis.
Regarding morphology, prostate cancer cells with Gleason pattern 4 were recognized and distinguishable from the surrounding noncancerous tissues, even in F-F processed samples, but in those with Gleason pattern 3, in which small acinar cells resemble those of normal duct or precursor lesions, such as atypical adenomatous hyperplasia, it became crucial to discern a key feature, such as loss of basal cells. Morphological preservation in the F-F-processed samples was not sufficient to display this key feature. But in FFPE and PFA-AMeX samples, this feature was recognizable and the morphological details of both these types of tissue processing were considered to be equally appropriate for the purpose.
In this report, we started comparing the difference in RNA quality between F-F, FFPE and PFA-AMeX processing methods by looking at LNCaP xenograft samples, because the inter-sample differences in RNA content and quality are considered to be minimal in the laboratory setting. On the capillary electropherograms, the peaks of 18S and 28S rRNA were equally unrecognizable in both the FFPE and PFA-AMeX samples, and we considered that RNA was degraded in the processing. As for the PCR products of the 3’ and 5’ beta-actin primer sets from LNCaP xenograft tissues that were processed by F-F, the amounts of amplicons were almost the same for both sets, and the amount of 5’ amplicon detected indicated that RNA was sufficiently intact. With the other two types of processing of LNCaP xenograft tissues, the 3’ amplicon was increased more in FFPE than in PFA-AMeX, so it was considered that RNA degradation occurred in both methods but more mildly in the PFA-AMeX samples. Although the differences in RNA quality between FFPE and PFA-AMeX were not obvious in the capillary electropherograms, the results led us to consider that, in fixative-processed tissues, the 3’/5’ ratio and 5’ amplicon of beta-actin were possible markers for RNA quality, and therefore we decided to test the feasibility of this idea in the clinical setting.
Since the variation in 3’/5’ ratios and amounts of amplicons between the xenograft and clinical samples was probably due to a variation in clinical procedure and almost same relationships in RNA quality data were observed in clinical samples, we considered that the results from the clinical samples made it possible to set the cutoff line for further LCM/GeneChip analysis. After comparing the QC parameters of the collected GeneChip data with the generally accepted levels (%Pcall ≥30%, SF ≤1.5)12, 14, 16, we found that 25.0% (2 out of 8) of the FFPE samples and 85.7% (19 out of 21) of the PFA-AMeX samples were reliable. From those results, we considered that, in the case of PFA-AMeX, the RNA quality cutoff line is fairly reasonable for supplying reliable data from LCM/GeneChip analysis. In the case of FFPE, however, the RNA quality cutoff line is not effective enough to avoid costly waste of GeneChips, and a stricter cutoff line should be considered even though the number of acceptable samples will be very limited.
To date, although the definitive reason why RNA preservation is superior in PFA-AMeX is not known, it is known that the technique also preserves several antigens, nucleic acids, and the activity of some enzymes well. There is also speculation that the level of cross-linking of protein and RNAs is minimized in the technique20, 21, and this notion might explain why higher amounts of RNA were extracted with low degradation in PFA-AMeX than in FFPE. In addition, despite the fact that the RNA quality of FFPE-processed clinical tissues degraded the longer they were archived14, 26, the accepted samples in the current study were archived for as long as up to 1.7 years, so we consider that the RNA quality of the PFA-AMeX samples is well preserved for at least that period of time.
In conclusion, tissue processed by the PFA-AMeX technique retains good morphology when compared with that processed by the F-F technique, and also supplies well-preserved, high quality RNA compared with tissue processed by the FFPE technique. Because the trade-off relationship in morphological details and RNA quality is balanced better in PFA-AMeX processing than in other forms of processing, we consider this technique a promising tool for LCM/DNA microarray analysis. In the case of prostate cancer, a report of detailed gene expression profiling using LCM/DNA microarray analysis with frozen sections was published previously, and the authors successfully suggested a molecular concept model of prostate cancer progression5. Since the RNA sources in this report were obtained from the “stromal” or “epithelial” components separately, we think that if the RNA source of the epithelial component is further separated into the “cancerous epithelium” and/or “adjacent noncancerous epithelium” using the current PFA-AMeX method, it may provide more precise information on prostatic cancer biology.
Acknowledgments
We would like to express our thanks to Ms. Fang Yanting for her skillful assistance.
References
- 1.Chibon F. Cancer gene expression signatures - the rise and fall? Eur J Cancer. 49: 2000–2009 2013. [DOI] [PubMed] [Google Scholar]
- 2.Espina V, Wulfkuhle JD, Calvert VS, VanMeter A, Zhou W, Coukos G, Geho DH, Petricoin EF, 3rd , and Liotta LA. Laser-capture microdissection. Nat Protoc. 1: 586–603 2006. [DOI] [PubMed] [Google Scholar]
- 3.Grützmann R, Pilarsky C, Ammerpohl O, Lüttges J, Böhme A, Sipos B, Foerder M, Alldinger I, Jahnke B, Schackert HK, Kalthoff H, Kremer B, Klöppel G, and Saeger HD. Gene expression profiling of microdissected pancreatic ductal carcinomas using high-density DNA microarrays. Neoplasia. 6: 611–622 2004. [DOI] [PMC free article] [PubMed] [Google Scholar]
- 4.Sugiyama Y, Farrow B, Murillo C, Li J, Watanabe H, Sugiyama K, and Evers BM. Analysis of differential gene expression patterns in colon cancer and cancer stroma using microdissected tissues. Gastroenterology. 128: 480–486 2005. [DOI] [PubMed] [Google Scholar]
- 5.Tomlins SA, Mehra R, Rhodes DR, Cao X, Wang L, Dhanasekaran SM, Kalyana-Sundaram S, Wei JT, Rubin MA, Pienta KJ, Shah RB, and Chinnaiyan AM. Integrative molecular concept modeling of prostate cancer progression. Nat Genet. 39: 41–51 2007. [DOI] [PubMed] [Google Scholar]
- 6.Boersma BJ, Reimers M, Yi M, Ludwig JA, Luke BT, Stephens RM, Yfantis HG, Lee DH, Weinstein JN, and Ambs S. A stromal gene signature associated with inflammatory breast cancer. Int J Cancer. 122: 1324–1332 2008. [DOI] [PubMed] [Google Scholar]
- 7.Rohrbeck A, Neukirchen J, Rosskopf M, Pardillos GG, Geddert H, Schwalen A, Gabbert HE, von Haeseler A, Pitschke G, Schott M, Kronenwett R, Haas R, and Rohr U-P. Gene expression profiling for molecular distinction and characterization of laser captured primary lung cancers. J Transl Med. 6: 69–85 2008. [DOI] [PMC free article] [PubMed] [Google Scholar]
- 8.Andres SA, and Wittliff JL. Relationships of ESR1 and XBP1 expression in human breast carcinoma and stromal cells isolated by laser capture microdissection compared to intact breast cancer tissue. Endocrine. 40: 212–221 2011. [DOI] [PubMed] [Google Scholar]
- 9.Epstein JI. Diagnosis and reporting of limited adenocarcinoma of the prostate on needle biopsy. Mod Pathol. 17: 307–315 2004. [DOI] [PubMed] [Google Scholar]
- 10.Srigley JR. Benign mimickers of prostatic adenocarcinoma. Mod Pathol. 17: 328–348 2004. [DOI] [PubMed] [Google Scholar]
- 11.Chrisofos M, Papatsoris AG, Lazaris A, and Deliveliotis C. Precursor lesions of prostate cancer. Crit Rev Clin Lab Sci. 44: 243–270 2007. [DOI] [PubMed] [Google Scholar]
- 12.Scicchitano MS, Dalmas DA, Bertiaux MA, Anderson SM, Turner LR, Thomas RA, Mirable R, and Boyce RW. Preliminary comparison of quantity, quality, and microarray performance of RNA extracted from formalin-fixed, paraffin-embedded, and unfixed frozen tissue samples. J Histochem Cytochem. 54: 1229–1237 2006. [DOI] [PubMed] [Google Scholar]
- 13.Coudry RA, Meireles SI, Stoyanova R, Cooper HS, Carpino A, Wang X, Engstrom PF, and Clapper ML. Successful application of microarray technology to microdissected formalin-fixed, paraffin-embedded tissue. J Mol Diagn. 9: 70–79 2007. [DOI] [PMC free article] [PubMed] [Google Scholar]
- 14.Frank M, Döring C, Metzler D, Eckerle S, and Hansmann M-L. Global gene expression profiling of formalin-fixed paraffin-embedded tumor samples: a comparison to snap-frozen material using oligonucleotide microarrays. Virchows Arch. 450: 699–711 2007. [DOI] [PubMed] [Google Scholar]
- 15.Cox ML, Eddy SM, Stewart ZS, Kennel MR, Man MZ, Paulauskis JD, and Dunstan RW. Investigating fixative-induced changes in RNA quality and utility by microarray analysis. Exp Mol Pathol. 84: 156–172 2008. [DOI] [PubMed] [Google Scholar]
- 16.Linton KM, Hey Y, Saunders E, Jeziorska M, Denton J, Wilson CL, Swindell R, Dibben S, Miller CJ, Pepper SD, Radford JA, and Freemont AJ. Acquisition of biologically relevant gene expression data by Affymetrix microarray analysis of archival formalin-fixed paraffin-embedded tumours. Br J Cancer. 98: 1403–1414 2008. [DOI] [PMC free article] [PubMed] [Google Scholar]
- 17.Farragher SM, Tanney A, Kennedy RD, and Paul Harkin D. RNA expression analysis from formalin fixed paraffin embedded tissues. Histochem Cell Biol. 130: 435–445 2008. [DOI] [PubMed] [Google Scholar]
- 18.Fedorowicz G, Guerrero S, Wu TD, and Modrusan Z. Microarray analysis of RNA extracted from formalin-fixed, paraffin-embedded and matched fresh-frozen ovarian adenocarcinomas. BMC Med Genomics. 2: 23–33 2009. [DOI] [PMC free article] [PubMed] [Google Scholar]
- 19.Jonigk D, Modde F, Bockmeyer CL, Becker JU, and Lehmann U. Chapter 5. Optimized RNA extraction from non-deparaffinized, laser-microdissected material. In: Laser Capture Microdissection. Methods and Protocols. 2nd ed. GI Murray (ed). Humana Press, New York. 67-75. 2011. [DOI] [PubMed] [Google Scholar]
- 20.Suzuki M, Adachi K, Ogawa Y, Karasawa Y, Katsuyama K, Sugimoto T, and Doi K. The combination of fixation using PLP fixative and embedding in paraffin by the AMeX method is useful for immunohistochemical and enzyme histochemical studies of the lung. J Toxicol Pathol. 13: 109–113 2000. [Google Scholar]
- 21.Suzuki M, Takai H, Watanabe T, Tsukamoto K, Katsuyama K, Fujii E, Yorozu K, Kimura K, Ito T, and Sugimoto T. PLP-AMeX method, fixation using PLP fixative and embedding in paraffin by the AMeX method, is useful not only for histochemistry but also in situ hybridization. J Toxicol Pathol. 17: 171–176 2004. [Google Scholar]
- 22.Yahata T, Ando K, Nakamura Y, Ueyama Y, Shimamura K, Tamaoki N, Kato S, and Hotta T. Functional human T lymphocyte development from cord blood CD34+ cells in nonobese diabetic/Shi-scid, IL-2 receptor γ null mice. J Immunol. 169: 204–209 2002. [DOI] [PubMed] [Google Scholar]
- 23.Hubbell E, Liu W-M, and Mei R. Robust estimators for expression analysis. Bioinformatics. 18: 1585–1592 2002. [DOI] [PubMed] [Google Scholar]
- 24.Wilson CL, and Miller CJ. Simpleaffy: a BioConductor package for Affymetrix Quality Control and data analysis. Bioinformatics. 21: 3683–3685 2005. [DOI] [PubMed] [Google Scholar]
- 25.Epstein JI, Allsbrook WC, Jr , Amin MB, Egevad LL. ISUP Grading Committee. The 2005 international society of urological pathology (ISUP) consensus conference on Gleason grading of prostatic carcinoma. Am J Surg Pathol. 29: 1228–1242 2005. [DOI] [PubMed] [Google Scholar]
- 26.Ribeiro-Silva A, Zhang H, and Jeffrey SS. RNA extraction from ten year old formalin-fixed paraffin-embedded breast cancer samples: a comparison of column purification and magnetic bead-based technologies. BMC Mol Biol. 8: 118–127 2007. [DOI] [PMC free article] [PubMed] [Google Scholar]


