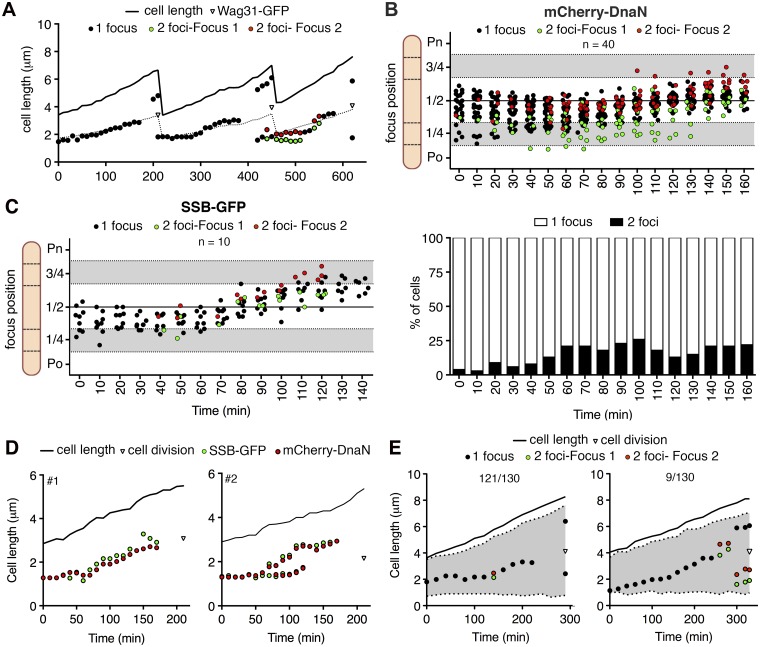
FIG 2 .
Spatiotemporal tracking of DNA replisomes in single cells. (A) Representative time traces of subcellular positions of overlapping (black circles) or split (green and red circles) mCherry-DnaN foci and Wag31-GFP foci (triangles) relative to the old cell pole. Images were recorded at 10-min intervals. Also see Fig. S2 in the supplemental material. (B) mCherry-DnaN foci during a single DNA replication cycle in 40 time-lapse series. Time zero corresponds to the first appearance of mCherry-DnaN foci. Upper panel, positions of overlapping (black circles) or split (green and red circles) mCherry-DnaN foci; lower panel, fraction of cells with one or two mCherry-DnaN foci at each time point. Po, old cell pole; Pn, new cell pole. (C) Positions of overlapping (black circles) or split (green and red circles) SSB-GFP foci during one DNA replication cycle in 10 time-lapse series. Time zero corresponds to the first appearance of SSB-GFP foci. (D) Two representative time traces of positions of mCherry-DnaN (red circles) and SSB-GFP (green circles) foci relative to the old cell pole. Images were recorded at 10-min intervals. Also see Fig. S2. (E) two representative time traces of the positions of overlapping (black circles) and split (green and red circles) mCherry-DnaN foci and nucleoid stained with SYTO green (grey-shaded area) relative to the old cell pole. Images were recorded at 20-min intervals. Data are representative of 130 time-lapse series in which 121/130 cells show pattern 1 (left panel) and 9/130 cells show pattern 2 (right panel).

