Supplemental Digital Content is Available in the Text.
Key Words: nutritional supplementation, anthropometry, body mass index, antiretroviral therapy, malnutrition
Abstract
Background:
The evidence base for effects of nutritional interventions for malnourished HIV-infected patients starting antiretroviral therapy (ART) is limited and inconclusive.
Objective:
We hypothesized that both vitamin and mineral deficiencies and poor appetite limit weight gain in malnourished patients starting ART and that vitamin and mineral supplementation would improve appetite and permit nutritional recovery.
Design:
The randomized controlled Nutritional Support for Africans Starting Antiretroviral Therapy trial was conducted in Mwanza, Tanzania, and Lusaka, Zambia. ART-naive adults referred for ART and with body mass index <18.5 kg/m2 received lipid-based nutritional supplements either without (LNS) or with added vitamins and minerals (LNS-VM), beginning before ART initiation. Participants were given 30 g/d LNS from recruitment until 2 weeks after starting ART and 250 g/d from weeks 2 to 6 of ART.
Results:
Of 1815 patients recruited, 365 (20%) died during the study and 813 (45%) provided data at 12 weeks. Controlling for baseline values, anthropometric measures were consistently higher at 12-week ART in the LNS-VM than in the LNS group but statistically significant only for calf and mid-upper arm circumferences and triceps skinfold. Appetite did not differ between groups. Using piecewise mixed-effects quadratic models including all patients and time points, the main effects of LNS-VM were seen after starting ART and were significant for weight, body mass index, and mid-upper arm circumference.
Conclusions:
Provision of high levels of vitamins and minerals to patients referred for ART, delivered with substantial macronutrients, increased nutritional recovery but did not seem to act through treatment group differences in appetite.
INTRODUCTION
The expanded access to antiretroviral therapy (ART) in Africa has brought many benefits but leaves challenges. Malnutrition is a particular concern in patients referred for ART. Malnourished patients are at high risk of dying in the early months after starting ART1,2 and failure to gain weight during this period is an additional mortality risk.3–6 The few trials of nutritional interventions to reduce these risks have shown limited benefits.7 In part, this is because many trials have been conducted in high-income countries where patients are generally less malnourished, food insecure, and less likely to be suffering environmental enteropathy8 and malabsorption than in HIV-endemic sub-Saharan Africa. Another problem has been an understandable reluctance to have a control group of malnourished patients without food supplements. A trial in Malawi compared 2 supplements, corn soy blend and a lipid nutritional supplement (LNS). The more energy-dense LNS resulted in additional early increases in body mass index (BMI), but this was not sustained and the high early mortality was not reduced.9,10 A recent trial in Ethiopia used a delayed intervention control group for patients with BMI >17 kg/m2 and found that an LNS preparation could improve lean mass gain as well as functional outcomes.11
Another reason for the disappointingly modest benefits of nutritional interventions is that anorexia is common among malnourished patients with HIV starting ART12 and weight regain cannot be expected until appetite improves. Energy intake was the major driver of weight change in HIV-infected British adults in the preantiretroviral era,13 and pediatric data indicate an association between micronutrient supplementation, appetite, and weight gain in HIV-infected South African children.14 Protocols for the management of severe malnutrition among young children start with a stabilization phase with antibiotics, vitamins, and minerals but limited calorie provision, and only aim for weight regain once appetite has returned.15 The Nutritional Support for Africans Starting Antiretroviral Therapy (NUSTART) trial was designed to mimic this 2-stage nutritional management protocol for malnourished (BMI <18.5 kg/m2) African adults starting ART, with the goals of reducing early mortality and improving nutritional recovery and functional status. Based on previous studies demonstrating benefits from both LNS and vitamin/mineral supplementation, we hypothesized that a supplement combining both these elements would be superior to LNS alone. In this analysis, we assess 12-week changes in anthropometry and appetite among participants randomized to receive LNS fortified with additional vitamins and minerals in a 2-stage protocol from referral for ART until 6 weeks after starting ART compared with those given control LNS without additional vitamins and minerals.
PARTICIPANTS AND METHODS
Design
The NUSTART study was a phase III individually randomized controlled trial comparing, in a 2-stage protocol, vitamin and mineral supplements in LNS (LNS-VM) with control LNS given from recruitment at referral for ART until 6 weeks after starting ART. The trial was registered as PACTR201106000300631.
Setting
The study was conducted from August 2011 to December 2013 at 2 sites: the National Institute for Medical Research (NIMR), Mwanza, Tanzania and the University Teaching Hospital (UTH), Lusaka, Zambia. In Mwanza, patients were screened at 6 peripheral clinics and recruitment was conducted at a research clinic in Sekou Toure Regional Hospital. In Lusaka, patients were recruited from 6 peripheral clinics, which referred to UTH. Approximate HIV prevalence among adults in Mwanza region is 6%16 and in Lusaka is 21%.17 In both countries, at the time of the study, antiretroviral drugs were provided free for those with either CD4 lymphocyte count <350 cells per microliter or WHO stage 3 or 4 disease. About a third of patients starting ART in both countries have BMI <18.5 kg/m2.3,5
Participants
Inclusion criteria were at least 18 years old, ART naive (except for standard regimens to prevent maternal-to-child HIV transmission), BMI <18.5 kg/m2, requiring ART as determined by CD4 count <350 cells per microliter or stage 3 or 4 disease, willing to undertake intensive follow-up in the study clinic, providing written (or thumbprint if unable to write) informed consent. In the presence of clinical edema, patients with BMI <20 kg/m2 were considered; BMI was remeasured after loss of edema, and the patient considered eligible if BMI was <18.5 kg/m2 and ART had not yet been initiated. Exclusion criteria were participation in a potentially conflicting research protocol, or pregnancy by self-report.
Intervention
The LNS, made for the trial by Nutriset, Malaunay, France, and based on the company's similar products for treating malnourished children, contained 60% calories as fat and 10% calories as protein and came in ready-to-eat packets. Within each treatment arm, the intervention products contained the same daily amounts of vitamins and minerals in both treatment stages. LNS-VM contained micronutrients mostly at 3 times the United Kingdom recommended nutrient intake for adult women,18 except iron at 1 recommended nutrient intake only in the second stage. Control LNS contained vehicle and flavorings similar to LNS-VM but no added vitamins or minerals (for composition of supplements see Table S1, Supplemental Digital Content, http://links.lww.com/QAI/A611). In the first stage, from recruitment to 2 weeks after starting ART, LNS or LNS-VM were given with minimal calories, that is, 30 g/d, about 150 kcal/d. From 2 to 6 weeks after initiating ART, LNS or LNS-VM were given in 250 g/d, in two 125-g sachets, about 1400 kcal/d.
Randomization and Blinding
Randomization was conducted by the Data Safety and Monitoring Board statistician using computer-generated blocks of 16 and stratified by country. Packages of LNS-VM and LNS, in both small- and large-dose formats, were labeled with the study ID numbers by the clinic pharmacists at the time packets were dispensed. Participants were recruited to sequential IDs (within sites) by clinic nurses with no access to the code.
Sample Size Justification
The original sample size of 2300 was based on the primary outcome of mortality between referral for ART and 12 weeks after starting ART, and calculated using data from Lusaka3 and Cape Town.19 However, mortality was higher (83/100 person-years) than that used for determining sample size (25/100 person-years) so, after discussion with the Data Safety and Monitoring Board, we stopped recruitment in July 2013 with a total of 1815 recruits. This number was sufficient to detect, at 5% significance, 90% power, and 25% attrition by 12 weeks due to death or loss to follow-up, differences of 0.18 of an SD in secondary continuous outcomes measured at 12 weeks.
Participant Recruitment and Follow-up
Adults attending free HIV testing services at both sites who were determined to require ART and fulfilled the study inclusion criteria were eligible for the trial. Before initiating ART, patients were screened and commenced on treatment for opportunistic infections and counseled regarding the need for lifelong drug treatment. During this pre-ART period, of modal duration 14–20 days in NUSTART, the first-stage study interventions were introduced. Medical care, including choice of ART regimen, was based on national treatment guidelines and provided primarily by local health services.
Patients were seen weekly from recruitment until ART initiation, then at 2, 4, 6, 8, and 12 weeks after starting ART. Patients who were ill could come for unscheduled visits at any time. Efforts were made to contact patients not attending scheduled visits or their families by mobile phone or home visit.
Outcomes
Weight was measured at all visits and height at recruitment. Detailed anthropometric measures—mid-upper arm, waist, hip, and calf circumferences, triceps, and subscapular skinfolds—were made at recruitment, and 2, 6, and 12 weeks after starting ART. Measurements were taken in triplicate and the median used in analyses. Arm muscle area was calculated from mid-upper arm circumference and triceps skinfold using standard methods.20 Staff conducting anthropometry were trained according to standard protocols.21 Technical errors of measurement were within acceptable limits22 for all anthropometric measures in Lusaka and for all but skinfolds in Mwanza; therefore, only Lusaka results were used for skinfold analyses.
Appetite was assessed by a 4-question questionnaire (for questionnaire, see Table S2, Supplemental Digital Content, http://links.lww.com/QAI/A611); questions were combined into a single score for each patient at each visit using polychoric correlation23 with lower scores representing lower appetite. Previous work from the cohort24 showed that appetite score was associated with weight change in Mwanza patients but was unreliable in Lusaka patients; therefore, effects of treatment on appetite score were analyzed only for Mwanza patients.
Data Management and Statistics
Data were double entered into OpenClinica data management system in Lusaka and into CSPro 4.1 and stored in MySQL databases in Mwanza. Analyses were conducted in STATA version 13.1 (Timberlake Consultants, London, UK) and SAS version 9.3 (SAS Institute Inc., Cary, NC). Analysis was by intention to treat. Anthropometric measures and appetite score (among Mwanza patients only24) 12 weeks after starting ART were analyzed as continuous variables; mean values were compared between groups using t tests and linear regression, adjusting for baseline values. Principal component analysis,25 used to describe socioeconomic status of the population, was conducted separately for each country since there were notable differences between sites; variables included in the principal component analysis were housing characteristics, sanitation, water source, and ownership of specific assets.
Results at 12 weeks could be analyzed only for patients who survived and attended the 12-week visit within our preplanned 14 days of the scheduled date; however, we also wished to investigate treatment effects using the detailed longitudinal data collected on all patients over the course of the study. We used piecewise mixed-effects quadratic regression models to allow inclusion of data from patients who died or were lost to follow-up until the point they were lost from the study. The additional flexibility of cubic models and cubic splines was assessed but fit was considered adequate with quadratic models.26 The time axis was split at the date of starting ART, allowing 2 lines with differing slopes to be fitted per person while restricting these lines to join at the date of ART initiation. For presentation, the marginal predictions after starting ART were based on the median time, 21 days, spent before starting ART; predictions pre-ART are not graphed because of the complexity of showing different lengths of time before ART.
Ethics
Ethical approval was obtained from the London School of Hygiene and Tropical Medicine, the University of Zambia Research Ethics Committee, and the Medical Research Coordinating Committee of NIMR, Tanzania. All participants provided written or thumbprint informed consent. Medical care of patients was according to national guidelines and provided through the local health services.
RESULTS
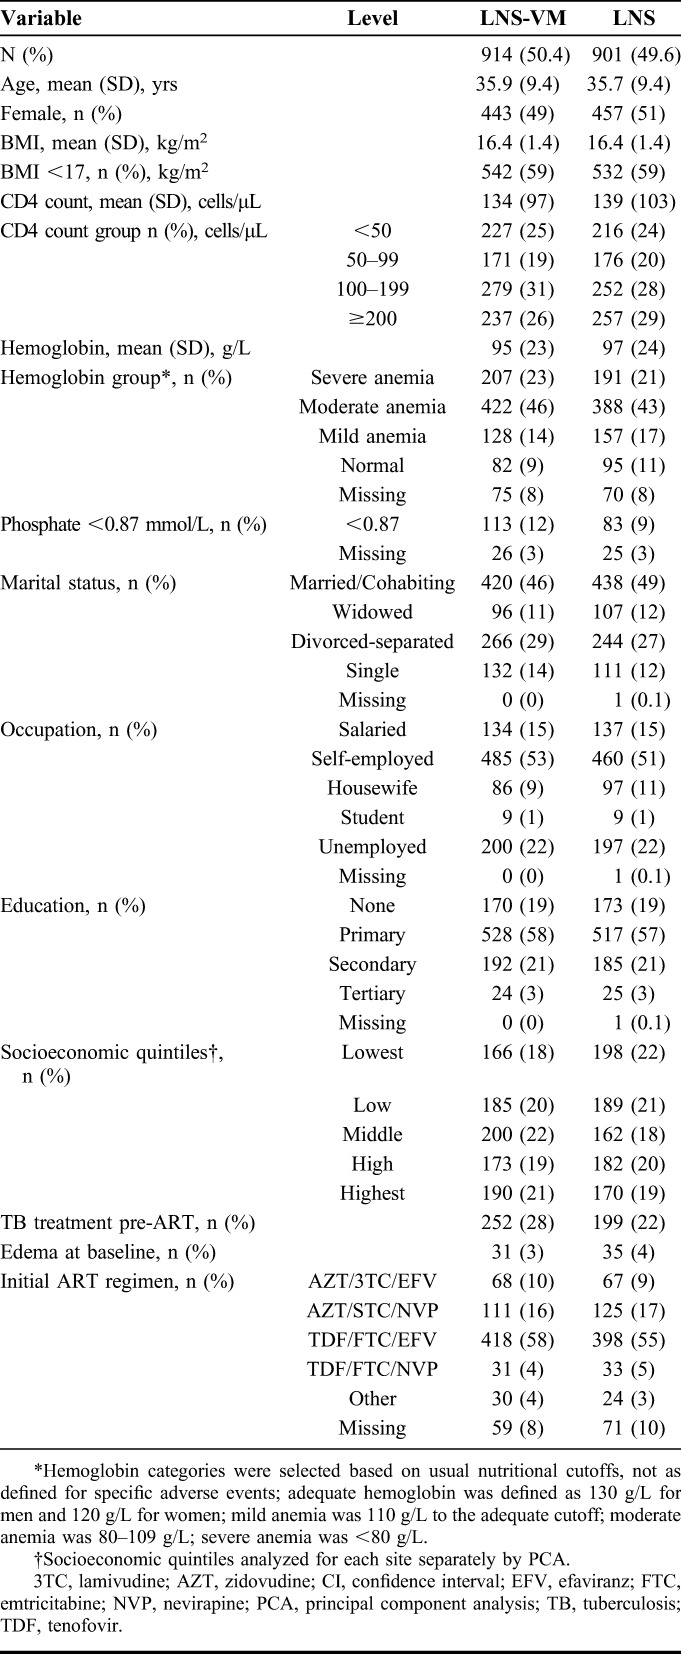
Figure 1 shows the flow of participants through the study, including numbers with results at key time points. Table 1 describes the full population at recruitment and shows balance between treatment arms. Edema was uncommon at baseline and all patients with edema had BMI <18.5 kg/m2 at recruitment. Patients who died before 12-week ART were more likely to be male, had lower values for anthropometric measures, hemoglobin, and CD4 count, poorer appetite, and were less likely to be on treatment for tuberculosis and more likely to have edema at recruitment than those providing data at 12 weeks of ART (for detailed baseline data of participants included at 12 weeks, dead by 12 weeks, and not attending the 12-week visit, see Table S3, Supplemental Digital Content, http://links.lww.com/QAI/A611). Those not known to be dead but who missed the 12-week visit were younger than those who did attend the 12-week visit, had slightly poorer nutritional status, and were more likely to be in the lowest socioeconomic quintile.
FIGURE 1.
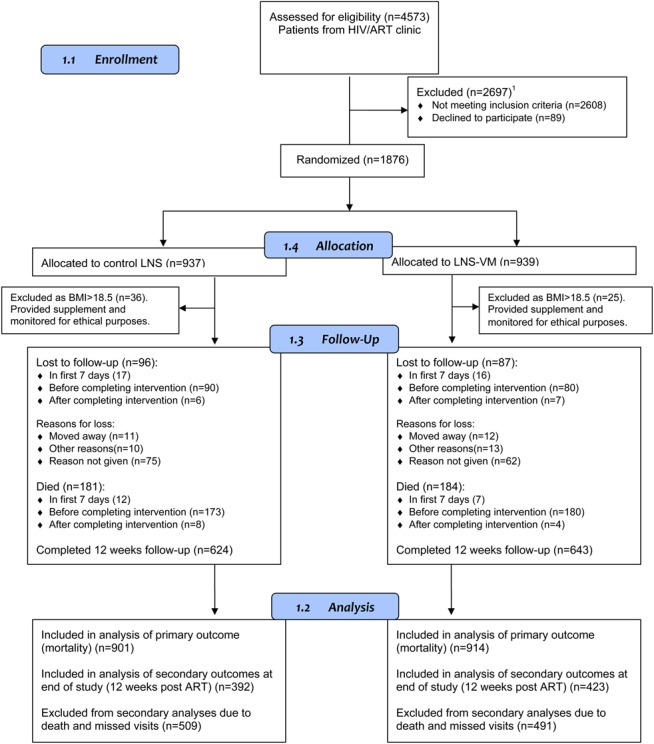
Flow of participants through the study. Screening in Mwanza was of all HIV-infected patients referred for CD4 testing, whereas in Lusaka, only patients who also had BMI <18.5 kg/m2 were formally screened; this resulted in a greater proportion of ineligible patients in Mwanza. 1Not meeting inclusion criteria (n = 2608): 5 <18 years, 17 non-ART naive, 303 BMI >18.5 kg/m2, 16 unwilling for intensive follow-up, 10 pregnant, 4 enrolled in other study, 21 refused CD4 count, 2222 not eligible for ART, and 10 unwilling to start ART.
TABLE 1.
Baseline Characteristics of the Study Population
All anthropometric measures at 12 weeks showed a tendency toward higher values in the LNS-VM group (Table 2). Controlling for baseline values, the differences were significant for mid-upper arm and calf circumferences and triceps skinfold. Appetite at 12 weeks did not differ between groups.
TABLE 2.
Effects of Treatment on Anthropometry and Appetite at 12 Weeks After Starting ART
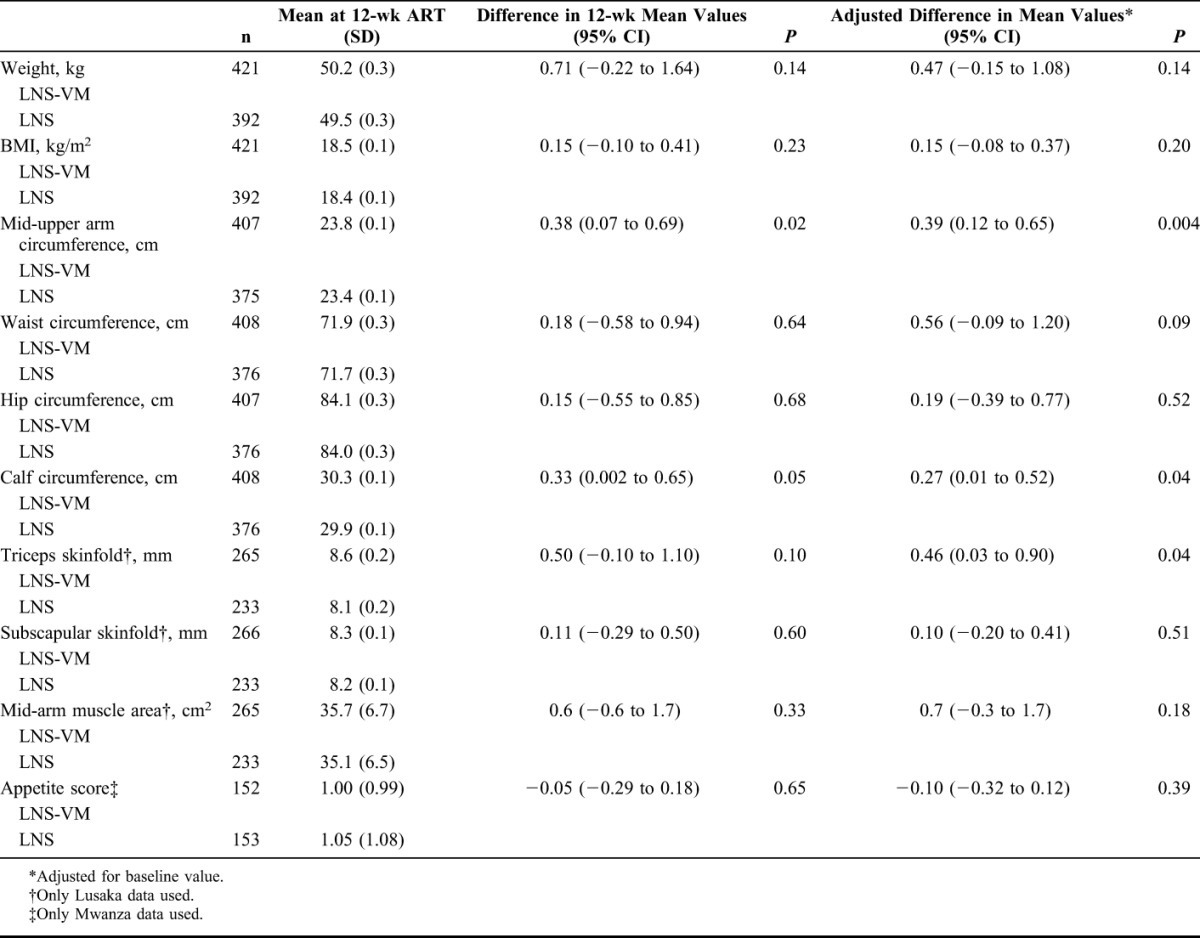
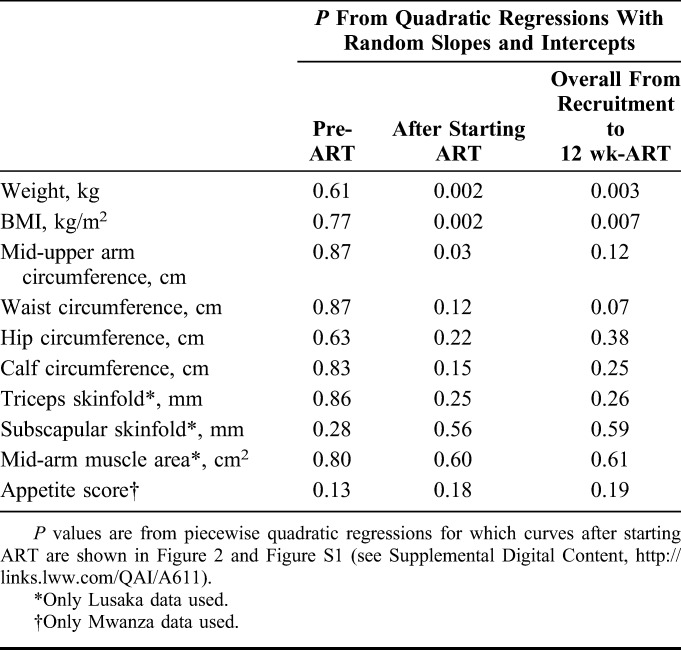
Figure 2 presents regression curves for changes in BMI and appetite score after starting ART; similar curves for other anthropometric markers are in Figure S1 (see digital content for curves of other anthropometry after starting ART; see Supplemental Digital Content, http://links.lww.com/QAI/A611). Table 3 shows the associated P values for regressions both pre-ART and during ART. There was very little change in any measure before starting ART; there were also no pre-ART differences between treatment groups (Table 3). Appetite score, in contrast, was higher at initiation of ART than at recruitment but did not differ between treatment groups. All anthropometric measures and appetite increased greatly after the start of ART. Increases tended to be greater in the LNS-VM group but differences during ART were significant for only weight, BMI, and mid-upper arm circumference. The longitudinal analyses were repeated after restricting the cohort to only those patients with 12-week data, that is, those in Table 2, to determine whether the inclusion of patients who died accounted for differences in the results, but this did not seem to be the case (data not shown).
FIGURE 2.
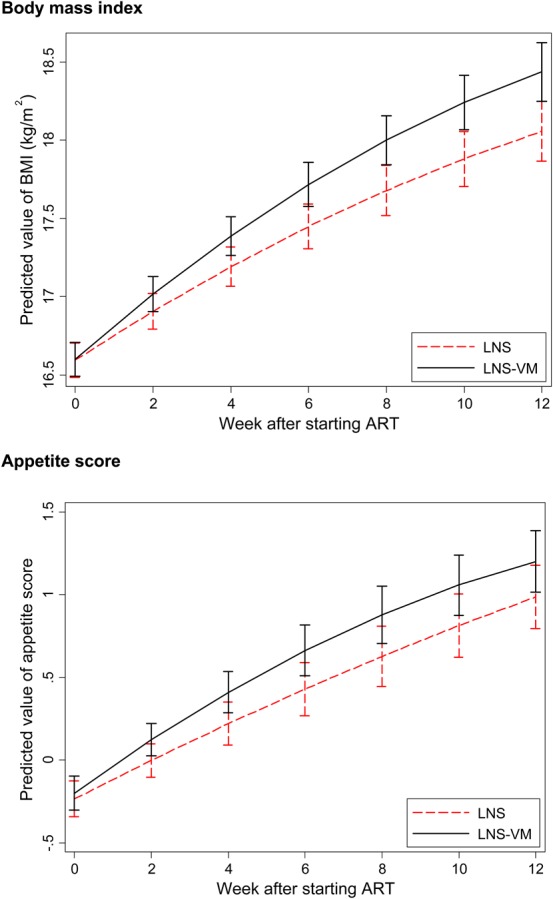
Comparisons between treatment groups of BMI and appetite score after starting ART. Curves represent predictions based on all available data for all patients and are derived from quadratic equations with random slopes and intercepts, assuming the median pre-ART period of 21 days.
TABLE 3.
P Values for Effects of Treatment on Changes in Anthropometry and Appetite
DISCUSSION
Malnutrition and failure to increase weight are established risk factors for early mortality in patients starting ART and interventions to date to decrease these risks have had limited success. The NUSTART trial randomized intervention had no effect on mortality,27 but the present results demonstrate benefits for anthropometry. All point estimates at 12-week ART were higher in the LNS-VM group, but differences were not all statistically significant, and since some were small, possibly not biologically significant. The borderline nature of the group differences likely explains why some were statistically significant in the 12-week analyses and others in the longitudinal analyses using the full cohort. There are several possible reasons for the modest treatment group differences. First, since all patients were malnourished and we considered a no supplement control would have been unethical, our control group received macronutrients as well as modest amounts of micronutrients contained within the LNS preparation. This, plus the ART and other medical care, resulted in rapid anthropometric gains in both treatment groups and may have made differences between groups difficult to detect. Significant effects on anthropometry were seen in the Ethiopian trial, which used a delayed intervention control which received no food supplement during the first 3 months of ART.11 Second, we aimed for a short intervention period, which could be potentially scaled up at reasonable cost, but it is possible that the period was not long enough for provision of vitamins and minerals with calories to make a difference to anthropometry at 12 weeks, that is, 6 weeks after ending supplementation, compared with calories alone. Third, the ongoing inflammation in the NUSTART patients, as assessed by plasma C-reactive protein 6 weeks after starting ART (PrayGod et al., submitted), may have acted as a driver of tissue catabolism, rather than of deposition, through much of the NUSTART trial period.
Comparisons at 12 weeks after starting ART would miss changes earlier in the study, so the longitudinal analyses were conducted to capture these. It is interesting that both increases in anthropometric outcomes and differences between treatment groups were minimal before ART but larger after starting ART and after starting the higher calorie supplement at 2 weeks of ART. It is difficult from the NUSTART study design to distinguish effects due to providing ART and providing higher calories. We noted previously that starting ART dampened increases in appetite among the patients for a period of several weeks24; nevertheless, appetite seemed sufficient to lead to increases in anthropometry from the start of ART.
A central concept in the design of the NUSTART trial preparations was that the micronutrients and electrolytes would improve lean tissue deposition.28 The results show all anthropometric measures increasing in both groups but slightly more in the LNS-VM group. Anthropometry measures both fat and lean and our only measure related specifically to lean tissue, arm muscle area, did not differ between treatment groups; however, more sophisticated body composition data are needed to determine whether there is preferential fat or lean deposition. Our appetite results are limited by having valid data from only 1 site and perhaps by being insufficiently sensitive; nevertheless, if it really is true that additional vitamins and minerals can increase body mass in various compartments without an overall difference between groups in appetite or intake, this implies an increase in efficiency of anabolic processes. Increased efficiency is exactly what would be expected if availability of coenzymes and cofactors were rate limiting in tissue accretion during nutritional rehabilitation. This intriguing possibility requires further work as it is of the greatest importance in understanding how best to deliver nutritional therapy.
The study had several limitations, which together decreased statistical power. Trial recruitment was stopped earlier than originally planned, based on requirements for the primary outcome of mortality. Furthermore, a large proportion of recruits did not attend the final visit due to either death or loss to follow-up. However, we still had power to detect differences in anthropometric measures of about 0.2 of an SD score, which is about the limit of biologically relevant differences. Because of technical problems, we could not use the skinfold data from Mwanza; however, we could still detect a significant effect of treatment on triceps skinfold thickness in Lusaka patients at 12 weeks.
In conclusion, the NUSTART intervention improved nutritional outcomes in both groups of malnourished patients starting ART; high levels of vitamins and minerals had additional benefits. Together with the results from Malawi10 and Ethiopia,11 the NUSTART trial supports use of LNS for these patients.
Supplementary Material
ACKNOWLEDGMENTS
The authors are grateful to the European and Developing Countries Clinical Trials Partnership for funding the study, and to Nutriset, Malaunay, France for preparing the trial intervention supplements. They thank the Data Safety and Monitoring Board—Nicholas Paton (chair), Kathy Baisley (statistician), Muhammad Bakari (Tanzanian representative), and Sekelani Banda (Zambian representative)—for their support and advice, and the on-site monitors, Jim Todd and Max Katubulushi, for their assistance. They thank Professor Mike Kenward, LSHTM, for his advice and support regarding statistical analyses. The work was conducted by the NUSTART study team, which includes Principal investigator: Suzanne Filteau; Senior investigators: Aase Bengaard Andersen, John Changalucha, Henrik Friis, Douglas C. Heimburger, Lackson Kasonka, and Paul Kelly; Statisticians and other senior research fellows: John R. Koethe, Daniela Manno, Natasha Larke, Andrea M. Rehman, and Susannah Woodd; Steering group: David Thurnham and Andrew Tomkins; Mwanza trial manager: George PrayGod; Lusaka trial managers: Molly Chisenga and Joshua Siame; Mwanza senior clinic team: Jeremiah Kidola, Denna Michael, Kelvin Musa, Charles Masilingi, Elizabeth Fue, Eva Masesa, and Neema Mpandachalo; Lusaka senior clinic team: Anne Kanunga, Likando Munalula, Brenda Kapinda, and Nellie Sikanyika; Laboratory technicians: Julius Mngara, George Ogweno, Piu Ikigo, Mutinta Muchimba, Memory Samwinga, Ellen Besa, Leo Beacroft, Harry Black, and Celeste Gregg Smith; Postgraduate students: Caroline Chisenga, Marlene Hebie, Derek Munkombwe, and Gemma Sampson; Administrators and data managers: Yolanda Fernandez, Gunda Wandore, Aswile Jonas, Hildah Banda Mabuda, and Wakwoya Adugna; Pharmacists: Stephen Makandilo, Mwangana Mubita, and Jessy Mulenga. They are grateful also to nurses, data entry clerks, drivers, and other support staff at both NUSTART sites.
Footnotes
Supported by the European and Developing Countries Clinical Trials Partnership Grant IP.2009.33011.004. Nutriset (Malaunay, France) supplied the intervention products.
Preliminary versions of the work described were presented at the Seventh EDCTP Forum, July 1, 2014, Berlin, Germany, and the African Nutrition Epidemiology Conference, July 21, 2014, Accra, Ghana.
The authors have no conflicts of interest to disclose.
Supplemental digital content is available for this article. Direct URL citations appear in the printed text and are provided in the HTML and PDF versions of this article on the journal's Web site (www.jaids.com).
Trial registration: PACTR201106000300631 on Pan-African Clinical Trials Registry http://www.pactr.org/.
REFERENCES
- 1.Lawn SD, Harries AD, Anglaret X, et al. Early mortality among adults accessing antiretroviral treatment programmes in sub-Saharan Africa. AIDS. 2008;22:1897–1908. [DOI] [PMC free article] [PubMed] [Google Scholar]
- 2.Gupta A, Nadkarni G, Yang WT, et al. Early mortality in adults initiating antiretroviral therapy (ART) in low- and middle-income countries (LMIC): a systematic review and meta-analysis. PLoS One. 2011;6:e28691. [DOI] [PMC free article] [PubMed] [Google Scholar]
- 3.Koethe JR, Lukusa A, Giganti MJ, et al. Association between weight gain and clinical outcomes among malnourished adults initiating antiretroviral therapy in Lusaka, Zambia. J Acquir Immune Defic Syndr. 2010;53:507–513. [DOI] [PMC free article] [PubMed] [Google Scholar]
- 4.Madec Y, Szumilin E, Genevier C, et al. Weight gain at 3 months of antiretroviral therapy is strongly associated with survival: evidence from two developing countries. AIDS. 2009;23:853–861. [DOI] [PubMed] [Google Scholar]
- 5.Liu E, Spiegelman D, Semu H, et al. Nutritional status and mortality among HIV-infected patients receiving antiretroviral therapy in Tanzania. J Infect Dis. 2011;204:282–290. [DOI] [PubMed] [Google Scholar]
- 6.Sudfeld CR, Isanaka S, Mugusi FM, et al. Weight change at 1 mo of antiretroviral therapy and its association with subsequent mortality, morbidity, and CD4 T cell reconstitution in a Tanzanian HIV-infected adult cohort. Am J Clin Nutr. 2013;97:1278–1287. [DOI] [PMC free article] [PubMed] [Google Scholar]
- 7.Grobler L, Siegfried N, Visser ME, et al. Nutritional interventions for reducing morbidity and mortality in people with HIV. Cochrane Database Syst Rev. 2013;2:CD004536. [DOI] [PubMed] [Google Scholar]
- 8.Kelly P, Davies SE, Mandanda B, et al. Enteropathy in Zambians with HIV related diarrhoea: regression modelling of potential determinants of mucosal damage. Gut. 1997;41:811–816. [DOI] [PMC free article] [PubMed] [Google Scholar]
- 9.Ndekha M, van Oosterhout JJ, Saloojee H, et al. Nutritional status of Malawian adults on antiretroviral therapy 1 year after supplementary feeding in the first 3 months of therapy. Trop Med Int Health. 2009;14:1059–1063. [DOI] [PubMed] [Google Scholar]
- 10.Ndekha MJ, van Oosterhout JJ, Zijlstra EE, et al. Supplementary feeding with either ready-to-use fortified spread or corn-soy blend in wasted adults starting antiretroviral therapy in Malawi: randomised, investigator blinded, controlled trial. BMJ. 2009;338:b1867. [DOI] [PMC free article] [PubMed] [Google Scholar]
- 11.Olsen MFAA, Kæstel P, Tesfaye M, et al. Effects of nutritional supplementation for HIV patients starting antiretroviral treatment: randomised controlled trial in Ethiopia. BMJ. 2014;348:g3187. [DOI] [PMC free article] [PubMed] [Google Scholar]
- 12.Koethe JR, Blevins M, Bosire C, et al. Self-reported dietary intake and appetite predict early treatment outcome among low-BMI adults initiating HIV treatment in sub-Saharan Africa. Public Health Nutr. 2013;16:549–558. [DOI] [PMC free article] [PubMed] [Google Scholar]
- 13.Macallan DC, Noble C, Baldwin C, et al. Energy expenditure and wasting in human immunodeficiency virus infection. N Engl J Med. 1995;333:83–88. [DOI] [PubMed] [Google Scholar]
- 14.Mda S, van Raaij JM, Macintyre UE, et al. Improved appetite after multi-micronutrient supplementation for six months in HIV-infected South African children. Appetite. 2010;54:150–155. [DOI] [PubMed] [Google Scholar]
- 15.Ashworth A, Khanum S, Jackson A, et al. Guidelines for the inpatient treatment of severely malnourished children. 2003. Available at: http://www.who.int/nutrition/publications/severemalnutrition/9241546093/en/index.html. Accessed October 1, 2010.
- 16.Marston M, Michael D, Wringe A, et al. The impact of antiretroviral therapy on adult mortality in rural Tanzania. Trop Med Int Health. 2012;17:e58–e65. [DOI] [PMC free article] [PubMed] [Google Scholar]
- 17.Zambian Central Statistical Office, Tropical Diseases Research Centre, University of Zambia, Macro International Inc. Zambia Demographic and Health Survey 2007. Calveton, MD: CSO and Macro International Inc; 2009: Available at: http://www.measuredhs.com/pubs/pub_details.cfm?id=894. Accessed October 1, 2010. [Google Scholar]
- 18.UK Department of Health. Dietary Reference Values for Food Energy and Nutrients for the UK. London, United Kingdom: Department of Health; 1991. [Google Scholar]
- 19.Lawn SD, Little F, Bekker LG, et al. Changing mortality risk associated with CD4 cell response to antiretroviral therapy in South Africa. AIDS. 2009;23:335–342. [DOI] [PMC free article] [PubMed] [Google Scholar]
- 20.Gibson RS. Principles of Nutritional Assessment. 2nd ed Oxford, United Kingdom: Oxford University Press; 2005. [Google Scholar]
- 21.Lohman T, Roche A, Martorell R. Anthropometric Standardization Reference Manual. Champaign, IL: Human Kinetics Publications; 1988. [Google Scholar]
- 22.Ulijaszek S, Kerr D. Anthropometric measurement error and the assessment of nutritional status. Br J Nutr. 1999;82:165–177. [DOI] [PubMed] [Google Scholar]
- 23.Kolenikov SAG. The Use of discrete data in PCA: Theory, simulations, and application to socioeconomic Indices. In: Manly BFJ, ed. Multivariate Statistical Methods: A Primer, Third Edition 2004. Boca Raton, FL: CRC Press; 2004. [Google Scholar]
- 24.Rehman AMWS, Chisenga M, Siame J, et al. Appetite testing in HIV-infected African adults recovering from malnutrition and given antiretroviral therapy. Pub Health Nutr. [published online ahead of print May 1, 2014]. doi: 10.1017/S1368980014000718. [DOI] [PMC free article] [PubMed] [Google Scholar]
- 25.Filmer D, Pritchett L. Estimating wealth effects without expenditure data—or tears: an application to educational enrolments in states of India. Demography. 2001;38:115–132. [DOI] [PubMed] [Google Scholar]
- 26.Harrell FE., Jr Regression Modeling Strategies: With Applications to Linear Models, Logistic Regression, and Survival Analysis. New York, NY: Springer; 2001. [Google Scholar]
- 27.Filteau S, PrayGod G, Kasonk L, et al. Effects on mortality of a nutritional intervention for malnourished HIV-infected adults referred for antiretroviral therapy: a randomised controlled trial. BMC Medicine. 2015;13:17. [DOI] [PMC free article] [PubMed] [Google Scholar]
- 28.Golden M. Proposed nutrient requirements of moderately malnourished populations of children. Food Nutr Bull. 2009;30:S267–S342. [DOI] [PubMed] [Google Scholar]
Associated Data
This section collects any data citations, data availability statements, or supplementary materials included in this article.


