Abstract
As United States Food and Drug Administration-approved implantable material, carbon fiber-reinforced polyetheretherketone (CFRPEEK) possesses an adjustable elastic modulus similar to cortical bone and is a prime candidate to replace surgical metallic implants. The bioinertness and inferior osteogenic properties of CFRPEEK, however, limit its clinical application as orthopedic/dental implants. In this study, CFRPEEK–nanohydroxyapatite ternary composites (PEEK/n-HA/CF) with variable surface roughness have been successfully fabricated. The effect of surface roughness on their in vitro cellular responses of osteoblast-like MG-63 cells (attachment, proliferation, apoptosis, and differentiation) and in vivo osseointegration is evaluated. The results show that the hydrophilicity and the amount of Ca ions on the surface are significantly improved as the surface roughness of composite increases. In cell culture tests, the results reveal that the cell proliferation rate and the extent of osteogenic differentiation of cells are a function of the size of surface roughness. The composite with moderate surface roughness significantly increases cell attachment/proliferation and promotes the production of alkaline phosphatase (ALP) activity and calcium nodule formation compared with the other groups. More importantly, the PEEK/n-HA/CF implant with appropriate surface roughness exhibits remarkably enhanced bioactivity and osseointegration in vivo in the animal experiment. These findings will provide critical guidance for the design of CFRPEEK-based implants with optimal roughness to regulate cellular behaviors, and to enhance biocompability and osseointegration. Meanwhile, the PEEK/n-HA/CF ternary composite with optimal surface roughness might hold great potential as bioactive biomaterial for bone grafting and tissue engineering applications.
Keywords: polyetheretherketone, tenary, biocomposite, bioactivity, bone formation
Introduction
Bone loss related to osteoporosis, trauma, cancer, and congenital abnormalities continues to be a serious fast-growing problem worldwide, and the annually associated orthopedic cost is tens of billions of dollars with a significant increase estimated for the coming decades.1,2 When bone loss is too severe to be regenerated by the routine mechanism of the human body, treatments with autologous grafts or artificial implants are considered. However, procurement morbidity and constraints on available quantities hinder autografts as an option for bone repair.3 The most popular orthopedic/dental materials are metals, such as titanium (Ti) and its alloys, due to their excellent corrosion resistance, high mechanical strength, as well as cytocompatibility.4,5 However, there are concerns regarding the release of harmful metal ions and the radiopacity of metal alloys in vivo.6 Moreover, the elastic moduli (over 100 GPa) of metal alloys mismatch the mechanical properties between metals and human bones resulting in bone resorption.6,7 Carbon fiber (CF)-reinforced polyetheretherketone (CFRPEEK) is becoming a primary candidate to replace metallic implants. CFRPEEK composite has an adjustable elastic modulus close to that of cortical bone (about 18–25 GPa), which can mitigate concerns over the risks of osteanabrosis and bone resorption caused by stress shielding.8,9 Besides its excellent mechanical properties, CFRPEEK inherits the nontoxicity, good chemical resistance, natural radiolucency, and even magnetic resonance imaging compatibility from PEEK.8,10,11 However, although the materials have attracted much attention as orthopedic/dental implants since the 1980s, the bioinertness of CFRPEEK impedes osseointegration after implantation, thereby severely hampering clinical adoption.8,9,12
The integration of implants with the surrounding bone, a process termed osseointegration, is critical for successful bone regeneration and healing in dental and orthopedic applications. Currently, various modification approaches including physical blending (ie, impregnating bioactive materials into polyetheretherketone [PEEK] substrate) and surface modification (such as physical treatment, chemical treatment, and surface coating), have been employed to enhance the bioactivity and osseointegration of PEEK implants.13 Significantly improved biological properties have been attained in PEEK-based TiO2,14 ZrO2,15 and hydroxyapatite (HA)16–18 binary composites. These reinforcements, however, usually impair the mechanical properties of PEEK,16,19 thus resulting in some adverse effects on adjacent tissues, and limiting their applications in clinic. Recent efforts in this field have highlighted the importance of a ternary composite in compensating for the shortcomings originated from the conventional binary composite and promoting the advanced mechanical property and biocompatibility of the composite to better mimic the constituents and structure of natural bone.
Surface topographical modification is another straightforward and important approach to improve the biological performance of dental/orthopedic implants through mimicking the hierarchical structure of bone.20–22 However, the precise impact of the extent of surface roughness on the cell functions and interplays between a CFRPEEK-based implant and the adjoining bone tissue has not been clearly investigated. We believe that moderate surface roughness can enhance the biological properties of a CFRPEEK-based biocomposite implant, and that oversize or undersize in roughness could not contribute to promote biocompability, although based on the literature evidence, a rough microtopography can promote ingrowth of soft and hard tissue into the materials.23,24 Despite the attractive advantages and progress in the preparation of novel CFRPEEK-based composites/implants, the employment of nano-HA as bioreinforcement in CFRPEEK-based ternary composites conferring CFRPEEK with superb bioactive performance and osseointegration for load-bearing orthopedic/dental applications, to our knowledge, has not been reported. Hence, in the present study, CFRPEEK–nanohydroxyapatite (PEEK/n-HA/CF) ternary biocomposites with variable roughness are achieved through melt–blending and surface roughening. We systematically evaluated the biofunctionalities of the prepared microroughened PEEK/n-HA/CF biocomposite in vitro and in vivo, in terms of their cellular viability, differentiation capacity, and tissue responses. We intriguingly find the PEEK/n-HA/CF with an appropriate surface roughness strongly boosts cytocompatibility and osteogenesis in vitro, as well as promotes osseointegration in vivo in the beagle model experiment, which could be a promising candidate for dental implant and bone graft substitutes. Our work highlights the importance of the extent of surface roughness as a key factor to enhance the osseointegration of implants.
Materials and methods
Synthesis of nano-hydroxyapatite (n-HA)
n-HA was synthesized from Ca(NO3)2·4H2O and (NH4)2HPO4 using a chemical precipitation method. The two reagents were dissolved in deionized (DI) water separately according to a Ca/P molar ratio of 1.67/1, and the pH of each solution was adjusted to 10 by adding ammonia. Then, Ca(NO3)2 solution was dropped into (NH4)2HPO4 solution with continuous stirring. Crystal growth occurred when kept at 60°C for 8 hours, and the pH value of the supernatant was maintained in the range of 10–10.5 using ammonia. After reaction, HA slurry was kept at room temperature for 24 hours, and the precipitate was obtained after washing with DI water and ethanol. Finally, HA precipitation was treated hydrothermally at 140°C under 0.3 MPa for 20 hours in an autoclave. After hydrothermal treatment, the n-HA particles were rinsed with DI water and dried in an oven at 60°C for 12 hours.
Preparation of PEEK/n-HA/CF ternary composite
Medical graded PEEK (PEEK powders; 450G) with a density about 1.30 g/cm3 was purchased from Victrex plc (Thornton Cleveleys, UK). Commercially-available CF, T700SC yarns of 12,000 filament count (Toray Industries, Inc., Tokyo, Japan) spun from the polyacrylonitrile fibers, were used for this study. Based on our previously established protocol, the PEEK/n-HA/CF ternary composite was fabricated via a compounding and injection–molding process. In brief, 25 wt% n-HA powder, 20 wt% CF, and 55% PEEK powder were dispersed in alcohol using a ball grinder (KQM-D; Xianyang Jin Hong General Machinery Co. Ltd, Xianyang, People’s Republic of China) to obtain a homogeneous mixture. After it was well dispersed, the mixture was dried in a forced convection oven at 90°C for 24 hours to remove the excess alcohol. The ternary composites were produced at an injection temperature of 380°C using an injection–molding machine (BA-300/050CD; Battenfeld, Extrusionstechnik GmbH, Awans, Belgium). The resulting composite was injected into two specially designed molds – ie, disks (Φ=15×2 mm3) for physical and chemical characterization and in vitro testing, and cylindrical implants (4.0 mm diameter and 7.0 mm length) for in vivo measurement (Figure 1). Samples of the composite were polished with a series of increasing SiC abrasive papers (400, 1,000, 1,500, 2,000 grit). Then, they were cleaned ultrasonically for 30 minutes in baths of acetone, anhydrous ethanol, and DI water, respectively, and dried at 50°C overnight.
Figure 1.
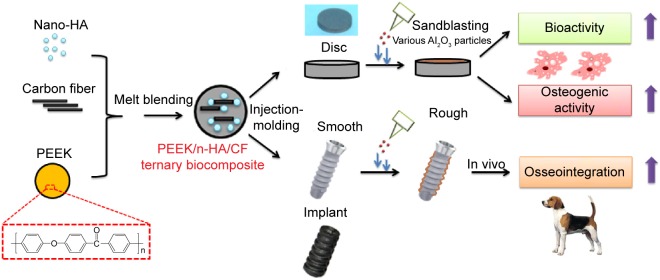
Schematic diagram of the preparation and biological evaluation of the PEEK/n-HA/CF ternary biocomposite.
Abbreviations: HA, hydroxyapatite; PEEK, polyetheretherketone; PEEK/n-HA/CF, carbon fiber-reinforced polyetheretherketone–nanohydroxyapatite.
Surface sandblasting treatment
In order to superimpose the increasing microstructures on the composite surface, samples were processed in an Empire Suction Blasting Cabinet (Tianjin Jing-Gong Medical Equipment & Technology Co. Ltd, Tianjin, People’s Republic of China) by the blasting media flow with increasing grain sizes of Al2O3 particles at a distance of approximately 50 mm for a duration of 60 seconds. Then, all samples were cleaned with DI water using an ultrasonic cleaner to remove any potential free Al2O3 nanoparticles.
Surface characterization
Fourier-transform infrared spectrometry (Nicolet™ Magna-IR 750; Thermo Fisher Scientific, Waltham, MA, USA) was used to identify the functional groups of the PEEK/n-HA/CF ternary composite. The spectra were recorded from 650–4,000 cm−1.
The crystalline phases of the prepared composite were examined and compared by X-ray diffraction (XRD) (Shimadzu Corporation, Kyoto, Japan) using a Cu target as radiation source (λ=1.540598 Å) at 40 kV. The diffraction angles (2θ) were set between 5° and 60° increments, with a step size of 4° minute−1. The identification of phases was achieved by comparing the obtained sample diffraction pattern with standard cards in the International Centre for Diffraction Database and the Joint Committee on Powder Diffraction Standards (ICDD-JCPDS) database.
The surface morphology of microroughened PEEK/n-HA/CF composites was characterized by a field emission scanning electron microscope (FE-SEM) (JSM-6701F; Jeol Ltd., Tokyo, Japan). All samples were coated with gold for 1 minute before FE-SEM observation. Energy-dispersive X-ray spectroscopy was also recorded using the same equipment.
The surface roughness of composites before and after sandblasting was recorded by a mechanical profilomoter (Dektak-8 stylus profiler; Veeco Instruments, Inc., Plainview, NY, USA). Six samples in each stage were measured to provide an average and standard deviation.
Relative atomic concentration information was obtained from X-ray photoelectron spectroscopy (XPS) (AXIS Ultra; Kratos Analytical, Ltd., Manchester, UK). The binding energies were calibrated by the C 1s hydrocarbon peak at about 285 eV. Two samples of every specimen type were scanned three times each and all values were averaged.
Static contact angles on microroughened PEEK/n-HA/CF composite surfaces were measured at room temperature by the sessile drop method using 2 μL of DI water droplets in a contact angle-measuring device (SL200B; Kino Industry, New York, NY, USA). Six samples in each stage were used to provide an average and standard deviation.
Mechanical properties tests
The mechanical properties (including the elastic modulus and ultimate tensile strength [UTS]) of the ternary composites measured using a materials testing machine (Instron 5969; Instron, Norwood, MA, USA) at a crosshead speed of 0.1 mm/minute per American Society for Testing and Materials (ASTM) D790. For each group, five duplicate specimens were tested. The hardness of the PEEK/n-HA/CF composites was determined by a digital Vickers microhardness tester (HMV-2T; Shimadzu Corporation) with a 1.961 N load and 15-second dwell time. Six points were chosen and measured in different positions of each sample to get an average value. The pure PEEK and Ti samples used as control groups were measured using the same method.
Protein adsorption assay
Bovine serum albumin (BSA) (Baosai Biotechnology Co., Ltd., Beijing, People’s Republic of China) was used as a standardized model protein. One hundred microliters of protein solution (0.2 mg/mL) was pipetted onto the surfaces of the experimental substrates with saline as blank. After incubation for 2, 4, 8, 12, and 24 hours at 37°C, nonadherent proteins were removed and mixed with microbicinchoninic acid at 37°C for 30 minutes. The amount of the removed albumin, as well as the total amount of albumin, was quantified using a microplate reader at 570 nm. The rate of albumin adsorption was calculated as the percentage of albumin adsorbed to different PEEK/n-HA/CF surfaces relative to the total amount.
Cell culture
Human osteoblast-like MG-63 cells (American Type Culture Collection, Manassas, VA, USA) were cultured in Dulbecco’s Modified Eagle’s Medium (DMEM) (Gibco®; Thermo Fisher Scientific) containing 10% fetal calf serum (Gibco®; Thermo Fisher Scientific), 100 μg/mL of streptomycin, and 100 U/mL of penicillin (Amresco LLC, Solon, OH, USA) at 37°C in a humidified atmosphere of 5% CO2. The culture media was changed at 2-day intervals.
Cell attachment and proliferation assay
Prior to in vitro testing, all samples were disinfected using gamma radiation at a total dose of 25 KGγ. Cell attachment and proliferation of MG-63 cells were assessed using the cell proliferation reagent WST-1 (Hoffman-La Roche Ltd., Basel, Switzerland). After cell counting, cells were seeded onto the studied specimens held by 24-well tissue culture plates (Costar®; Corning Incorporated, Corning, NY, USA) at a density of 1×10⁵ cells/well (six replicates) with DMEM serving as negative control. After incubating for 4 hours, 3 days, 7 days, and 14 days, respectively, the culture media were removed and the specimen were rinsed with phosphate buffered saline (PBS) buffered three times in order to remove the unattached cells. Cell viability was measured by adding 1 mL/well of culture medium containing 100 μL of WST-1 for 4 hours’ incubation. Then, 100 μL of supernatant from each well was transferred to new 96-well cell culture plates. the optical density value of the supernatant was measured with a microplate reader (Model 680; Bio-Rad Laboratories Inc., Hercules, CA, USA) at 450 nm with the reference wavelength at 630 nm.
Cell morphology and spreading
The cell morphology and spreading on the samples were observed via confocal laser scanning microscopy (CLSM). Cells cultured on various microrough surfaces at 3 days were fixed with 4% (w/v) paraformaldehyde for 15 minutes at ambient temperature. The samples were then washed with PBS and permeabilized with 0.1% (v/v) Triton™ X-100 (Sigma-Aldrich Co., St Louis, MO, USA) for 5 minutes, followed by incubation in 1% BSA/PBS at 37°C for 30 minutes to block nonspecific binding. Then, 5 μg/mL of rhodamine–phalloidin (Molecular Probes®; Thermo Fisher Scientific) was added to stain MG-63 cells for 30 minutes. The filamentous actions of the cell cytoskeleton were visualized by a CLSM (Carl Zeiss Meditec AG, Jena, Germany). Moreover, the number of adherent cells was determined by counting the number of nuclei at the projected area (magnification 100×), and stained images were obtained from five different areas per sample (number [n]=3).
The cellular morphologies at 14 days for the control group (polished with 2000-grit paper) and group 2 (treated by 110–150 μm A1203) were evaluated by FE-SEM after Au sputtering. Basically, after 14 days of incubation, the samples with cells were rinsed in PBS buffer and were fixed with 2.5% (v/v) glutaraldehyde solution for 30 minutes, followed by dehydration with graded ethanol solutions (15 minutes for each concentration) and dried for scanning electron microscope (SEM) observation.
Apoptosis analysis
Cell apoptosis was analyzed by flow cytometry using an Annexin V–fluorescein isothiocyanate (FITC) apoptosis detection kit (Beyotime Biotechnology, Shanghai, People’s Republic of China). MG-63 cells were cultured in 24-well plates at 5×10⁴ cells/mL for 7 days. Then, cells were digested with 0.05% pancreatic enzyme for 3 minutes. The digested cells were washed with the collected culture medium, and then suspended in PBS buffer. Cells were stained with the apoptosis detection kit per the manufacturer’s instructions. Briefly, the cells from each sample were suspended in 195 μL Annexin V-FITC binding buffer, and 5 μL of Annexin V-FITC. The cells were incubated at room temperature for 10 minutes. Each sample was then centrifuged at 1,200 g for 4 minutes, resuspended in 190 μL binding buffer, and 10 mL of propidium iodide working solution was added. Then, the samples were analyzed by a FACSCalibur™ (BD, Franklin Lakes, NJ, USA) flow cytometry with at least 10,000 events recorded for each condition.
Alkaline phosphate activity (ALP) assay
After 7 and 14 days of culture with different microroughened PEEK/n-HA/CF composites, the ALP activity of MG-63 cells was quantificational measured using an assay reagent kit (Nanjing Jiancheng Bioengineering Institute, Jiangsu, People’s Republic of China). Briefly, the supernatant was removed and 100 μL of lysis solution (1% TritonX-100) was added into each well and incubated for 1 hour. Afterwards, 30 μL of MG-63 cell lysates at each well were transferred to new 96-well cell culture plates and cultivated with 50 μL of carbonated buffer solution (pH 10) and 50 μL of substrate solution (4-amino-antipyrine) at 37°C for 15 minutes. Then, 150 μL of potassium ferricyanide was added into the solution, and the production of p-nitrophenol, the end product of hydrolyzed para-nitrophenyl phosphate, was determined by the absorbance at 405 nm. For normalization, the total protein concentration was measured by a bicinchoninic acid protein assay kit (Beijing Biosea Biotechnology Co., Ltd., Beijing, People’s Republic of China). Thus, ALP was normalized and expressed as the total protein content (U/mg protein).
Alizarin red staining
Mineralized nodule formation was determined after 14 days of culture following the manufacturer’s instructions by staining with Alizarin red staining (ARS) solution (2%; Sigma-Aldrich Co.). At desired time points, cell layers were fixed with 4% paraformaldehyde for 30 minutes at 4°C and then washed three times with PBS. Fixed cells were further flushed with distillated water in order to remove any salt residues, and then a solution of 2% (wt/v) ARS with a pH adjusted to 4.5 was added to cover the entire surface of the wells. After an incubation period of 30 minutes, the excess ARS was washed with DI water. The newly-formed bone-like nodules on the materials were stained dark red in color. Samples without cells were also analyzed using the method mentioned previously, and by avoiding the interference of calcium originally in the materials. To quantify the mineralized nodules after ARS, images were captured in six different regions for each specimen, which covered most areas of the well.
Animal and implant surgery
Surgical implantation was performed on three male beagle dogs aged 1.5 years and weighing 11.4±2.1 kg for an observation period of 8 weeks after surgery. The in vivo study was conducted according to the ethical principles of Peking University Institutional Animal Care and Use Committee (protocol 225/02). The threaded implants with a cylindrical bar shape of 7 mm in length and 4 mm in diameter were used in the present study after Al2O3 blasting, and the implants were sterilized prior to surgery for in vitro testing. The animals were anesthetized using an intravenous injection of 1% pentobarbital 80 mg/kg. The third and fourth premolars of the dogs were bilaterally extracted in the mandibles, and implants were inserted immediately. The antagonistic teeth of the upper jaw were not removed and all implants were covered with the mucoperiosteal flaps to allow for submerged healing. The order of implantation was predetermined by block randomization. After surgery, three fluorochromes (Sigma-Aldrich Co.) – ie, calcein (100 mg/kg) and tetracycline (100 mg/kg) – were administered to assess the osteogenic activity at 2 weeks and 4 weeks, respectively. Meanwhile, after surgery, the animals were maintained in their normal cages without any limitation and sacrificed at 8 weeks with an intravenous injection of 10% kalium chloratum (0.5 mL/kg).
Radiographic examination and SRμCT imaging
The harvested bone specimens were examined by an X-ray machine (Faxitron® MX-20; Faxitron Bioptics, LLC, Tucson, AZ, USA) at 30 kV. In an attempt to investigate the integration of implants on bone defect repair, synchrotron–radiation-based computer microtomography (SRμCT) measurements were performed at beamline BL13W of the Shanghai Synchrotron Radiation Facility (Shanghai, People’s Republic of China) using an amonochromatic beam with an energy of 30 keV and a sample-to-detector distance of 1.6 m. Amira software (Pro Medicus Limited, Richmond, Victoria, Australia) was used for the visualization of the reconstructed images.
Micro-CT analysis
Further, high-resolution images of all specimens were obtained from a micro-computed tomography (CT) scanner (Skyscan 1076; SkyScan Inc., Aartselaar, Belgium) running at 40 kV (X-ray source voltage), 200 μA (beam current), 900 ms (exposure time), 9 μm (resolution), 0.8° (rotation step), and 180° (rotation angle). A polygonal region of interest in 100 slices with an approximate 1 mm wide ring around the implant surface was chosen, which represented the regenerated bone only. After scanning, the three-dimensional (3D) models were reconstructed from the volume of interest, where an optimized threshold was used to isolate the bone and materials from the background using the NRecon (Bruker Corporation, Billerica, MA, USA) and CTVol (Bruker Corporation). The percent bone volume (BV/TV), trabecular thickness, trabecular number, and bone mineral density (BMD) around the implant were calibrated and determined by the CTAn program (Bruker Corporation). Radiographs were also synthesized using the CTVol software package (Bruker Corporation) to reconstruct a 3D regenerated bone of 0.5 mm width in the marrow bonding to the implants.
Histology and histomorphometric analysis
The bone samples were fixed in 10% buffered formalin and dehydrated in a series of solutions with different ethanol concentrations. The samples were embedded in methyl methacrylate resin without decalcification, and micron sections were made after polymerization using a microtome with a rotating diamond-coated disc (SP1600; Leica Microsystems, Wetzlar, Germany) along the longitudinal axis of the bone–implant interface. Afterwards, the sectioned samples with a thickness of about 20 μm were stained by methylene blue–fuchsine solution. Optical microscopy (Olympus Corporation, Tokyo, Japan) and CLSM (LSM710; Carl Zeiss Meditec AG) were conducted to observe bone ingrowth and integration with the host tissue. The architecture of bone trabecules was morphologically evaluated, and the percentage of bone–implant contact (BIC) was assessed by histometric analysis (GSA Image Analyser; GSA Gesellschaft für Softwareentwicklung und Analytik mbH, Rostock, Germany) for each implant type.
Statistical analysis
All data are expressed as the mean ± standard deviations of representative, three representative and similar experiments carried out in triplicate. Statistical analysis was performed with the Origin software. Student’s t-test was used to determine the significant differences among the groups, and P-values <0.05 were considered statistically significant.
Results and discussion
Composition and mechanical properties of PEEK/n-HA/CF ternary composite
Figure 2A shows the Fourier-transform infrared spectrometry pattern of the PEEK/n-HA/CF composite. The strong peaks at 1,653 cm−1 originate from the C=O carbonyl stretching vibration, and the bands at 1,578 cm−1 and 1,500 cm−1 are the in-plane vibration band of benzene; two bands of C–H vibration at 840 cm−1 and 765 cm−1 belong to the divided bands of the out-of-plane bending vibration absorption of benzene, and among them, 840 cm−1 is the opposite-substituted aromatic ring. These are all characteristic peaks of PEEK. The existence of the PO4 group was confirmed by the bands of P–O vibration at 1,043 cm−1. Moreover, the absorption peaks at about 3,571 cm−1 could be attributed to the stretching vibration of hydroxyl resulting from HA. The XRD patterns of the samples are shown in Figure 2B, further confirming that HA incorporates into the CFRPEEK composite successfully. The peaks of 2θ at 18.7°, 20.8°, and 22.9° are characteristic peaks of PEEK, while the obvious (002) reflection plane of graphite from CF is located in about 25.4°, and the characteristic peaks of HA show up at 31.8°, 40.0°, 46.7°, 49.5°, and 53.9° in the ternary composite. Additionally, no new peak appears in the PEEK/n-HA/CF pattern except the inherent peaks of PEEK, HA, and CF themselves. This suggests that there are no new crystalline phase formations and no change in the crystal structure of the three materials during the composite preparation process.
Figure 2.
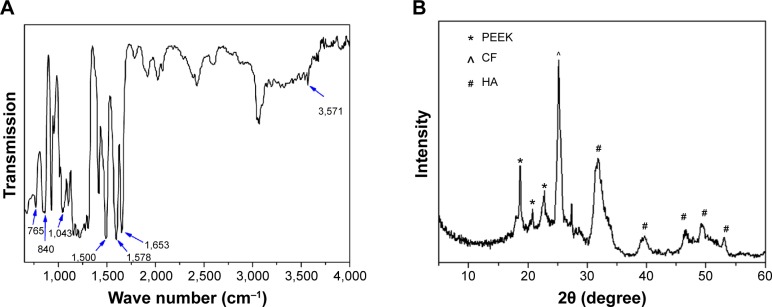
Chemical characterization of the pristine PEEK/n-HA/CF ternary composite.
Notes: (A) FT-IR spectrum; (B) XRD pattern.
Abbreviations: PEEK, polyetheretherketone; CF, carbon fiber; HA, hydroxyapatite; PEEK/n-HA/CF, carbon fiber-reinforced polyetheretherketone–nanohydroxyapatite; FT-IR, Fourier-transform infrared spectrometry; XRD, X-ray diffraction.
Table 1 presents the mechanical properties of pristine PEEK/n-HA/CF composites, with pure PEEK and pure Ti as the control. It could be seen that bare PEEK shows extremely lower elastic modulus and UTS, while the UTS of pure Ti is approximately 6–20 times greater than that of cortical bones, which could result in stress shielding. The use of materials stiffer than bone tissue can lead to mechanical mismatch problems between the implant and the adjacent bone tissue, where the integrity of the bone/implant interface may be compromised due to the resorption of bone tissue.7,16 However, the addition of n-HA and CF into the PEEK matrix enhances the hardness, elastic modulus, and the UTS, similar to those of human cortical bone, indicating that the mechanical properties of the composite could be tailored to mimic human cortical bone, thus avoiding stress shielding (Table 1). Therefore, it is expected that the prepared PEEK/n-HA/CF ternary composite with such mechanical properties could have great potential for use in biomedicine such as synthetic implant material.
Table 1.
Mechanical properties for PEEK, Ti, and PEEK/n-HA/CF composites showing the mean ± standard deviation hardness, elastic modulus, and UTS for each group
| Samples | UTS (MPa) | Elastic modulus (GPa) | Hardness (MPa) |
|---|---|---|---|
| PEEK/n-HA/CF (mean ± SD) | 135.6±8.2 | 16.5±0.7 | 143.0±6.3 |
| PEEK (mean ± SD) | 89.2±10.4 | 3.5±0.3 | 91.1±3.1 |
| Ti (mean ± SD) | 963.8±23.5 | 110.5±2.0 | 3,108.6±298.4 |
| Cortical bone | 50–150 | 6–23 | No data |
Abbreviations: PEEK, polyetheretherketone; PEEK/n-HA/CF, carbon fiber-reinforced polyetheretherketone–nanohydroxyapatite; SD, standard deviation; UTS, ultimate tensile strength.
Characterization of microroughened PEEK/n-HA/CF ternary biocomposite
Although CFRPEEK, currently used in orthopedic clinics, possesses good bone compatibility and satisfactory mechanical properties, its lack of bioactivity may limit its applications for bone repair. Consequently, there have been efforts to enhance its bioactivity and bone–implant integration via incorporating bioactive materials and creating microstructures on the surface. In the present study, the various microroughened PEEK/n-HA/CF ternary composite discs and implants containing 25 wt% n-HA and 20 wt% CF are fabricated using the compounding and injection–molding approach, followed by sandblasting treatment with increasing grit sizes of Al2O3 particles (Figure S1), as schemed in Figure 2, and these samples are denoted according to different Al2O3 sizes, as shown in Table 2.
Table 2.
The roughness and atomic percentage of the Ca/P element for various microroughened PEEK/n-HA/CF ternary composites showing the mean ± standard deviation
| Sample names | Control | Group 1 | Group 2 | Group 3 |
|---|---|---|---|---|
| Surface treatment | Polished with 2,000-grit paper | 60–80 μm Al2O3 | 110–150 μm Al2O3 | 180–250 μm Al2O3 |
| Ca content* | 6.0%±1.5% | 11.5%±3.4% | 21.4%±2.2% | 30.9%±2.6% |
| P content* | 3.8%±0.9% | 8.7%±1.1% | 13.9%±1.2% | 19.5%±1.1% |
| Ra (μm) | 0.12±0.01 | 0.93±0.09 | 1.96±0.21 | 2.95±0.35 |
| Rq (μm) | 0.17±0.02 | 1.28±0.17 | 2.49±0.27 | 3.64±0.56 |
Note:
The concentrations of calcium and phosphorus were reported and estimated from XPS analysis.
Abbreviations: PEEK/n-HA/CF, carbon fiber-reinforced polyetheretherketone–nanohydroxyapatite; Ra, average roughness; Rq, root-mean-square average roughness; XPS, X-ray photoelectron spectroscopy.
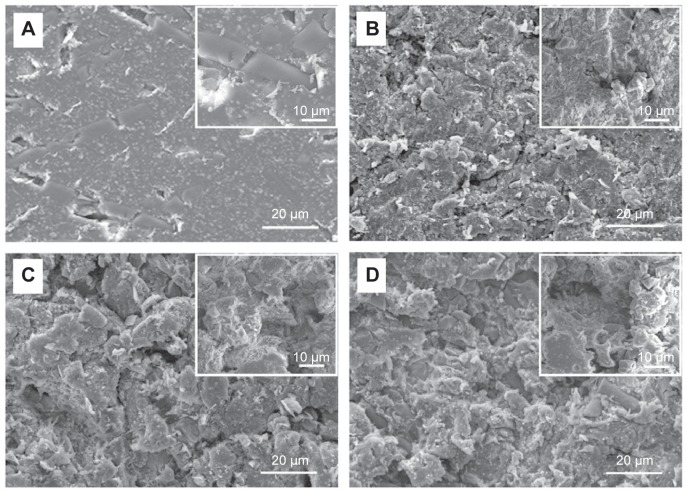
Understanding how surface topological factors affect bone cell behaviors is imperative to inform strategies for the design of novel biomaterials in bone tissue engineering; we thus first determined the surface morphology of the PEEK/n-HA/CF ternary composite using SEM. It is obvious that the pristine composite clearly displays the smoothest morphology, although a few of cracks appear on the surface (Figure 3A). The surfaces of PEEK/n-HA/CF specimens, however, after sandblasting treatment by three distinguishing Al2O3 particles possess a great degree of micrometer surface features with high and homogeneous coverage of protuberances and cavities – a clear indication of different micrometer rough surface topographies (Figure 3B–D). As expected, the apparent increase in the surface roughness regarding the average roughness (Ra) and root mean square average roughness (Rq) of the PEEK/n-HA/CF biocomposite after sandblasting treatment is confirmed (Table 2). Moreover, the surface roughness of the composite correlates to the gain size of Al2O3 particles, which is consistent with the observation from SEM.
Figure 3.
SEM images of the microroughened PEEK/n-HA/CF ternary composites.
Notes: (A) Control; (B) group 1; (C) group 2; and (D) group 3 with high-resolution images inserted on the top right.
Abbreviations: SEM, scanning electron microscope; PEEK/n-HA/CF, carbon fiber-reinforced polyetheretherketone–nanohydroxyapatite.
The addition of microscale features to the PEEK/n-HA/CF composite surfaces will affect the surface chemistry of the specimens. To preliminarily understand the alteration of the surfaces, energy-dispersive X-ray spectroscopy analysis was employed to characterize their chemical compositions. As shown in Figure S2, the elemental compositions of the polished and microroughened PEEK/n-HA/CF surfaces include carbon, oxygen, calcium, and phosphorus as the major components. The Ca content has an enhanced tendency with the increase in roughness of the composites. When subjected to sandblasting treatment, the sample surfaces tend to expose n-HA crystals, and substantial Ca and P elements are created. XPS, an important surface-specific characterization technique, is also applied to examine the surface chemistry, which is indispensable to the cell functions. Figure 4A depicts the quantitative results of XPS spectra acquired from various sample surfaces. The sandblasting has altered the concentrations of these elements on the surface, with a significant reduction in the concentration of C element, and dramatically higher concentrations of P and Ca elements than the untreated specimens, confirming the verdict from the energy-dispersive X-ray spectroscopy analysis. It is easy to find that the proportion of Ca and P elements increase to 30.9%±2.6% and 19.5%±1.1%, respectively, with the augmentation of surface roughness (Figure 4A and Table 2), which promotes more exposure of nano-HA particles on the composite surface. As was mentioned, the presence of the n-HA phase, considered as a superb contributor to bioactivity and osteoinduction activity, is able to promote the expression of extracellular matrix proteins in osteoblasts and chondrocytes, and it stimulates the differentiation of osteoprogenitor cells, thus facilitating the formation of bone.25,26 No trace of Al element was detected on the sample surfaces, implying no retention of Al2O3 particles, because these particles were thoroughly eliminated through the subsequent rinsing procedure.
Figure 4.
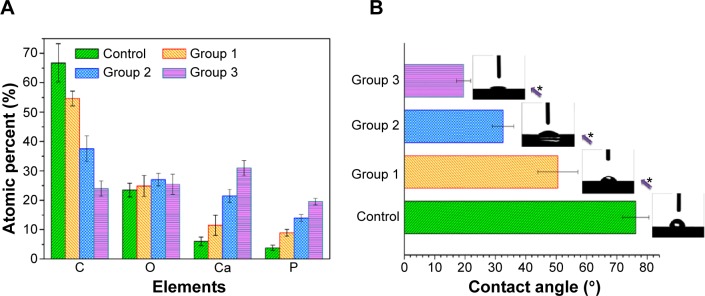
Elemental compositions and water contact angles of the specimens.
Notes: (A) Elemental compositions of various microroughened specimens measured by XPS. (B) Water contact angles measured on the samples with typical water droplet images inserted. *P<0.05.
Abbreviation: XPS, X-ray photoelectron spectroscopy.
It is recognized that the surface hydrophilicity of biomaterials is crucial to their biofunction, such as cell adhesion and spreading. The hydrophilicity of the samples, therefore, is evaluated by the static sessile drop method, and the images of the water droplets on the various samples are shown in Figure 4B. The bare ternary composite reflects the relatively hydrophobic response to water. Nevertheless, the microroughened specimens exhibit hydrophilic behavior with contact angles below 50°. Obviously, the increasing surface roughness contributes to the increased hydrophilicity, which is in accordance with other studies on microroughened Ti implants via the same sandblasting approach.27 It is interesting to point out that group 3, which was sandblasted with the largest Al2O3 grits, possessed the roughest surface topology and showed complete wetting on the surface. These results suggested that sandblasting is a viable way to improve the hydrophilicity of the CFRPEEK-based composite. Particularly in the case of orthopedic implants, such as cementless hip and knee prostheses, as well as dental implants, roughness has been introduced in order to influence bone ongrowth and early stabilization. Although several scientific reasons have been postulated for beneficial bioeffects of microstructures on the surfaces of osseous implants, fundamental questions remain to be answered regarding the cellular responses (adhesion, proliferation, and differentiation) to different sizes of surface roughness of CFRPEEK-based materials in vitro and in vivo. In this study, the cellular responses of the differentiated human osteoblast lineage cells on various microroughened surfaces of the PEEK/n-HA/CF ternary composite have been evaluated in terms of cell proliferation and the production of osteoblast differentiation markers in vitro, and the formation of new bone in vivo.
In vitro biocompatibility evaluation
It is well known that CFRPEEK-based materials have been widely employed in the biomedical fields and in medical devices, particularly in the area of load-bearing orthopedic and degenerative spine disease applications (such as the interbody fusion PEEK cage).8 It is expected that the designed microstructures could endow the PEEK/n-HA/CF composite with favorable cell proliferation and high cytocompatibility. Initial cell adhesion is usually responsible for cellular functions and eventual tissue integration, while cell proliferation is closely correlated with the amount of new bone formation. Better preosteoblast adhesion and proliferation probably produce a larger mass of bone tissues around the implants.23 Hence, the cell adhesion/viability of the as-prepared PEEK/n-HA/CF composite to human osteoblast-like MG-63 cells is an important factor that should be carefully evaluated for use of the microroughened composite in biological and biomedical applications, such as in orthopedic/bone implants.
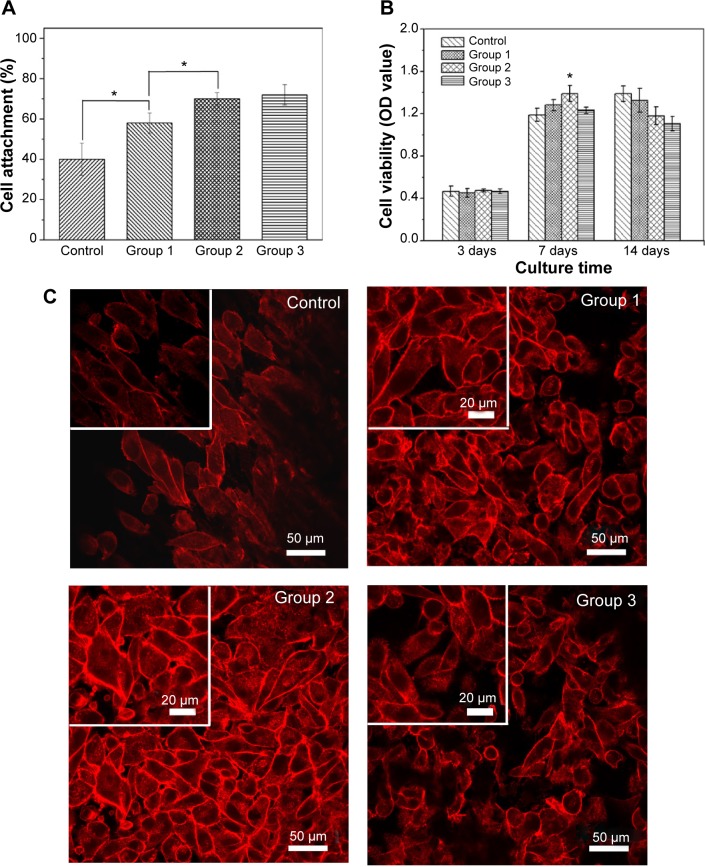
We first measured the in vitro cell adhesion of the samples using a colorimetric assay WST-1 on MG-63 cells at 4 hours, which is deemed sufficient to reflect the cell attachment in the early “decisive period”. The results reveal that better cell adhesion is detected on the microrough surfaces when compared to the polished counterpart (Figure 5A). Moreover, a significant positive correlation between surface roughness and the cells’ attachment is evident, proving that surface roughness could promote the initial cell attachment. The roughened surface has a greater surface area that can offer more binding sites of adhesive protein, which is an essential prerequisite for cell adhesion. Conversely, there were no statistical differences in the attachment of MG-63 cells between group 2 and group 3, indicating that surface roughness at a greater level may not be favorable to cell adhesion.
Figure 5.
Cell adhesion and cell proliferation rates cultured on various PEEK/n-HA/CF composites and adhesion morphology and actin cytoskeletal organization of cells after incubation with different samples.
Notes: (A) Cell adhesion (4 hours) and (B) cell proliferation rates cultured on various PEEK/n-HA/CF composites for 3 days, 7 days, and 14 days. (C) The adhesion morphology and actin cytoskeletal organization (red, labeled with rhodamine–phalloidin) of cells after incubation with different samples at 7 days. *P<0.05.
Abbreviations: OD, optical density; PEEK/n-HA/CF, carbon fiber-reinforced polyetheretherketone–nanohydroxyapatite.
In order to explore the long-term MG-63 cell responses on the surfaces of the microrough composite, cell proliferation was also probed at 3 days, 7 days, and 14 days. As shown in Figures 5B and 5C, the number of cells, as deduced from dehydrogenase measurements, for 3 days displayed no statistical differences among all groups. At 7 days, MG-63 cells grew rapidly on these microrough surfaces, with the proliferation rate higher than that of the control groups, coincident with the previous studies that coarser structure is beneficial for the proliferation of osteoblast cells in comparison to flat substrates.20,21 Conversely, the proliferation on the surface of group 2 (with moderate roughness) had the best viability, indicating that cells prefer to proliferate on moderate microroughness, and that excessive surface roughness suppresses cell proliferation and displays a certain amount of toxicity. Low cell numbers in vitro have commonly been perceived as a negative result in regard to osseointegration, and it has become the problem that needs to be solved in some studies.28,29 After 14 days, when compared with the control group, the cells on the roughened surfaces showed lower proliferation, possibly because cells became differentiated. To verify this assumption, the morphologies of the MG-63 cells on the control group and on group 2 for 14 days were observed by FE-SEM (Figure S3). It should be noted that when compared with those on the control surface, the cells on the microrough surface of group 2 secreted a larger amount of visible extracellular matrix-wrapping cells, suggesting that the cells seem to enter the differentiation stage and that microrough surfaces could promote cell maturity. It has been proven that a transcriptionally-restricted transition between proliferation and differentiation forces osteoblasts to stop dividing once they start maturing.21,30 It could be concluded from the cell adhesion and proliferation results that the well-defined surface roughness of the PEEK/n-HA/CF ternary biocomposite would present good cytocompatibility and better cell viability.
Generally speaking, the cells will undergo their morphological changes to stabilize the cell–material interface after contacting biomaterials. The whole process of adhesion and spreading consists of cell attachment, filopodial growth, cytoplasmic webbing, flattening of the cell mass, and ruffling as the peripheral cytoplasm progresses.31 To further illustrate the influence of surface structure on MG-63 cell behaviors, the next experiments were performed to measure the adherent cell number and to observe the adherent morphology. Figure 5C shows the numbers and morphologies of MG-63, where the cytoplasm is stained by rhodamine–phalloidin (red), growing on the various PEEK/n-HA/CF ternary composite surfaces for 7 days. It can be seen that most microroughened groups are superior to the control, showing upregulation of cell density. Moreover, most MG-63 cells in a polygon shape spread quite well and appear to be pseudopods on these roughness substrates, suggesting that microrough structures could be used as cell-anchoring sites for cell adhesion. At high magnification, the fluorescence images indicate that MG-63 shows limited spreading and displays spindle-like morphology on the polished samples (control group), and that F-actin is poorly developed. However, in comparison with the other groups, more MG-63 cells are attached and spread onto group 2, indicating that optimal surface roughness might enhance cell adhesion, in accordance with the WST-1 results described earlier. Furthermore, as cell adhesion is enhanced, the MG-63 cultured on group 2 displays a visibly bright presentation of more mature F-actin. Following quantitative counting, the number of adherent cells on group 2 was significantly more than those of the other groups (Figure S4), indicating that the PEEK/n-HA/CF ternary biocomposite with moderate roughness exhibits superb in vitro cytocompatibility.
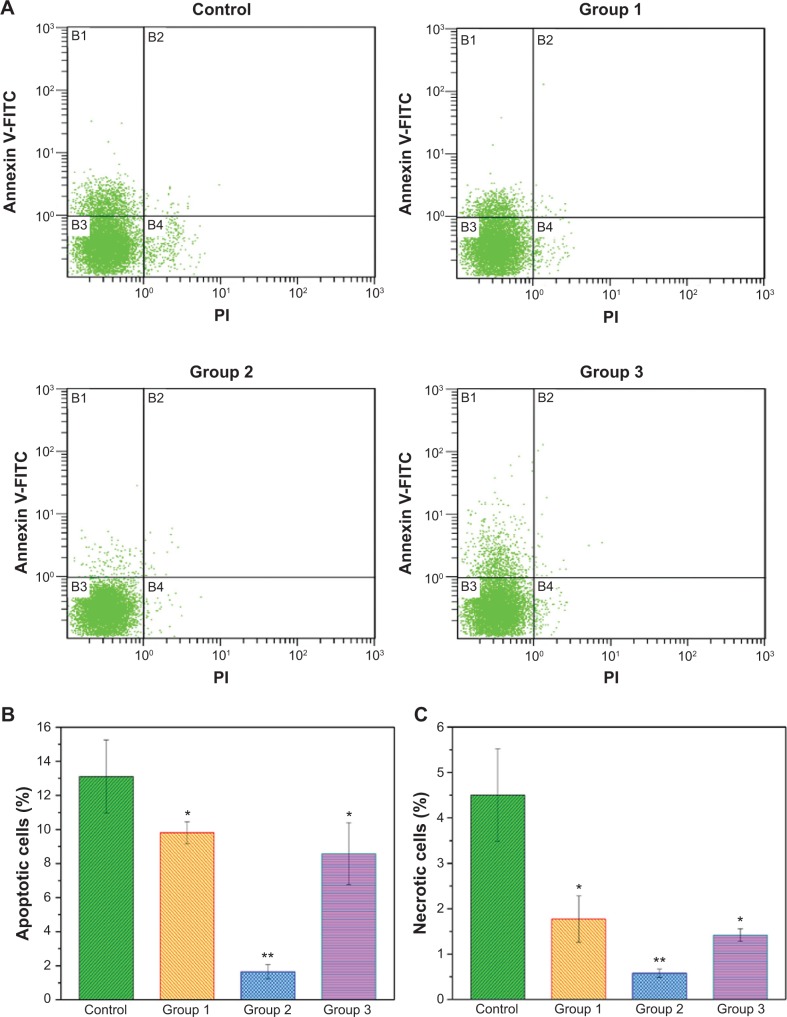
In addition to assessing proliferation, the apoptosis and death of MG-63 cells were further evaluated using flow cytometry (Figure 6). When MG-63 cells were treated with various micromodified PEEK/n-HA/CF for 7 days in a basic growth medium, significant changes were found between the groups. More cells were located in the B1 and B4 regions for the pristine PEEK/n-HA/CF group than for the other microroughened surfaces, implying that a number of cells exhibit early apoptosis and death. However, a significantly smaller percentage of apoptotic and necrotic cells are found on the micromodified samples, indicating that the microroughened PEEK/n-HA/CF samples after sandblasting provided a more favorable environment for cell growth. The apoptosis and necrosis rates of the group 2 surface, however, were measured to be 1.65%±0.42% and 0.58%±0.09%, respectively, which is obviously negligible, thus revealing that reasonable surface roughness is allowed to contribute to cell growth. Although it is well known that the surface morphology plays a momentous role in the cytocompatibility of biomaterials, the relationship between surface roughness and biomedical behavior is still unclear.32,33 These results suggest that only appropriate surface roughness could greatly promote the biological activity of the implants.
Figure 6.
Flow cytometric analyses of cell apoptosis after treatment with the different composites for 7 days.
Notes: (A) Typical figures for flow cytometric analysis of necrotic cells (X-axis, PI fluorescence) versus apoptotic cells (Y-axis, Annexin V-FITC) at 7 days. (B) The percentages of apoptotic cells for different groups. (C) The percentage of necrotic cells for different groups. *P<0.05 compared to the control group. **P<0.01 compared to the control group.
Abbreviations: FITC, fluorescein isothiocyanate; PI, propidium iodide.
In vitro osteogenic differentiation response
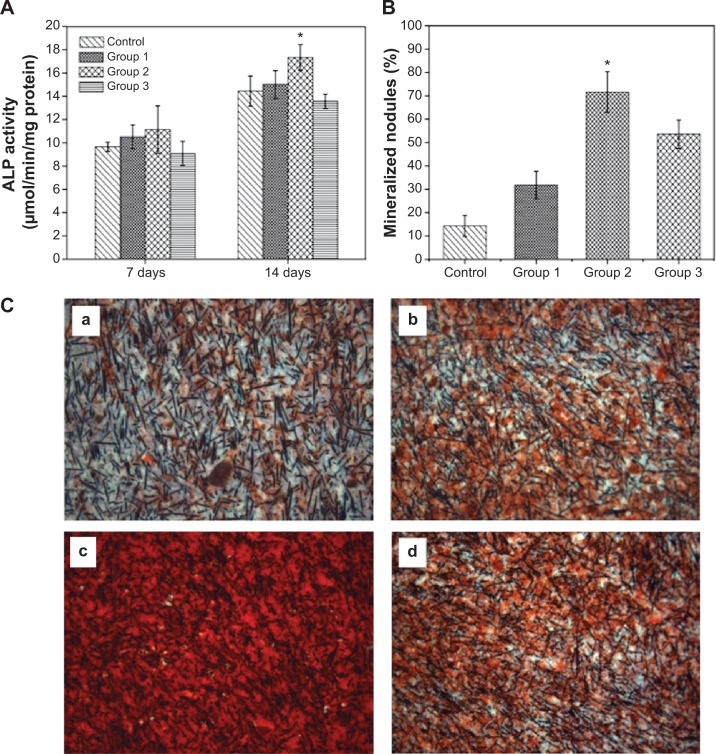
The osteogenic differentiation of cells on the biointerfaces through material–tissue interlocking, as far as bone-repair biomaterials are concerned, is a key event in bone formation. Among the major osteogenic hallmarks, ALP activity is an early marker of osteogenic differentiation, participating in the regulation of a mature bone matrix calcification process and affecting cell osteogenic mineralization ability.34 In vitro ALP expression of MG-63 cultured with different biocomposite are evaluated at 7 days and 14 days (Figure 7A). In the present study, we observed a substantially higher level of ALP production by the cells grown in group 2 compared with the other samples after 14 days of growth, although no significant differences were discerned at 7 days of culture. Notably, the ALP activities of MG-63 are suppressed on the group 3 microrough surface, indicating that excessive surface roughness harbors harmful effects for cell differentiation, and appropriate roughness could trigger an upregulation of ALP, which is correlated with the first checkpoint for osteogenic differentiation.
Figure 7.
Osteogenic differentiation of MG-63 cells on the surfaces of various microrough PEEK/n-HA/CF biocomposites.
Notes: (A) ALP activity after cultivating for 7 days and 14 days. (B) Mineralized nodules after cultivation for 14 days. (C) ARS of the production of the mineralized extracellular matrix of cells cultured onto the microrough surfaces of (a) the control group, (b) group 1, (c) group 2, and (d) group 3 on day 14. *P<0.05 compared to the other groups.
Abbreviations: ALP, alkaline phosphatase; PEEK/n-HA/CF, carbon fiber-reinforced polyetheretherketone–nanohydroxyapatite; ARS, Alizarin red staining.
Concomitantly, we analyzed the efficiency of the mineralization stage using ARS as a marker for inorganic calcium, a characteristic common to bone-like structures. Figure 7B and C show the effect of surface roughness of the composite on the formation of the mineralized matrix in osteoinductive media on day 14. Similar effects were observed for the calcium deposition production. The MG-63 cells cultured on rough surfaces clearly showed more positive and brighter red staining than the smooth groups. In addition, a significant increase in the number of nodules and the amount of mineralized matrix are detected within certain realms of surface roughness. Our results are consistent with the observations of Wu et al35 in that microroughened titanium with rough surfaces enhances ALP activity and extracellular calcium deposition over conventional smooth titanium implants. However, the peak of mineralized nodules emerges on the group 2 surface, and a striking decreased tendency in cell mineralization is seen in group 3, underlining the role of moderate surface roughness in the enhancement of osteogenic differentiation efficiency. Our cell differentiation results (higher production of differentiation markers), coupled with a synergistically lower cell number at 14 days, further prove the that cells growing on the group 2 surfaces exit the proliferation phase earlier, so as to start differentiating and producing the necessary matter (such as protein and calcium) for bone formation. These findings reinforce the statement that well-defined surface roughness could act as a promoter of osteogenic differentiation.
Osteoblasts do not interact directly with the surface of implants, but they can sense the changes in surface properties by identifying the layer of adsorbed proteins from the surrounding environment using cell membrane receptors such as integrins.36 We set out to comprehend the impact of the extent of microscale surface roughness on cell responses; a nonspecific albumin was adopted to evaluate the general protein adsorption as bioaffinity. Figure 8 illustrates the adhesion of albumin on top of experimental samples within the initial 24 hours. Within the first 2 hours, the plot of BSA adsorption kept ascending quickly with the passage of time; it was then temporarily saturated at 4 hours (the “decisive period” of cell attachment), and finally reached the top at 24 hours. Moreover, the protein adsorption enhanced with the augmentation of the surface roughness was below the extent of that in group 2. It is remarkable that protein adsorption onto the substrate of group 2 throughout the test dominated, and was significantly higher than that of group 3, indicating that the moderate surface roughness of group 2 could increase the surface adsorption of key extracellular matrix components such as albumin, glycoprotein, and fibronectin in culture medium containing serum. It is well known that serum used in the culturing of eukaryotic cells consists of many extracellular matrix proteins. These proteins play major roles in cell adhesion, as they tend to aggregate on the substrates then promote cell adhesion/proliferation, as well as subsequent differentiation. The cell viability assay in this study provides evidence that group 2 provides the positive cues to promote cell adhesion and proliferation, whereas group 3 is a less desirable substrate for cell propagation. Cell adhesion behavior as a function of surface roughness or other surface characteristics, such as hydrophilicity, surface chemistry, and topology, has indeed been the hot subject of ongoing research, and several complex factors are at play.37–40 These results were attributed to the following the three advantages of group 2: the appropriate surface roughness; the improved hydrophilicity; and the presence of Ca ions. This has served as proof of the idea that the surface topography of substrates is more essential than their surface chemistry for protein adsorption, thus resulting in the adhesion and proliferation of cells.2 The cavities on group 3 are probably too large for the protein aggregation to fill up, and the sharp edges of the protuberances/pores that can be anchored are limited in area. In contrast to group 3, the cavities on the group 2 surface are smaller in dimension, and the geometrical feature of the surfaces could determine that protein aggregation is capable of anchoring on the troughs between the adjacent tubers. The protein adsorption and proliferation of MG-63 cells are promoted as a result. Several studies have also shown that the production of the local factor, osteoprotegerin (which serves as a decoy receptor for RANKL to inhibit osteoclastogenesis and to favor net bone formation21), is strongly influenced by the hierarchically microroughened surfaces,41 and it is believed that integrins such as α2β1,42,43 among the favored protein aggregations on surface topography, are crucial to enhance cell osteogenesis on group 2 surfaces. In addition, hydrophilic material surfaces are better for cell attachment, spreading, and cytoskeletal organization; however, superhy-drophilic surfaces, like those of group 3, are not beneficial for protein adsorption,44,45 resulting in poor cell functions. On the other hand, the appropriate Ca ion levels have been shown to stimulate osteoblast proliferation and differentiation by changing the expression of specific Ca2+ channel isoforms on osteoblasts.46,47 Therefore, it is concluded that the superiority of the group 2 surface in supporting cell proliferation and osteogenesis depends on both the favorable surface topography and chemistry. In other words, the proper topography of group 2 plays a pivotal role in promoting cell biofunctions, and the chemical modification rendered by nano-HA blending further enhances the positive effects. Without a doubt, a further comprehensive and in-depth investigation of the reason why appropriate surface roughness range is responsible for enhanced cytobiocompability and osteogenesis activity is currently underway in our laboratory.
Figure 8.
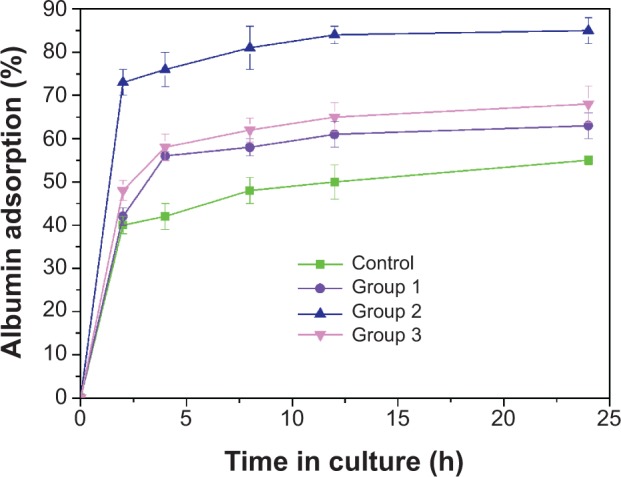
Bioaffinity evaluation of the protein adsorption of the different microroughened PEEK/n-HA/CF composite groups.
Abbreviations: h, hours; PEEK/n-HA/CF, carbon fiber-reinforced polyetheretherketone–nanohydroxyapatite.
In vivo tissue response evaluation
Besides in vitro evaluation, in vivo tissue response to the microroughened PEEK/n-HA/CF ternary biomaterials, as a gold standard for osseointegration, is crucial to the success of our composites as artificial implants. However, comprehensive in vitro tests indicate that the properly roughened surfaces with group 2 are preferred to aid the bioactivity and osteogenesis of the composite. Therefore, the cylindrical implants are blasted by 110–150 μm Al2O3 (group 2) before the in vivo tests as the experimental group, with a polished counterpart serving as the control group.
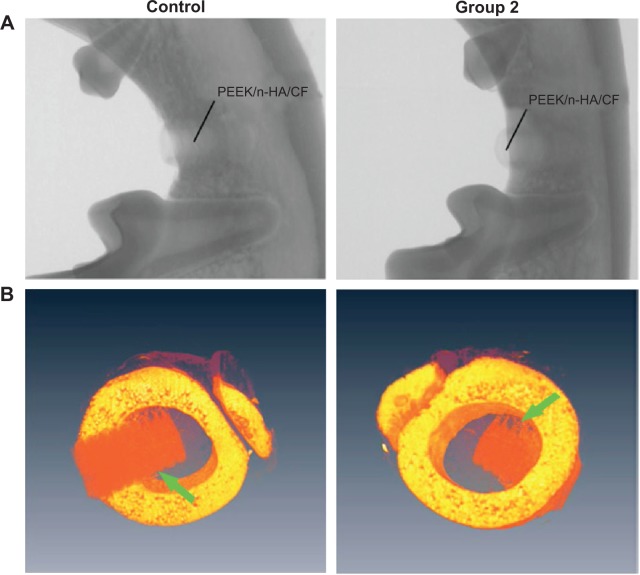
Owing to the radiolucency of CFRPEEK, the bone recovery around the implant can be readily probed by X-ray examination (Figure 9A), which cannot be observed in metal implants due to the radiopacity of metal alloys. SRμCT yields higher spatial resolution and contrast, giving a more accurate review of the fusion between bone and implant48 when compared with conventional bone histomorphometry. From the SRμCT scan in Figure 9B, the bone resorption and looseness of the implants after recovery are not seen, and the PEEK/n-HA/CF biocomposites show bone integration of the implant at 8 weeks, suggesting good binding to the abutting bone tissue.
Figure 9.
Radiographs and SRμCT scan of a beagle’s mandible with bare and micromodified threaded PEEK/n-HA/CF ternary implants for 8 weeks of implantation.
Notes: (A) Radiographs and (B) SRμCT scan of a beagle’s mandible. The green arrows refer to the interfaces between bone tissue and implants.
Abbreviations: PEEK/n-HA/CF, carbon fiber-reinforced polyetheretherketone–nanohydroxyapatite; SRμCT, synchrotron–radiation-based computer microtomography.
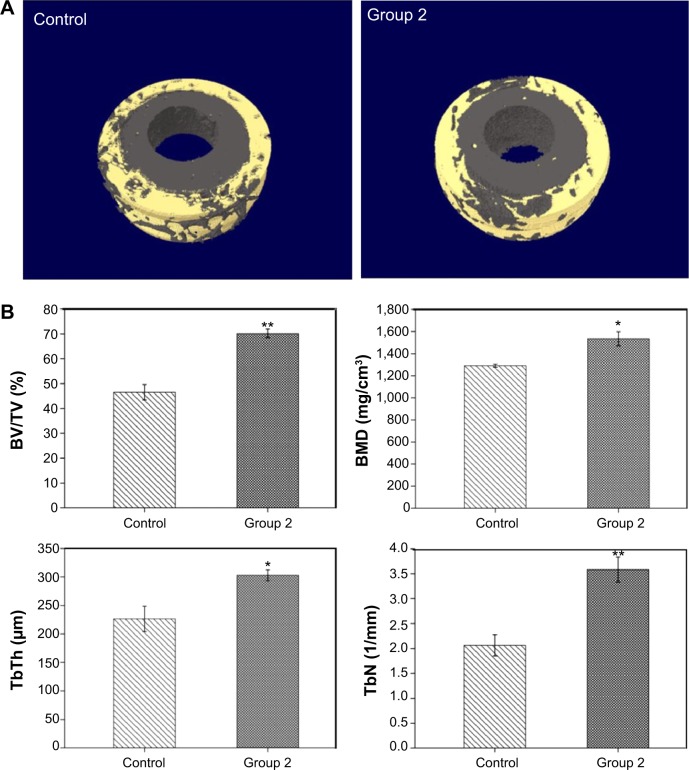
In the next step, micro-CT has been utilized extensively in the study of trabecular architecture with X-ray radiation as a penetrating probe. In Figure 10A, the implanted microrough PEEK/n-HA/CF is thickly surrounded by natural bone, which shows the trabeculae of about 0.5 mm thickness vertical to the longitudinal axis of the cylindrical implants, 2 mm in length along the longitudinal axis of the implants. The quantitative analysis of the differences between the two groups is indicated in Figure 10B, and the bone volume/tissue volume (BT/TV) of the microroughened group 2 implant is significantly higher than that of the pure composite control group at 8 weeks after surgery (P=0.01). Moreover, the BMD for group 2 after implantation is dramatically higher (P=0.05). The trabecular number and the trabecular thickness in the group 2 implant are also superior to that in the bare implant group 8 weeks after implantation (P=0.01 and P=0.05, respectively). These results show that the quantity of newly-formed bone in contact with the group 2 composite implants is drastically higher than that of the smooth implant (control). It has been reported that microrough titanium implant surfaces show a significant increase in the gene expression levels of osteocalcin and tartrate-resistant acid phosphatase (TRAP), and they also exhibit higher values both in the newly woven bone and in older Haversian bone reconstruction.49 Moreover, similar results are abundant in the literature and show enhanced osseointegration on microrough surfaces when compared to machined surfaces, as measured by BIC and mechanical testing.36,50 When micromodified PEEK/n-HA/CF is in contact with bone marrow after implantation, the rough surface, as well as the exposure of n-HA, inevitably promotes the growth of osteoblasts and gives rise to bone formation. The results are closely correlated with osteoblast proliferation and differentiation in vitro as well. Thus, the microroughened PEEK/n-HA/CF implants after sandblasting with optimal roughness not only positively affect the osseointegration between the implant and bone, but they also increase bone formation surrounding the implant.
Figure 10.
Micro-CT reconstruction models and micro-CT results after 8 weeks of implantation.
Notes: (A) Micro-CT 3D reconstruction models showing regeneration of microstructures about 0.5 mm in thickness bonding to polished and microrough PEEK/n-HA/CF implants at 8 weeks. (B) Micro-CT results containing the percent of BV/TV, BMD, TbTh, and TbN after 8 weeks of implantation. *P<0.05 compared to the control group. **P<0.01 compared to the control group.
Abbreviations: BV/TV, bone volume/tissue volume; BMD, bone mineral density; TbTh, trabecular thickness; TbN, trabecular number; CT, computed tomography; 3D, three-dimensional; PEEK/n-HA/CF, carbon fiber-reinforced polyetheretherketone–nanohydroxyapatite.
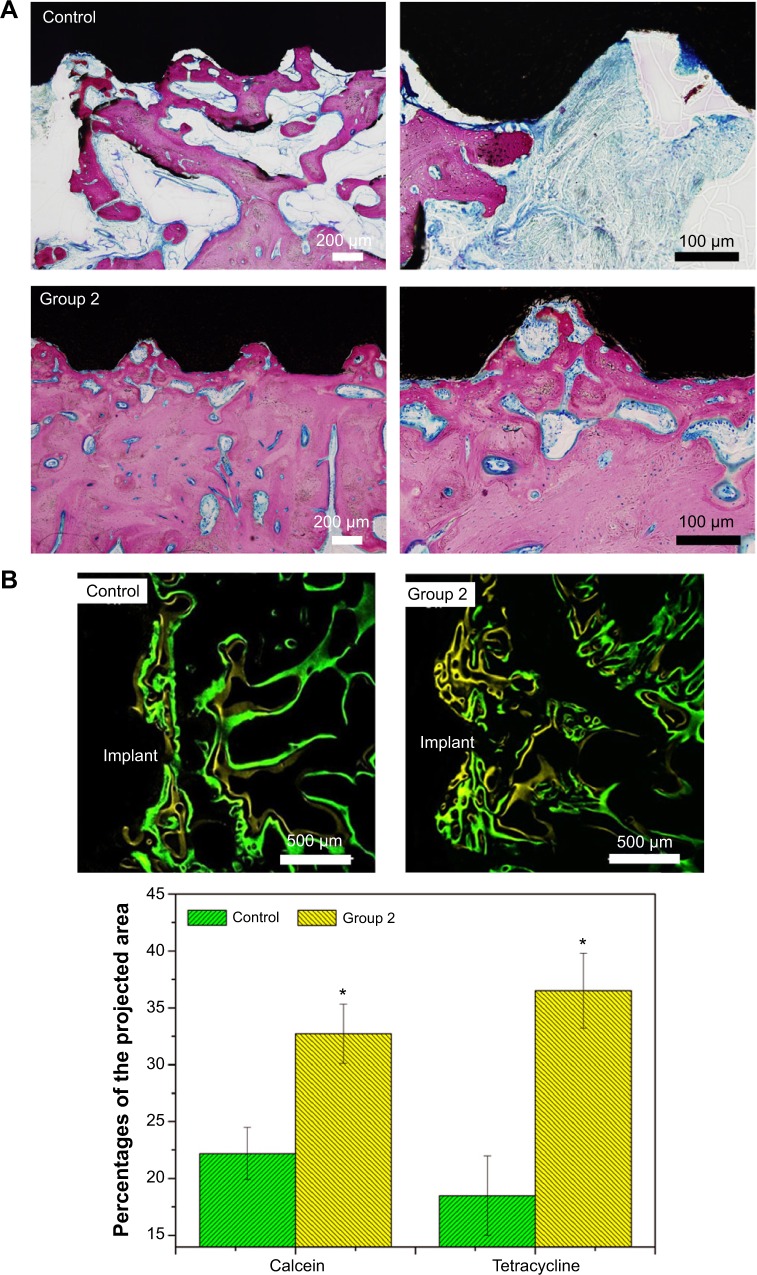
Figure 11 shows the tissue response to the smooth and microroughened PEEK/n-HA/CF implants after 8 weeks with immunohistochemical staining. Obvious integration of the bone to the microroughened PEEK/n-HA/CF biocomposite surface is demonstrated, where the pink area represents the newly-formed bone (Figure 11A). The ingrowth of the newly-formed lamellar bone or trabecular alignment are dramatically distinguished without fibrous tissue encapsulation on the interface between the bone and the composite implants at 8 weeks, which showcases phenomenal osteoinductive integration. In addition, no inflammation or necrosis was observed on either of the polished or microroughened PEEK/n-HA/CF samples, suggesting that the implants do not produce observable toxic effects in the surrounding tissues, although a longer time point is necessary prior to clinical acceptance, and to encourage the healing process. There is no obvious increase in bone fusion in the bare PEEK/n-HA/CF implant group at 8 weeks after surgery (Figures 11A and 11B). On the other hand, more bones are formed around the microrough PEEK/n-HA/CF implants. A greater percentage of BIC on the group 2 implant is detected in comparison with the control group (Figure S5), and the results are consistent with those obtained by the micro-CT analysis. Fluorochrome labeling has been used to locate the site of new bone formation since it is designed to bind with calcium ions and to become incorporated into the site of mineralization. Since tetracycline and calcein are injected on weeks 2 and 4, new bone with zonal and reticular markers could be formed continuously on the smooth and microroughened PEEK/n-HA-CF biocomposite (Figure 11B). More bone deposition and remodeling, nevertheless, are found around the microroughened PEEK/n-HA/CF implants, suggesting a greater degree of bone regeneration. The quantitative data of fluorochrome labeling also proves that more tetracycline and calcein markers are observed around group 2 implants, demonstrating enhanced osseointegration of the ternary biocomposite. As a consequence, in vivo tests clearly indicate that our PEEK/n-HA-CF biocomposite implants with optimal surface roughness possess the superior ability to bond with host bones and significantly promote osseointegration, thus boding well for their application in orthopedic implants.
Figure 11.
Histology and histomorphometric analysis of the polished and microroughened PEEK/n-HA/CF biocomposite implants.
Notes: (A) Histotomy of bone contact immunostained by toluidine blue–fuchsine staining at 8 weeks with low and high magnification. The pink area represents the newly-formed bone, and dark black area represents the implants. (B) Fluorochrome labeling and quantitative determination with calcein and tetracycline show the greater new bone formation on the surface of the microroughened CFRPEEK-based biocomposite. *P<0.05 compared to the control.
Abbreviations: PEEK/n-HA/CF, carbon fiber-reinforced polyetheretherketone–nanohydroxyapatite; CFRPEEK, carbon fiber-reinforced polyetheretherketone.
Conclusion
The PEEK/n-HA/CF ternary biocomposites with variable surface roughness have been successfully fabricated, and the impact of the surface roughness on their in vitro and in vivo biofunctionalities is systematically estimated for the first time. Taken together, laboratory experiments here have clearly showcased that compared with their polished counterpart, the PEEK/n-HA/CF biocomposite with moderate roughness is cytocompatible and triggers a set of events in vitro that follow the temporal pattern of osteogenic differentiation (ALP activity and cell mineralization). More importantly, the in vivo test reveals that the newly-formed bone volume of microrough PEEK/n-HA/CF biocomposite is higher based on 3D micro-CT and two-dimensional histomorphometric analysis. The study has provided insight for the deeper understanding of the biological effect of the surface roughness of implants. It has also offered guidance for the design of the microroughness on CFRPEEK-based implant materials, as sandblasting treatment produces different surface morphologies and chemistry on biomaterials, which will affect the adhesion, proliferation, and differentiation of bone cells. Simultaneously, these reports demonstrate that the PEEK/n-HA/CF biocomposite with optimal surface roughness can improve biocompatibility in vitro and promote osseointegration in vivo, which suggests that it has great potential to be applied as an orthopedic implant material in bone repair, bone regeneration, and bone tissue engineering applications.
Supplementary materials
SEM images of different Al2O3 grains used for sandblasting treatment.
Notes: (A) Al2O3 particles with a grain size of 60–80 μm; (B) Al2O3 particles with a grain size of 110–150 μm; (C) Al2O3 particles with a grain size of 180–250 μm.
Abbreviation: SEM, scanning electron microscope.
Energy-dispersive X-ray spectroscopy analysis of the control group, group 1, group 2, and group 3 of the PEEK/n-HA/CF ternary biocomposites.
Notes: (A) Control group; (B) group 1; (C) group 2; and (D) group 3 of the PEEK/n-HA/CF ternary biocomposites.
Abbreviations: At%, atom percentage; PEEK/n-HA/CF, carbon fiber-reinforced polyetheretherketone–nanohydroxyapatite.
Scanning electron microscope images of osteoblast-like cells on the surfaces of the control and group 2 samples cultured for 14 days.
Notes: (A) Control group; (B) group 2.
The number of adherent cells per projected area on the different biocomposite surfaces calculated by immunofluorescence.
Note: *P<0.05 compared to other groups.
Percentage of bone–implant contact for the control and group 2 implants at 8 weeks.
Note: *P<0.05.
Acknowledgments
This work was supported by the Beijing Natural Science Foundation (7132124), State Key Development Program for Basic Research of China (grant 2007CB936103), and Peking University’s 985 Grant.
Footnotes
Disclosure
The authors report no conflicts of interest in this work.
References
- 1.Gentleman E, Swain RJ, Evans ND, et al. Comparative materials differences revealed in engineered bone as a function of cell-specific differentiation. Nat Mater. 2009;8(9):763–770. doi: 10.1038/nmat2505. [DOI] [PubMed] [Google Scholar]
- 2.Wang H, Kwok DT, Xu M, et al. Tailoring of mesenchymal stem cells behavior on plasma-modified polytetrafluoroethylene. Adv Mater. 2012;24(25):3315–3324. doi: 10.1002/adma.201104967. [DOI] [PubMed] [Google Scholar]
- 3.Ding SJ, Shie MY, Wei CK. In vitro physicochemical properties, osteogenic activity, and immunocompatibility of calcium silicate-gelatin bone grafts for load-bearing applications. ACS Appl Mater Interfaces. 2011;3(10):4142–4153. doi: 10.1021/am201017v. [DOI] [PubMed] [Google Scholar]
- 4.Smith LJ, Swaim JS, Yao C, Haberstroh KM, Nauman EA, Webster TJ. Increased osteoblast cell density on nanostructured PLGA-coated nanostructured titanium for orthopedic applications. Int J Nanomedicine. 2007;2(3):493–499. [PMC free article] [PubMed] [Google Scholar]
- 5.Zhao Y, Wong SM, Wong HM, et al. Effects of carbon and nitrogen plasma immersion ion implantation on in vitro and in vivo biocompatibility and titanium alloy. ACS Appl Mater Interfaces. 2013;5(4):1510–1516. doi: 10.1021/am302961h. [DOI] [PubMed] [Google Scholar]
- 6.Wang L, He S, Wu X, et al. Polyetheretherketone/nano-fluorohydroxyapatite composite with antimicrobial activity and osseointegration properties. Biomaterials. 2014;35(25):6758–6775. doi: 10.1016/j.biomaterials.2014.04.085. [DOI] [PubMed] [Google Scholar]
- 7.Huiskes R, Weinans H, van Rietbergen B. The relationship between stress shielding and bone resorption around total hip stems and the effects of flexible materials. Clin Orthop Relat Res. 1992:124–134. [PubMed] [Google Scholar]
- 8.Kurtz SM, Devine JN. PEEK biomaterials in trauma, orthopedic, and spinal implants. Biomaterials. 2007;28(32):4845–4869. doi: 10.1016/j.biomaterials.2007.07.013. [DOI] [PMC free article] [PubMed] [Google Scholar]
- 9.Lu T, Liu X, Qian S, et al. Multilevel surface engineering of nanostructured TiO2 on carbon-fiber-reinforced polyetheretherketone. Biomaterials. 2014;35(22):5731–5740. doi: 10.1016/j.biomaterials.2014.04.003. [DOI] [PubMed] [Google Scholar]
- 10.Devine DM, Hahn J, Richards RG, Gruner H, Wieling R, Pearce SG. Coating of carbon fiber-reinforced polyetheretherketone implants with titanium to improve bone apposition. J Biomed Mater Res B Appl Biomater. 2013;101(4):591–598. doi: 10.1002/jbm.b.32861. [DOI] [PubMed] [Google Scholar]
- 11.Pei X, Friedrich K. Erosive wear properties of unidirectional carbon fiber reinforced PEEK composites. Tribol Int. 2012;55:135–140. [Google Scholar]
- 12.Khonsari RH, Berthier P, Rouillon T, Perrin JP, Corre P. Severe infectious complications after PEEK-derived implant placement: report of three cases. J Oral Maxillofac Surg. 2014;26(4):477–482. [Google Scholar]
- 13.Ma R, Tang T. Current strategies to improve the bioactivity of PEEK. Int J Mol Sci. 2014;15(4):5426–5445. doi: 10.3390/ijms15045426. [DOI] [PMC free article] [PubMed] [Google Scholar]
- 14.Wu X, Liu X, Wei J, Ma J, Deng F, Wei S. Nano-TiO2/PEEK bioactive composite as a bone substitute material: in vitro and in vivo studies. Int J Nanomedicine. 2012;7:1215–1225. doi: 10.2147/IJN.S28101. [DOI] [PMC free article] [PubMed] [Google Scholar]
- 15.Wang Q, Xue Q, Shen W, Zhang J. The friction and wear properties of nanometer ZrO2-filled polyetheretherketone. J Appl Polym Sci. 1998;69(1):135–141. [Google Scholar]
- 16.Converse GL, Yue W, Roeder RK. Processing and tensile properties of hydroxyapatite-whisker-reinforced polyetheretherketone. Biomaterials. 2007;28(6):927–935. doi: 10.1016/j.biomaterials.2006.10.031. [DOI] [PubMed] [Google Scholar]
- 17.Converse GL, Conrad TL, Merrill CH, Roeder RK. Hydroxyapatite whisker-reinforced polyetherketoneketone bone ingrowth scaffolds. Acta Biomater. 2010;6(3):856–863. doi: 10.1016/j.actbio.2009.08.004. [DOI] [PubMed] [Google Scholar]
- 18.Ma R, Tang S, Tan H, et al. Preparation, characterization, and in vitro osteoblast functions of a nano-hydroxyapatite/polyetheretherketone biocomposite as orthopedic implant material. Int J Nanomedicine. 2014;9:3949–3961. doi: 10.2147/IJN.S67358. [DOI] [PMC free article] [PubMed] [Google Scholar]
- 19.Abu Bakar MS, Cheng MH, Tang SM, et al. Tensile properties, tension-tension fatigue and biological response of polyetheretherketone-hydroxyapatite composites for load-bearing orthopedic implants. Biomaterials. 2003;24(13):2245–2250. doi: 10.1016/s0142-9612(03)00028-0. [DOI] [PubMed] [Google Scholar]
- 20.Zhang W, Li Z, Huang Q, et al. Effects of a hybrid micro/nanorod topography-modified titanium implant on adhesion and osteogenic differentiation in rat bone marrow mesenchymal stem cells. Int J Nanomedicine. 2013;8:257–265. doi: 10.2147/IJN.S39357. [DOI] [PMC free article] [PubMed] [Google Scholar]
- 21.Gittens RA, Olivares-Navarrete R, McLachlan T, et al. Differential responses of osteoblast lineage cells to nanotopographically-modified, microroughened titanium-aluminum-vanadium alloy surfaces. Biomaterials. 2012;33(35):8986–8994. doi: 10.1016/j.biomaterials.2012.08.059. [DOI] [PMC free article] [PubMed] [Google Scholar]
- 22.Lin K, Xia L, Gan J, et al. Tailoring the nanostructured surfaces of hydroxyapatite bioceramics to promote protein adsorption, osteoblast growth, and osteogenic differentiation. ACS Appl Mater Interfaces. 2013;5(16):8008–8017. doi: 10.1021/am402089w. [DOI] [PubMed] [Google Scholar]
- 23.Zhao Y, Wong HM, Wang W, et al. Cytocompatibility, osseointegration, and bioactivity of three-dimensional porous and nanostructured network on polyetheretherketone. Biomaterials. 2013;34(37):9264–9277. doi: 10.1016/j.biomaterials.2013.08.071. [DOI] [PubMed] [Google Scholar]
- 24.Collaert B, Wijnen L, De Bruyn H. A 2-year prospective study on immediate loading with fluoride-modified implants in the edentulous mandible. Clin Oral Implants Res. 2011;22(10):1111–1116. doi: 10.1111/j.1600-0501.2010.02077.x. [DOI] [PubMed] [Google Scholar]
- 25.Lü LX, Zhang XF, Wang YY, et al. Effects of hydroxyapatite-containing composite nanofibers on osteogenesis of mesenchymal stem cells in vitro and bone regeneration in vivo. ACS Appl Mater Interfaces. 2013;5(2):319–330. doi: 10.1021/am302146w. [DOI] [PubMed] [Google Scholar]
- 26.Li D, Sun H, Jiang L, et al. Enhanced biocompatibility of PLGA nanofibers with gelatin/nano-hydroxyapatite bone biomimetics incorporation. ACS Appl Mater Interfaces. 2014;6(12):9402–9410. doi: 10.1021/am5017792. [DOI] [PubMed] [Google Scholar]
- 27.Li HF, Wang YB, Zheng YF, Lin JP. Osteoblast response on Ti- and Zr-based bulk metallic glass surfaces after sand blasting modification. J Biomed Mater Res B Appl Biomater. 2012;100(7):1721–1728. doi: 10.1002/jbm.b.32738. [DOI] [PubMed] [Google Scholar]
- 28.Pittrof A, Park J, Bauer S, Schmuki P. ECM spreading behaviour on micropatterned TiO2 nanotube surfaces. Acta Biomater. 2012;8(7):2639–2647. doi: 10.1016/j.actbio.2012.03.040. [DOI] [PubMed] [Google Scholar]
- 29.Webster TJ, Ejiofor JU. Increased osteoblast adhesion on nanophase metals: Ti, Ti6Al4V, and CoCrMo. Biomaterials. 2004;25(19):4731–4739. doi: 10.1016/j.biomaterials.2003.12.002. [DOI] [PubMed] [Google Scholar]
- 30.Stein GS, Lian JB, Stein JL, Van Wijnen AJ, Montecino M. Transcriptional control of osteoblast growth and differentiation. Physiol Rev. 1996;76(2):593–629. doi: 10.1152/physrev.1996.76.2.593. [DOI] [PubMed] [Google Scholar]
- 31.Rajaraman R, Rounds DE, Yen SP, Rembaum A. A scanning electron microscope study of cell adhesion and spreading in vitro. Exp Cell Res. 1974;88(2):327–339. doi: 10.1016/0014-4827(74)90248-1. [DOI] [PubMed] [Google Scholar]
- 32.Kunzler TP, Drobek T, Schuler M, Spencer ND. Systematic study of osteoblast and fibroblast response to roughness by means of surface-morphology gradients. Biomaterials. 2007;28(13):2175–2182. doi: 10.1016/j.biomaterials.2007.01.019. [DOI] [PubMed] [Google Scholar]
- 33.Guldberg RE, Duvall CL, Peister A, et al. 3D imaging of tissue integration with porous biomaterials. Biomaterials. 2008;29(28):3757–3761. doi: 10.1016/j.biomaterials.2008.06.018. [DOI] [PMC free article] [PubMed] [Google Scholar]
- 34.Pittenger MF, Mackay AM, Beck SC, et al. Multilineage potential of adult human mesenchymal stem cells. Science. 1999;284(5411):143–147. doi: 10.1126/science.284.5411.143. [DOI] [PubMed] [Google Scholar]
- 35.Wu Y, Zitelli JP, TenHuisen KS, Yu X, Libera MR. Differential response of Staphylococci and osteoblasts to varying titanium surface roughness. Biomaterials. 2011;32(4):951–960. doi: 10.1016/j.biomaterials.2010.10.001. [DOI] [PubMed] [Google Scholar]
- 36.Gittens RA, Olivares-Navarrete R, Schwartz Z, Boyan BD. Implant osseointegration and the role of microroughness and nanostructures: lessons for spine implants. Acta Biomater. 2014;10(8):3363–3371. doi: 10.1016/j.actbio.2014.03.037. [DOI] [PMC free article] [PubMed] [Google Scholar]
- 37.Folkman J, Moscona A. Role of cell shape in growth control. Nature. 1978;273(5661):345–349. doi: 10.1038/273345a0. [DOI] [PubMed] [Google Scholar]
- 38.Ponsonnet L, Reybier K, Jaffrezic N, et al. Relationship between surface properties (roughness, wettability) of titanium and titanium alloys and cell behaviour. Mater Sci Eng C Mater Biol Appl. 2003;23(4):551–560. [Google Scholar]
- 39.Vlacic-Zischke J, Hamlet SM, Friis T, Tonetti MS, Ivanovski S. The influence of surface microroughness and hydrophilicity of titanium on the up-regulation of TGFβ/BMP signalling in osteoblasts. Biomaterials. 2011;32(3):665–671. doi: 10.1016/j.biomaterials.2010.09.025. [DOI] [PubMed] [Google Scholar]
- 40.Dalby MJ, Gadegaard N, Oreffo RO. Harnessing nanotopography and integrin-matrix interactions to influence stem cell fate. Nat Mater. 2014;13(6):558–569. doi: 10.1038/nmat3980. [DOI] [PubMed] [Google Scholar]
- 41.Raines AL, Olivares-Navarrete R, Wieland M, Cochran DL, Schwartz Z, Boyan BD. Regulation of angiogenesis during osseointegration by titanium surface microstructure and energy. Biomaterials. 2010;31(18):4909–4917. doi: 10.1016/j.biomaterials.2010.02.071. [DOI] [PMC free article] [PubMed] [Google Scholar]
- 42.Park J, Bauer S, von der Mark K, Schmuki P. Nanosize and vitality: TiO2 nanotube diameter directs cell fate. Nano Lett. 2007;7(6):1686–1691. doi: 10.1021/nl070678d. [DOI] [PubMed] [Google Scholar]
- 43.Olivares-Navarrete R, Raz P, Zhao G, et al. Integrin alpha2beta1 plays a critical role in osteoblast response to micron-scale surface structure and surface energy of titanium substrates. Proc Natl Acad Sci U S A. 2008;105(41):15767–15772. doi: 10.1073/pnas.0805420105. [DOI] [PMC free article] [PubMed] [Google Scholar]
- 44.Stallard CP, McDonnell KA, Onayemi OD, O’Gara JP, Dowling DP. Evaluation of protein adsorption on atmospheric plasma deposited coatings exhibiting superhydrophilic to superhydrophobic properties. Biointerphases. 2012;7(1–4):31. doi: 10.1007/s13758-012-0031-0. [DOI] [PubMed] [Google Scholar]
- 45.Wei J, Igarashi T, Okumori N, et al. Influence of surface wettability on competitive protein adsorption and initial attachment of osteoblasts. Biomed Mater. 2009;4(4):045002. doi: 10.1088/1748-6041/4/4/045002. [DOI] [PubMed] [Google Scholar]
- 46.Ma R, Tang S, Tan H, et al. Preparation, characterization, in vitro bioactivity, and cellular responses to a polyetheretherketone bioactive composite containing nanocalcium silicate for bone repair. ACS Appl Mater Interfaces. 2014;6(15):12214–12225. doi: 10.1021/am504409q. [DOI] [PubMed] [Google Scholar]
- 47.Sarmento C, Luklinska ZB, Brown L, et al. In vitro behavior of osteoblastic cells cultured in the presence of pseudowollastonite ceramic. J Biomed Mater Res A. 2004;69(2):351–358. doi: 10.1002/jbm.a.30012. [DOI] [PubMed] [Google Scholar]
- 48.Cao L, Wang J, Hou J, Xing W, Liu C. Vascularization and bone regeneration in a critical sized defect using 2-N,6-O-sulfated chitosan nanoparticles incorporating BMP-2. Biomaterials. 2014;35(2):684–698. doi: 10.1016/j.biomaterials.2013.10.005. [DOI] [PubMed] [Google Scholar]
- 49.Taxt-Lamolle SF, Rubert M, Haugen HJ, Lyngstadaas SP, Ellingsen JE, Monjo M. Controlled electro-implementation of fluoride in titanium implant surfaces enhances cortical bone formation and mineralization. Acta Biomater. 2010;6(3):1025–1032. doi: 10.1016/j.actbio.2009.09.014. [DOI] [PubMed] [Google Scholar]
- 50.Simmons CA, Valiquette N, Pilliar RM. Osseointegration of sintered porous-surfaced and plasma spray-coated implants: An animal model study of early postimplantation healing response and mechanical stability. J Biomed Mater Res. 1999;47(2):127–138. doi: 10.1002/(sici)1097-4636(199911)47:2<127::aid-jbm3>3.0.co;2-c. [DOI] [PubMed] [Google Scholar]
Associated Data
This section collects any data citations, data availability statements, or supplementary materials included in this article.
Supplementary Materials
SEM images of different Al2O3 grains used for sandblasting treatment.
Notes: (A) Al2O3 particles with a grain size of 60–80 μm; (B) Al2O3 particles with a grain size of 110–150 μm; (C) Al2O3 particles with a grain size of 180–250 μm.
Abbreviation: SEM, scanning electron microscope.
Energy-dispersive X-ray spectroscopy analysis of the control group, group 1, group 2, and group 3 of the PEEK/n-HA/CF ternary biocomposites.
Notes: (A) Control group; (B) group 1; (C) group 2; and (D) group 3 of the PEEK/n-HA/CF ternary biocomposites.
Abbreviations: At%, atom percentage; PEEK/n-HA/CF, carbon fiber-reinforced polyetheretherketone–nanohydroxyapatite.
Scanning electron microscope images of osteoblast-like cells on the surfaces of the control and group 2 samples cultured for 14 days.
Notes: (A) Control group; (B) group 2.
The number of adherent cells per projected area on the different biocomposite surfaces calculated by immunofluorescence.
Note: *P<0.05 compared to other groups.
Percentage of bone–implant contact for the control and group 2 implants at 8 weeks.
Note: *P<0.05.


