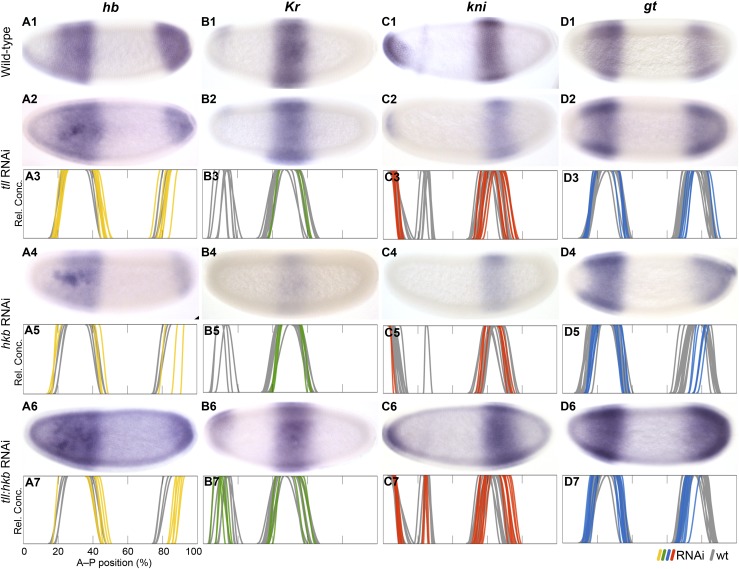
Figure 8. Knock-down of the terminal gap genes.
Columns show the expression of hb (A1–A7; yellow), Kr (B1–B7; green), kni (C1–C7; red), gt (D1–D7; blue) in wild-type embryos (top row; A1, B1, C1, D1), in RNAi-treated embryos as indicated (rows 2, 4, and 6; A–D), and as summary graphs comparing wild-type boundary positions (grey) to boundary positions affected by RNAi (coloured lines) (rows 3, 5, and 7; A–D). All embryos are at time class T4. Embryo images show lateral views: anterior is to the left, dorsal is up.

