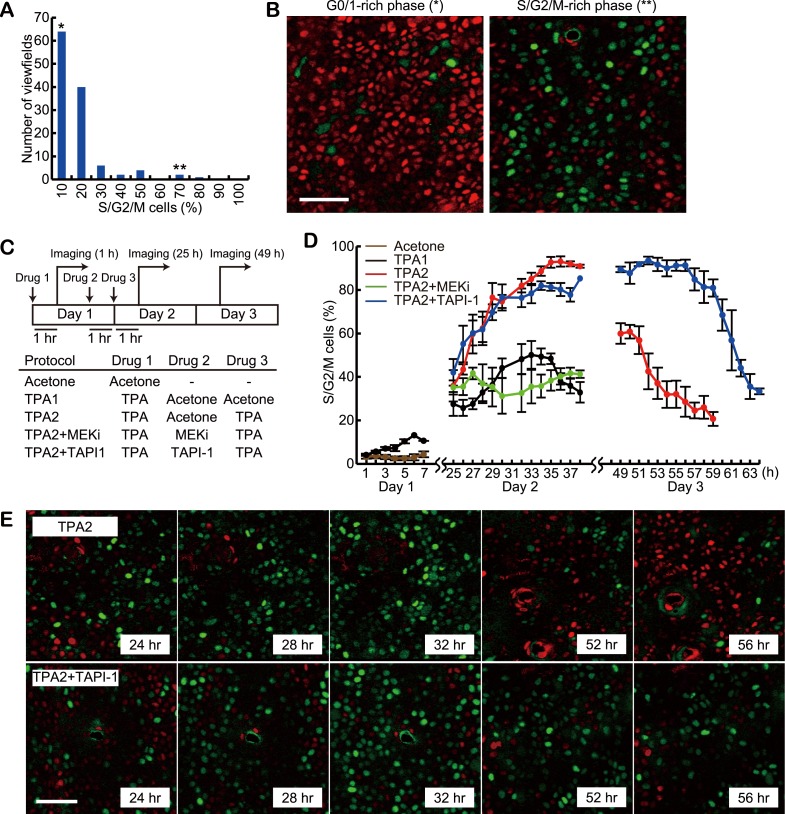
Figure 6. Delayed exit from S/G2/M phase by MMP inhibitor treatment.
(A) Histogram of the percentage of S/G2/M cells in 120 viewfields (0.213 mm2 each) of steady-state Fucci mice. About 700 cells were analysed for each viewfield. (B) Representative images of viewfields, where S/G2/M cells (green) were less than 10% (left, indicated by * in [A]) or more than 50% (right, indicated by ** in [A]). Red and green cells indicate G0/G1 and S/G2/M cells, respectively. Scale bar, 50 μm. (C) Protocols of double TPA treatments with or without inhibitors. Drugs were applied in the following concentrations: 0.5 nanomole TPA, 207 nanomole PD0329105, 2.0 nanomole TAPI-1, and 0.2 nanomole PD153035 in 20 μl acetone, or vehicle alone. For each protocol, at least three mice were observed. Images were acquired every 1 hr during 7- to 16-hr-imaging periods. Mice were returned to the cage after the imaging and the same area of the skin was revisited on the next day. (D) The proportion of S/G2/M cells. Average and S.E.M. are shown. At least three mice were used for each drug protocol. (E) Representative time lapse images of protocol TPA2 and TPA2 + TAPI-1. Note that the fraction of S/G2/M cells (green) was maintained at high level by TAPI-1 treatment (52 hr, 56 hr). Scale bar, 50 μm.

