

Abstract
Biomarkers that can identify tuberculosis (TB) disease and serve as markers for efficient therapy are requested. We have studied T cell cytokine production [interferon (IFN)-γ, interleukin (IL)-2, tumour necrosis factor (TNF)-α] and degranulation (CD107a) as well as subsets of CD4+ T regulatory cells (Tregs) after in-vitro Mycobacterium tuberculosis (Mtb) antigen stimulation [early secretory antigenic target (ESAT)-6, culture filtrate protein (CFP)-10, antigen 85 (Ag85)] in 32 patients with active tuberculosis (TB) disease throughout 24 weeks of effective TB treatment. A significant decline in the fraction of Mtb-specific total IFN-γ and single IFN-γ-producing T cells was already observed after 2 weeks of treatment, whereas the pool of single IL-2+ cells increased over time for both CD4+ and CD8+ T cells. The Treg subsets CD25highCD127low, CD25highCD147++ and CD25highCD127lowCD161+ expanded significantly after Mtb antigen stimulation in vitro at all time-points, whereas the CD25highCD127lowCD39+ Tregs remained unchanged. The fraction of CD25highCD127low Tregs increased after 8 weeks of treatment. Thus, we revealed an opposing shift of Tregs and intracellular cytokine production during treatment. This may indicate that functional signatures of the CD4+ and CD8+ T cells can serve as immunological correlates of early curative host responses. Whether such signatures can be used as biomarkers in monitoring and follow-up of TB treatment needs to be explored further.
Keywords: cytokines, T cells, treatment, Tregs, tuberculosis
Introduction
Mycobacterium tuberculosis (Mtb), the causative agent of tuberculosis (TB), kills nearly 2 million people annually and is still a major health threat 1. As total TB cases seem to decrease slightly, the development of multi-drug resistant (MDR) TB is of increasing concern 1. The diagnosis and treatment of active TB relies on the identification of Mtb by culture and resistance testing to enable the accurate choice of chemotherapy. However, surrogate biomarkers for bacterial clearance are needed for evaluation of treatment efficacy and as readouts in clinical trials evaluating new TB treatment modalities 2. Biomarkers are especially important in the combat against MDR TB where prolonged duration of therapy with inefficient, toxic and expensive drugs is a major threat to TB cure 3.
The host defence against Mtb depends upon effective innate and adaptive immune responses that suppress, but generally fail to eradicate, the infection 4. Evidence from both human and animal models suggests that CD4+ and CD8+ T cells play an important role in the protective immune responses against Mtb, where CD4+ T helper type 1 (Th1) cells are of crucial importance 5. The induction of protective interferon (IFN)-γ+ T cell responses is interleukin (IL)-12-dependent, which is secreted mainly by activated dendritic cells and macrophages 6. IFN-γ provides a strong effector response to Mtb, but tumour necrosis factor (TNF)-α is also essential to control disease progression, demonstrated by the reactivation of TB in patients given anti-TNF-α treatment 7. Polyfunctional CD4+ T cells (co-producing IFN-γ, TNF-α and IL-2) have been reported to serve as correlates of protective immunity in vaccination studies 8,9. Harari et al. observed a shift from monofunctional to polyfunctional CD4+ T cells in a small cohort of five patients during effective TB treatment 10, while others have shown that polyfunctional T cells correlate with active Mtb disease 11,12. Thus, the role of polyfunctional T cells in TB still needs to be clarified.
T cell immunity contains Mtb infection in vivo, but may also cause inflammatory damage to the host. Regulatory T cells (Tregs) serve a pivotal role in controlling immune responses by preventing tissue damage due to excessive inflammation, but immune suppression may also prevent microbial eradication and facilitate chronic infection 13. There seems to be a correlation between the severity of TB infection and Tregs, as studies have reported higher levels of circulating Tregs in patients with active TB than in subjects with latent TB infection 14–16. The dynamics of Tregs during treatment of active TB is still not clarified, although reduced numbers during treatment have been described 17.
In this longitudinal prospective study we show that Mtb-specific IFN-γ-producing T cells already decline in TB patients during efficient TB treatment after 2 weeks, whereas the contribution of single IL-2+ cells to the cytokine-producing T cell pool increases over time. We present data of exploratory Treg subsets and demonstrate that Mtb-specific Treg responses are maintained in TB disease and a transient increase in ex-vivo Treg levels occurs during therapy. Thus, these data on the dynamics of Tregs and intracellular cytokine patterns may contribute to a better understanding of the role of regulatory mechanisms in TB infection and motivate further studies of biomarkers for treatment responses.
Material and methods
Study participants
Patients with active TB infection were included prospectively at the department of Infectious Diseases, Oslo University Hospital, Norway and followed longitudinally during 24 weeks of standard TB drug combination chemotherapy (Table 1). All subjects had drug-sensitive TB and were HIV-uninfected. Patients with TB disease were categorized into pulmonary TB (PTB) or extrapulmonary TB (EPTB) and in ‘low symptom score’ defined as either asymptomatic (detected by screening) or with only one of the following symptoms: fever >38°C, weight loss, wasting, cough or night-sweat. Patients with two or more symptoms were categorized into the ‘high symptom score’ group. Blood samples were obtained before treatment and after 2, 8 and 24 weeks of treatment. The study was approved by the Regional Ethics Committee and written informed consent was obtained from all participants.
Table 1.
Patient characteristics
| Cytokine (n = 20) | Treg (n = 12) | |
|---|---|---|
| Median age in years (range) | 29 (21–79) | 26 (21–72) |
| Female (% of total) | 12 (60) | 6 (50) |
| Origin (% of total) | ||
| Africa | 9 (45) | 5 (42) |
| Asia | 7 (35) | 4 (33) |
| Europe | 4 (20) | 3 (25) |
| Localization | ||
| Pulmonary | 12 (60) | 6 (50) |
| Extrapulmonary* | 8 (40) | 6 (50) |
| IGRA assay† (positive : negative : no data) | 14 : 0:6 | 10 : 1 : 1 |
| ESR‡ | 42 (22–101) | 33 (7–92) |
| Low : high symptom score§ | 5 : 15 | 6 : 6 |
*Lymph node, pericard, abdominal, cutaneous abscess, osteomyelitis. †QuantiFERON®-TB. ‡Erythrocyte sedimentation rate (ESR). §High ≥2 of the following symptoms: fever (>38C°), weight loss, wasting, cough and night-sweat. Low = 1 symptom or asymptomatic/detected by screening. Treg = regulatory T cell; IGRA = interferon-γ-release assay.
Cell separation and preparation
Peripheral blood mononuclear cells (PBMC) were isolated in cell preparation tubes [CPT; Becton Dickinson (BD) Bioscience, San Jose, CA, USA] with sodium heparin, and analysed immediately or cryopreserved in 90% fetal calf serum (FCS; Sigma, St Louis, MO, USA)/10% dimethylsulphoxide (DMSO) and stored at −145°C until analysis. Frozen PBMC from 20 patients was used for the cytokine analysis and fresh PBMC from 12 patients for the Treg analysis.
Antigens
Mtb-derived 10-kDa culture filtrate protein (CFP-10), 6 kDa early secretory antigenic target (ESAT-6) (both 15mer overlapping peptide pools, >80% purity; Schäfer, Hadsund, Denmark) and antigen 85 (Ag85) complex (15mer overlapping peptide, >85% purity; Genscript, Herlev, Denmark) were used alone or in combination at a final concentration of 1–1·5 μg/ml. Staphylococcal enterotoxin B (SEB), 0·5 μg/ml; Sigma-Aldrich, St Louis, MO, USA) was used as positive control.
Flow cytometric analysis
Intracellular cytokine analysis and CD107a expression
Antigen-specific responses were measured in peptide-stimulated thawed PBMC after overnight resting; 7·5 × 105 cells/well were stimulated in sterile conditions with peptide pools; ESAT-6/CFP-10 (E6C10) or Ag85, SEB or serum-free medium (AIM V; Gibco Invitrogen, Carlsbad, CA, USA) with 0·1% highly purified human albumin in short-term (6 h) cultures. Only PBMC with viability >85% were included. Brefeldin A (BD Bioscience) (final concentration 5 μg/ml) and monensin (BD Bioscience) (final concentration 5 μg/ml) were added at the time of stimulation with anti-CD107a 18,19. After 8 h rest at 4°C, cells were washed and stained with live/dead discriminator in azide-free and serum/protein-free phosphate-buffered saline (PBS) followed by CD4 and CD3 staining. PBMC were then washed, permeabilized (Cytofix-Cytoperm kit; BD Bioscience) according to the manufacturer's instructions and stained for intracellular cytokines (IFN-γ, TNF-α and IL-2). The following directly conjugated monoclonal antibodies were used: anti-CD3-peridinin chlorophyll (PerCP)-cyanin 5·5 (Cy5·5), anti-CD4-V500, anti-TNF-α-phycoerythrin (PE), anti-IFN-γ-PE-Cy7, anti-IL-2-allophycocyanin (APC), anti-CD107a-fluorescein isothiocyanate (FITC) (BD Bioscience) and live/dead discriminator Fixable Viability Dye eFluor® 450 (eBioscience, San Diego, CA, USA).
Tregs analysis
Freshly isolated PBMC at 5 × 10⁵ cells/well were stimulated with anti-CD28 (0·5 ug/ml), peptide pools (ESAT-6, CFP-10, ESAT-6/CFP-10 (E6C10) or AIM alone for 6 hours at 37°C in 5% CO2 incubator. Cells were harvested after 14–18 h rest at 4°C, erythrocyte lysed, and then surface-stained in the dark. The following directly conjugated monoclonal antibodies were used: anti-CD3-Pacific Blue, anti-CD4-AmCyan, anti-CD25-Per-CP-Cy5·5, anti-CD161-PE, anti-CD39-APC, anti-CD147-FITC (BD Bioscience) and anti-CD127 PE-Cy7 (eBioscience).
Flow cytometry analyses
Flow cytometric acquisition was performed on a BD FACS Canto II. At least 10 000 CD4+T and CD8+ cells were analysed for the cytokine analysis; gating and analysis were made with FACS Diva software version 6 (BD Bioscience) or FlowJo version 10 (TreeStar Inc, Ashland, OR, USA). Dead cells were excluded from the lymphocyte population before gating on CD4+ and CD8+ cytokine-producing populations (Supporting information, Fig. S1). Frequencies (percentage of parent population) of Mtb antigen-stimulated cytokine-producing T cells were obtained after subtracting background values (as determined by the unstimulated control cultures). A cut-off of 0·01% was used and values below this were set to zero in accordance with other studies 20. Total IFN-γ+, IL-2 + or TNF-α+ describe all CD4+ or CD8+ cells positive for the cytokine measured, while Boolean gating strategy was used to create cytokine combinations defined as: polyfunctional (IFN-γ+ IL-2+ TNF-α+), double-positive (IFN-γ+ IL-2+ or IL-2+ TNF-α+ or IFN-γ+ TNF-α+) and single-positive (IFN-γ+ or IL-2+ or TNF-α+)-producing CD4+ and CD8+ T cells. Different Treg subsets were defined as CD3+CD4+CD25highCD127low 21, CD4+CD25highCD127lowCD161+, CD4+CD25highCD127lowCD39+ and CD4+CD25highCD147++.
Statistics
Statistical analyses were performed by using Statistica version 7·0 (Statsoft, Tulsa, OK, USA). Non-parametric statistical methods were applied. The Mann–Whitney U-test was applied for groupwise comparison, and the two-tailed Wilcoxon's matched-pair test was used for dependent variables. Fisher's exact test (2 × 2) was used for analysis of categorical variables. A significance level of 0·05 was used. All values are presented as median and interquartile range (IQR). Graphic presentations were made using Prism version 5·04 and version 6 software (GraphPad, San Diego, CA, USA).
Results
Study participants
Thirty-two HIV-uninfected patients with culture-confirmed fully susceptible TB were followed longitudinally during 24 weeks of standard anti-TB drug chemotherapy. Demographic and clinical characteristics are summarized in Table 1. There were 18 PTB and 14 EPTB cases. Eleven patients were classified into the ‘low symptom score’ group (≤1 symptom) and 21 patients into the ‘high symptom score’ group (≥2 symptoms). A total of 78% of the PTB cases and 50% of the EPTB cases were classified in the ‘high symptom score’ group (P > 0·05). All patients responded to treatment, PTB patients with sputum conversion and culture clearing, whereas EPTB patients demonstrated clinical improvement and normalization of inflammation parameters (ESR).
Dynamics of cytokine responses in active TB infection during TB therapy
We analysed changes of total and various combinations of CD4+ and CD8+ T cell cytokine production after in-vitro Mtb antigen stimulation [ESAT-6/CFP-10 (E6C10) and Ag85] during 24 weeks of effective TB treatment. At baseline, the majority of the patients had responses above cut-off for the different cytokine combinations (Supporting information, Fig. S2). Total IFN-γ, IL-2 and TNF-α responses were detected in 70–80%, 50–60% and 50–60% of the patients for the CD4+ T cell subset and in 65–70%, 45% and 50–65% for the CD8+ T cell subset, dependent on the antigen, while IFN-γ+ IL-2+ T cells were detected in only a few patients at baseline with levels just above cut-off.
TB antigen-specific CD4+ T cell cytokine responses
Within the CD4+ T cell subset, the fraction of total IFN-γ-producing cells declined from baseline to week 2 (Ag85; P = 0·013) and week 8 (E6C10; P = 0·004) (Fig. 1a,b). A corresponding decline was seen for the single IFN-γ-producing cells from baseline to week 2 (E6C10; P = 0·047 and Ag85; P = 0·013) and week 8 (E6C10; P = 0·033) (Fig. 2a,b). An initial reduction, although not significant, was also seen for total IL-2 and TNF-α-producing CD4+ T cells. This was followed by increased responses towards week 24 for all cytokines, although only significant for total IFN-γ after Ag85 stimulation (P = 0·043) (Fig. 1a,b). Similar changes were found for the CD4+ IFN-γ+ TNF-α + T cells, which first decreased at week 2 followed by a significant increase between weeks 2 and 24 (Ag85; P = 0·037) (Fig. 2b). In contrast, no significant changes were observed for the CD4+ TNF-α+ IL-2+ T cells. Polyfunctional (IFN-γ+ IL-2+ TNF-α+) CD4+ T cell responses were detected in 70% (E6C10) and 45% (Ag85) of the patients at baseline, but in only 60% and 35%, respectively, after 24 weeks (Supporting information, Fig. S2a,b). Further, there were no significant changes observed in the fractions of polyfunctional CD4+ T cells during treatment (Fig. 2a).
Fig 1.

Total Mycobacterium tuberculosis (Mtb) antigen-specific interferon (IFN)-γ+, interleukin (IL)-2+ or tumour necrosis factor (TNF)-α+ T cell responses at different time-points of tuberculosis (TB) treatment: baseline (n = 20), week 2 (n = 11), week 8 (n = 18), week 24 (n = 20). (a) Early secretory antigenic target (ESAT)-6/culture filtrate protein (CFP)-10 (E6C10)-stimulated CD4+ T cells. (b) Antigen 85 (Ag85)-stimulated CD4+ T cells. (c) E6C10-stimulated CD8+ T cells. (d) Ag85-stimulated CD8+ T cells. P-values calculated by Wilcoxon's matched-pairs test. Plots are shown with median, interquartile range (IQR) and minimum/maximum values.
Fig 2.

Mycobacterium tuberculosis (Mtb) antigen-specific cytokine T cell subsets at different time-points of tuberculosis (TB) treatment: baseline (n = 20), week 2 (n = 11), week 8 (n = 18), week 24 (n = 20). Boolean gating strategy was used to create cytokine combinations of single-producing, duo-producing and polyfunctional T cells. (a) Early secretory antigenic target (ESAT)-6/culture filtrate protein (CFP)-10 (E6C10)-stimulated CD4+ T cells. (b) Antigen 85 (Ag85)-stimulated CD4+ T cells. (c) E6C10 stimulated CD8+ T cells. (d) Ag85-stimulated CD8+ T cells. P-values calculated by Wilcoxon's matched-pairs test. Plots are shown with median, interquartile range (IQR) and minimum/maximum values.
TB antigen-specific CD8+ T cell cytokine responses
CD8+ T cell cytokine responses also decreased after 2 weeks of treatment followed by an increase at week 24, although these findings were not consistent for all combinations of cytokines. The fraction of total IFN-γ-producing CD8+ T cells decreased significantly from baseline to week 2 (E6C10; P = 0·028) and week 8 (E6C10; P = 0·031) (Fig. 1c) and single IFN-γ-producing cells was also reduced at week 2 (E6C10; P = 0·028) (Fig. 2c). We observed a corresponding decline for the total TNF-α-producing CD8+ T cells from baseline to week 2 (E6C10; P = 0·049), whereas for the total IL-2-producing CD8+ T cells the reduction was not significant (Fig. 1c). Similarly, the CD8+ IFN-γ+ TNF-α+ T cells decreased from baseline to weeks 2 and 24 (E6C10; P = 0·035 and P = 0·025) (Fig. 2c). As observed in the CD4+ population, single IL-2-producing CD8+ T cells showed a significant increase from weeks 2 to 24 (E6C10; P = 0·046) (Fig. 2c). Polyfunctional CD8+ T cell responses were detected only in 65% (E6C10) and 25% (Ag85) of the patients at baseline, and even fewer patients elicited a polyfunctional response after 24 weeks of treatment (45% for E6C10 and 10% for Ag85) (Supporting information, Fig. S2c,d). In patients with detectable responses, the fraction of polyfunctional CD8+ T cells declined from baseline to weeks 8 (E6C10; P = 0·027) and 24 (Ag85; P = 0·043) (Fig. 2c,d).
Degranulating CD107a+ T cells
Analyses were also performed to explore changes of degranulating CD107a+ T cells in response to TB therapy. In both CD4+ and CD8+ T cells, a down-regulation of CD107a after 2 weeks of treatment followed by an increase towards week 24 was observed, although not significant (data not shown).
Dynamics in cytokine patterns
We then compared the contribution of the various cytokine combinations to the overall pool of cytokine-producing T cells during the treatment period (Fig. 3). The majority of CD4+ and CD8+ T cells were single-cytokine producers at all time-points, while the fraction of polyfunctional T cells was low. However, we detected an increased contribution of polyfunctional and duo-cytokine-producing T cells at week 2 followed by a decrease at week 24, while an opposite pattern was observed for single-cytokine-producing T cells, most evident in the E6C10-stimulated cells.
Fig 3.

Piecharts representing percentages of the various cytokine combinations to the overall pool of cytokine producing CD4+ and CD8+ T cells at different time-points during treatment: week 0 (n = 20), week 2 (n = 11), week 8 (n = 18) and week 24 (n = 20). (a) Early secretory antigenic target (ESAT)-6/culture filtrate protein (CFP)-10 (E6C10)-stimulated CD4+ T cells. (b) Antigen 85 (Ag85)-stimulated CD4+ T cells. (c) E6C10-stimulated CD8+ T cells. (d) Ag85-stimulated CD8+ T cells.
Among the single-cytokine-producing CD4+ T cells, the TNF-α+ subset and, to a lesser extent, the IFN-γ+ cells, dominated. This was consistent over time, but there was a decrease in TNF-α+ cells throughout therapy (Fig. 3b). In contrast, the proportion of the single IL-2+ cells, although less dominant at baseline, increased towards week 24 for both Mtb antigens (Fig. 3a,b). The opposite was seen for the TNF-α+ IL-2+ cells, indicating a shift from duo to single IL-2-producing cells.
In the CD8+ T cell population, the single IFN-γ+ cells contributed as much as the TNF-α+ subset (Fig. 3c,d). Throughout the treatment period the most prominent finding was a decline in single producing TNF-α+ cells, while IL-2+ cells increased correspondingly. The single IFN-γ+ cells were reduced at week 2 followed by an increase at week 24, in contrast to the IFN-γ+ TNF-α+ subset that increased initially followed by a decline at week 24, most noticeable for E6C10-stimulated cells for both cytokine populations (Fig. 3c).
Cytokine profiles related to symptoms and localization of disease during TB therapy
We studied T cell responses after in-vitro Mtb stimulation in patients with EPTB compared to PTB and found a tendency of overall higher levels of cytokine production in the EPTB group compared to the PTB group both at baseline and during therapy, but only significant, however, for polyfunctional CD4+ T cells (E6C10, week 24, P = 0·031) (Supporting information, Fig. S3).
In the CD8+ T cell population, we found significant higher levels of both total and single IL-2-producing cells in the EPTB group compared to the PTB group at baseline (E6C10; P = 0·034 and P = 0·011, respectively). Further, single IL-2-producing CD8+ T cells increased significantly (E6C10; P = 0·004) after 8 weeks of therapy in the EPTB group (data not shown).
We did not detect any significant differences between the ‘low symptom score’ and ‘high symptom score’ groups, either at baseline or during therapy (data not shown). However, within the group with ‘high symptom score’ the frequencies of total IFN-γ- and total IL-2-producing cells decreased from baseline to week 2 for both the CD4+ T cells (Ag85; P = 0·015 and P = 0·027, respectively) and the CD8+ T cells (E6C10; P = 0·035 and Ag85; P = 0·043, respectively). These changes were not seen for the ‘low symptom score’ group.
CD25highCD127low Tregs and explorative Treg subsets during TB therapy
Tregs were analysed in fresh PBMC from 12 TB patients before and after 8 and 24 weeks of therapy. The fraction of CD4+CD25highCD127low Tregs increased significantly after in-vitro Mtb antigen stimulation throughout the whole observation period (Fig. 4a). Further, there was a significant increase of CD4+CD25highCD127low Tregs from baseline to week 8 in both unstimulated [7·1% (5·4–8·3) versus 8·2% (7–10·6), P = 0·032] (Fig. 4a) and Mtb antigen-stimulated [CFP-10; 10·9% (8·1–16·4) versus 12·1% (9·2–16·6), P = 0·039] CD4+ T cells with high levels even after 24 weeks of treatment.
Fig 4.
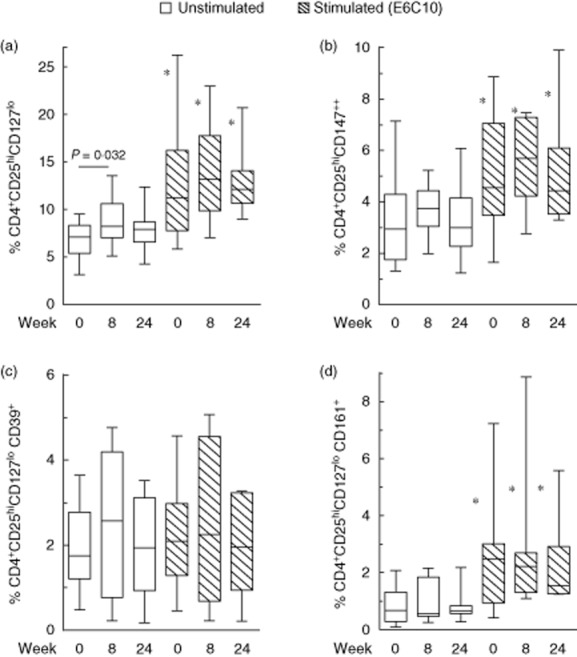
The fraction of regulatory T cell (Treg) subsets in tuberculosis (TB) patients before (n = 12) and after 8 (n = 11) and 24 weeks (n = 11) of TB treatment in unstimulated (white bars) and early secretory antigenic target (ESAT)-6/culture filtrate protein (CFP)-10 (E6C10)-stimulated peripheral blood mononuclear cells (PBMC) (hatched bars). (a) CD4+CD25hiCD127low, (b) CD4+CD25hiCD127lowCD147++, (c) CD4+CD25hiCD127lowCD39+ and (d) CD4+CD25hiCD127lowCD161+. *Significant changes (P < 0·005) between unstimulated and E6C10-stimulated samples at corresponding time-points. P-values calculated by Wilcoxon's matched-pairs test. Plots are shown with median, interquartile range (IQR) and minimum/maximum values.
We further analysed the dynamics of different explorative Treg markers throughout therapy. CD147 has been suggested as a marker of activated and highly suppressive Tregs 22. Before therapy, 2·9% (1·7–4·3) of the CD4+ cells were CD25highCD147++ (Fig. 4b). We observed similar trends as described for the CD4+CD25highCD127low population, with higher levels of CD4+CD25highCD147++ T cells after in-vitro Mtb antigen stimulation. An increase at week 8 followed by a slight decrease towards week 24 was also seen for both unstimulated and Mtb peptide-stimulated Tregs expressing CD147, although not significantly. CD161 characterizing a suppressive subpopulation of Tregs that produces IL-17 23 was expressed on 8·6% (2·6–16·4) of the CD4+CD25highCD127low T cells at baseline, and this Treg subset constituted 0·7% (0·3–1·3) of the CD4+ T cells (Fig. 4d). CD161 expression also became significantly up-regulated after in-vitro Mtb antigen stimulation, but no significant changes were detected during treatment. Finally CD39, an ectoenzyme associated specifically with Tregs 24, was expressed on 32·6% (5·6–41·2) of the CD25highCD127low Tregs at baseline. The decline in CD39 expression on Tregs in response to Mtb antigen stimulation was compensated for by a corresponding increase in CD39-negative cells (Supporting information, Fig. S1). Thus, 1·7% (1·2–2·7) of the CD4+ cells were CD25highCD127lowCD39+ with no significant changes over time (Fig. 4c).
Dynamics of Tregs related to symptoms and localization of disease during TB therapy
The possible association between CD4+CD25highCD127low Tregs, symptoms and disease localization was also studied. There were no significant differences in ex-vivo Treg levels at baseline between the ‘low symptom score’ and ‘high symptom score’ groups (Fig. 5a). However, in the ‘low symptom score’ group we observed a significant increase in the fraction of Tregs in response to in-vitro Mtb antigen stimulation, both at baseline (E6C10; P = 0·015) and during therapy (E6C10; week 8, P = 0·032; week 24, P = 0·008). A corresponding increase in Tregs was seen in the ‘high symptom score’ group only at the end of treatment (E6C10; week 24, P = 0·026).
Fig 5.

Fraction of regulatory T cells (Tregs) (CD4+CD25hiCD127low) in unstimulated and early secretory antigenic target (ESAT)-6/culture filtrate protein (CFP)-10 (E6C10)-stimulated peripheral blood mononuclear cells (PBMC) during treatment at baseline (week 0), week 8 and week 24 in (a) high (white bars, n = 6) versus low (hatched bars, n = 6) symptom score and (b) pulmonary tuberculosis (PTB) (white bars, n = 6) versus extrapulmonary tuberculosis (EPTB) (dotted bars, n = 6). Plots are shown with median, interquartile range (IQR) and minimum/maximum values. P-values were calculated by Mann–Whitney U-test.
When grouping the patients according to disease localization we found comparable proportions of Tregs in the PTB and EPTB groups (Fig. 5b). The fraction of Tregs increased after in-vitro Mtb peptide stimulation both before and throughout therapy, most pronounced and only significant for the EPTB group (E6C10; baseline P = 0·009 and week 24 P = 0·004).
Discussion
This study presents data on cytokine production, Tregs and cytotoxicity in order to explore kinetics and quantitative changes in TB-specific CD4+ and CD8+ T cell responses in patients with TB disease during effective TB treatment. We document dynamic changes of TB-specific immune activation and T cell regulation in response to treatment.
Reductions in the frequencies of Mtb antigen-specific total and single IFN-γ-producing CD4+ and CD8+ T cells, already significant after 2 weeks, were overall the best markers associated with successful therapy. We found support in both human studies 25–27 and animal TB models 28,29, where reductions in the proinflammatory cytokines IFN-γ and TNF-α were described after few weeks of treatment. Day et al. observed a decline in PPD-specific TNF-α+ and IFN-γ+ single-positive T cells in a cohort of pulmonary TB patients during 6 months of anti-TB treatment with a concomitant increase in the polyfunctional T cells 27. In contrast, Jackson-Sillah et al. showed a significant increase in IFN-γ+ CD4+ T cells in patients with PTB as early as 2 weeks of treatment 30. These conflicting results could be explained by differences in patient populations, choice of stimuli or methods used. Although accumulating studies conclude that the potential role of plasma-based IFN-γ-release assays (IGRAs) for assessment of response to anti-TB therapy is questionable 31, our data highlight that the prognostic potential of cellular IFN-γ measured early after initiation of TB therapy needs to be elucidated further.
We further studied the dynamics of cytokine patterns in response to therapy by analysing the contribution of single-producing, duo-producing and polyfunctional T cells to the total cytokine pool over time. Prior to TB treatment, single TNF-α-producing and, to a lesser extent, single IFN-γ-producing CD4+ T cells dominated, whereas both cell subsets contributed equally to the total pool of CD8+ T cell cytokine-producing cells. These findings are in accordance with studies reporting a predominance of single IFN-γ 32 or single TNF-α production 10,12,33 in CD4+ T cells from patients with active TB compared to latent infection. Elevated levels of CD4+ TNF-α+ IFN-γ+ T cells with an effector memory phenotype have also been described as a feature of active TB disease 12,27,34. In a recent study of TB in HIV-infected patients, CD4+ TNF-α+ IFN-γ+ T cells were associated with active TB, whereas IL-2+ TNF-α+ cells predominated in latent TB 35. However, no differences in cytokine profiles between the groups were observed for the CD8+ T cells. In the current study we observed a moderate decrease in TNF-α+ IFN-γ+ T cells for both the CD4+ and CD8+ subsets in the E6C10-stimulated cells, possibly indicating a decrease in the effector memory T cells in response to TB treatment.
We detected low proportions of single IL-2-producing T cells at baseline with an increase during TB treatment for both T cell subsets. Defective Mtb-specific IL-2 responses seem to have a major role in TB pathogenesis 12,35,36. TB cases have a lower proportion of IL-2-producing T cells compared to household contacts 12. Further, smear-positive TB patients have decreased fractions of IL-2-producing CD4+ T cells when compared with both smear-negative TB and latent TB cases 27. Improved IL-2 production during TB therapy has been suggested to represent central memory T cells persisting after antigen clearance, as Millington et al. observed a shift from co-dominance of single IFN-γ+ and IFN-γ+ IL-2+ T cells to IFN-γ+ IL-2+ and single IL-2+ T cells 37. In our study, however, IFN-γ+ IL-2+ T cell responses were weak and detected in only a few patients throughout treatment. Nevertheless, IFN-γ- and IL-2-producing T cells may have potential as therapy efficacy markers.
Production of multiple cytokines has been associated with protection from disease progression 10. In our study, we observed a modest reduction in the fraction of polyfunctional T cells during therapy, significant only for the CD8+ subset. However, polyfunctional cells contributed significantly less to the overall cytokine pool after therapy both for CD4+ and CD8+ T cells in keeping with previous studies 11,38, and in contrast to studies including only a few cases where polyfunctional cells increased during treatment 10,27. Whether polyfunctional T cells measured in in-vitro Mtb antigen-stimulated cultures represent a population of primed T cells returned to a resting state due to lack of Mtb antigen stimulation in vivo during therapy or, rather, recovery of beneficial Mtb-specific T cell responses, is unknown. Thus, the role of polyfunctional T cells in TB is still unclear 39.
We analysed cytokine production according to TB disease localization and degree of symptoms. In general, T cells from patients with EPTB seemed to be more able to produce all combinations of cytokines compared to PTB both at baseline and during therapy, especially IL-2-producing CD8+ T cells and polyfunctional CD4+ T cells. An inverse correlation has been reported between Mtb load and the levels of both polyfunctional and IL-2-producing T cells 27. Taken together, this may indicate that T cells in PTB with high Mtb load are more anergic, while patients with pauci-bacillary EPTB maintain favourable immune responses. However, cytokine production may also depend upon the degree of systemic inflammation in the individual patient regardless of clinical localization 40. Finally, we found no significant difference in cytokine patterns between patients with high and low symptom scores, possibly explained by the high proportion of patients with symptoms in both groups.
We also analysed the degranulating capacity of T cells by measuring CD107a expression 41. While cytotoxicity and degranulation are related commonly to CD8+ T cells, cytotoxic CD4+ cells may also play a role in TB immunity 42,43. In our study there was a tendency of decreased CD107a expression in both CD4+ and CD8+ cells during the first 2 weeks followed by an increase towards the end of treatment. Young et al. found higher expression of CD107a in both T cell subsets pretreatment compared with after TB therapy 38, whereas Mueller et al. detected long-lived granulysin-expressing CD4+ T cells in patients with treated TB 43. Thus, the role of cytotoxic and degranulating T cells as a correlate of protection in TB is still unclear.
CD4+ regulatory T cells suppress TB antigen-specific Th1 cell responses 14,44,45. Expansion of Tregs has been observed both at organ-specific sites 16,46 and in blood in active TB 47. In our TB cohort the fraction of CD25highCD127low Tregs increased in response to in-vitro Mtb antigen stimulation both before and during therapy. However, the transient increase in Tregs observed in both unstimulated and Mtb antigen-stimulated CD4+ cells after 8 weeks of TB treatment has not, to our knowledge, been described previously. In contrast, decreasing levels of Tregs have been reported in response to TB treatment 17,30. However, high Treg levels are also seen in previously treated EPTB 48 and in response to preventive treatment for latent TB 15. We could not confirm previous reports demonstrating higher ex-vivo levels of Tregs in extrapulmonary compared to pulmonary disease 16,48. Nevertheless, after in-vitro Mtb antigen stimulation the increase in Tregs was most pronounced in the groups with EPTB or ‘low-symptom score’ throughout the whole observation period. Thus, preactivated Mtb-specific effector T cells seem to have a greater capacity to induce Tregs at local sites of infection in these patient groups 49. Whether increased Tregs seen in EPTB could predispose to further bacillary dissemination is still unknown.
Interestingly, we document for the first time in TB disease a similar response pattern as seen for the CD25highCD127low Tregs both in the CD147++ Treg subset, a recently described highly suppressive and activated subset of human Tregs 22, and in the CD161+ Treg subset, capable of producing proinflammatory cytokines 23. Finally, CD39 is also suggested as a marker for Treg identification 50. Chiacchio et al. showed that the fraction of CD39+ Tregs in active TB increased after in-vitro stimulation and that depletion of CD39 improved TB-specific responses 24. In our cohort, although a decline in CD39 expression after Mtb antigen stimulation was seen, the CD39+ Treg levels did not change throughout therapy due to a corresponding increase in CD39 negative Tregs. Whether this reflects a beneficial qualitative shift in Treg subsets supporting TB immunity remains to be established.
Taken together, our study revealed an opposing shift in the dynamics of Tregs and in-vitro Mtb-specific T cell responses during treatment, an initial transient increase of Tregs followed by a decrease towards baseline levels at week 24, while the majority of cytokine combinations decreased during the first part and then increased at the end of treatment. Reduced T cell effector cytokine production and an early and transient redistribution of redundant Tregs to peripheral blood from local sites of infection in response to reduced Mtb load and inflammation during TB therapy could explain our data. In support, an animal model shows that the initial Mtb-induced inflammatory response promotes proliferation of short-lived pathogen-specific Tregs from the pre-existing pool of thymus-derived Treg cells 51. After the first intensive phase of Mtb killing, a more functional immune response with single IL-2-producing cells is established. Thus, our data support a transient change in dynamics of regulatory immune mechanisms after initiation of treatment with a subsequent restoration of immune homeostasis 52.
We acknowledge the limitation of exploring Treg and cytokine responses in peripheral blood, as TB is normally a localized and organ-specific disease. However, both human studies 53,54 and mouse models 51 suggest that effector T cells found in peripheral blood are capable of migrating to sites of active TB infection. Thus, changes in blood may mirror local immunity and blood is a relevant compartment for biomarkers.
In conclusion, the initial reduction of Mtb antigen-specific IFN-γ+ T cells with a gradual increase in single IL-2+ cells were the strongest indicators of successful TB treatment and may have potential as biomarkers of treatment efficacy. Our results provide evidence for a more dynamic shift of cytokine patterns and Tregs than reported previously. Future longitudinal studies may provide further insight into the dynamics of immune responses and regulation during TB treatment.
Acknowledgments
We would like to thank all study participants, the staff at the Department of Infectious diseases, Oslo University Hospital and in particular Mette Sannes, Helene Gjelsås and Linda Gail Skeie for assistance during our study. The study was funded by the University of Oslo and Oslo University Hospital. The authors also gratefully acknowledge funding by the ‘Blakstad and Maarschalk Tuberkulosefond’.
Disclosure
The authors declare no financial or commercial conflicts of interest.
Author contributions
S. F., K. T., A. M. D. R. and D. K. conceived and designed the experiments; S. F. and K. T. recruited the patients and performed the experiments; S. F., K. T. and A. M. D. R. analysed the data; S. F, K. T., A. M. D. R. and D. K. contributed reagents/materials/analysis tools; S. F., K. T., A. M. D. R. and D. K. drafted and reviewed the manuscript.
Supporting Information
Additional Supportingporting information may be found in the online version of this article at the publisher's web-site:
Fig. S1. Flow cytometry gating strategy on CD4+ and CD8+ T cells and subpopulations.
Fig. S2. Overview tuberculosis (TB)-specific T cell responses in TB patients.
Fig. S3. Comparisons of cytokine responses in pulmonary and extrapulmonary tuberculosis (TB) during TB therapy.
References
- World Health Organization (WHO) 2013. Global Tuberculosis Report . Geneva: WHO; WHO/HTM/TB/2013.13.
- Wallis RS, Kim P, Cole S, et al. Tuberculosis biomarkers discovery: developments, needs, and challenges. Lancet Infect Dis. 2013;13:362–372. doi: 10.1016/S1473-3099(13)70034-3. [DOI] [PubMed] [Google Scholar]
- Gandhi NR, Nunn P, Dheda K, et al. Multidrug-resistant and extensively drug-resistant tuberculosis: a threat to global control of tuberculosis. Lancet. 2010;375:1830–1843. doi: 10.1016/S0140-6736(10)60410-2. [DOI] [PubMed] [Google Scholar]
- Dheda K, Schwander SK, Zhu B, Van Zyl-Smit RN, Zhang Y. The immunology of tuberculosis: from bench to bedside. Respirology. 2010;15:433–450. doi: 10.1111/j.1440-1843.2010.01739.x. [DOI] [PMC free article] [PubMed] [Google Scholar]
- O'Garra A, Redford PS, McNab FW, Bloom CI, Wilkinson RJ, Berry MP. The immune response in tuberculosis. Annu Rev Immunol. 2013;31:475–527. doi: 10.1146/annurev-immunol-032712-095939. [DOI] [PubMed] [Google Scholar]
- Flynn JL, Chan J. Immunology of tuberculosis. Annu Rev Immunol. 2001;19:93–129. doi: 10.1146/annurev.immunol.19.1.93. [DOI] [PubMed] [Google Scholar]
- Harris J, Keane J. How tumour necrosis factor blockers interfere with tuberculosis immunity. Clin Exp Immunol. 2010;161:1–9. doi: 10.1111/j.1365-2249.2010.04146.x. [DOI] [PMC free article] [PubMed] [Google Scholar]
- Lindenstrom T, Agger EM, Korsholm KS, et al. Tuberculosis subunit vaccination provides long-term protective immunity characterized by multifunctional CD4 memory T cells. J Immunol. 2009;182:8047–8055. doi: 10.4049/jimmunol.0801592. [DOI] [PubMed] [Google Scholar]
- Scriba TJ, Tameris M, Mansoor N, et al. Modified vaccinia Ankara-expressing Ag85A, a novel tuberculosis vaccine, is safe in adolescents and children, and induces polyfunctional CD4+ T cells. Eur J Immunol. 2010;40:279–290. doi: 10.1002/eji.200939754. [DOI] [PMC free article] [PubMed] [Google Scholar]
- Harari A, Rozot V, Enders FB, et al. Dominant TNF-alpha+ Mycobacterium tuberculosis-specific CD4+ T cell responses discriminate between latent infection and active disease. Nat Med. 2011;17:372–376. doi: 10.1038/nm.2299. [DOI] [PMC free article] [PubMed] [Google Scholar]
- Caccamo N, Guggino G, Joosten SA, et al. Multifunctional CD4(+) T cells correlate with active Mycobacterium tuberculosis infection. Eur J Immunol. 2010;40:2211–2220. doi: 10.1002/eji.201040455. [DOI] [PubMed] [Google Scholar]
- Sutherland JS, Adetifa IM, Hill PC, Adegbola RA, Ota MO. Pattern and diversity of cytokine production differentiates between Mycobacterium tuberculosis infection and disease. Eur J Immunol. 2009;39:723–729. doi: 10.1002/eji.200838693. [DOI] [PubMed] [Google Scholar]
- Larson RP, Shafiani S, Urdahl KB. Foxp3(+) regulatory T cells in tuberculosis. Adv Exp Med Biol. 2013;783:165–180. doi: 10.1007/978-1-4614-6111-1_9. [DOI] [PubMed] [Google Scholar]
- Hougardy JM, Place S, Hildebrand M, et al. Regulatory T cells depress immune responses to protective antigens in active tuberculosis. Am J Respir Crit Care Med. 2007;176:409–416. doi: 10.1164/rccm.200701-084OC. [DOI] [PubMed] [Google Scholar]
- Wergeland I, Assmus J, Dyrhol-Riise AM. T regulatory cells and immune activation in Mycobacterium tuberculosis infection and the effect of preventive therapy. Scand J Immunol. 2011;73:234–242. doi: 10.1111/j.1365-3083.2010.02496.x. [DOI] [PubMed] [Google Scholar]
- Guyot-Revol V, Innes JA, Hackforth S, Hinks T, Lalvani A. Regulatory T cells are expanded in blood and disease sites in patients with tuberculosis. Am J Respir Crit Care Med. 2006;173:803–810. doi: 10.1164/rccm.200508-1294OC. [DOI] [PubMed] [Google Scholar]
- He XY, Xiao L, Chen HB, et al. T regulatory cells and Th1/Th2 cytokines in peripheral blood from tuberculosis patients. Eur J Clin Microbiol Infect Dis. 2010;29:643–650. doi: 10.1007/s10096-010-0908-0. [DOI] [PubMed] [Google Scholar]
- Lamoreaux L, Roederer M, Koup R. Intracellular cytokine optimization and standard operating procedure. Nat Protoc. 2006;1:1507–1516. doi: 10.1038/nprot.2006.268. [DOI] [PubMed] [Google Scholar]
- Lovelace P, Maecker H. Multiparameter intracellular cytokine staining. In: Hawley TS, Hawley RG, editors. Flow cytometry protocols. New York: Humana Press; 2011. pp. 165–178. [Google Scholar]
- Roederer M, Nozzi JL, Nason MC. SPICE: exploration and analysis of post-cytometric complex multivariate datasets. Cytometry A. 2011;79A:167–174. doi: 10.1002/cyto.a.21015. [DOI] [PMC free article] [PubMed] [Google Scholar]
- Liu W, Putnam AL, Xu-Yu Z, et al. CD127 expression inversely correlates with FoxP3 and suppressive function of human CD4+ Treg cells. J Exp Med. 2006;203:1701–1711. doi: 10.1084/jem.20060772. [DOI] [PMC free article] [PubMed] [Google Scholar]
- Solstad T. CD147 (Basigin/Emmprin) identifies FoxP3+CD45RO+CTLA4+-activated human regulatory T cells. Blood. 2011;118:5141–5151. doi: 10.1182/blood-2011-02-339242. [DOI] [PubMed] [Google Scholar]
- Pesenacker AM, Bending D, Ursu S, Wu Q, Nistala K, Wedderburn LR. CD161 defines the subset of FoxP3+ T cells capable of producing proinflammatory cytokines. Blood. 2013;121:2647–2658. doi: 10.1182/blood-2012-08-443473. [DOI] [PMC free article] [PubMed] [Google Scholar]
- Chiacchio T, Casetti R, Butera O, et al. Characterization of regulatory T cells identified as CD4+CD25highCD39+ in patients with active tuberculosis. Clin Exp Immunol. 2009;156:463–470. doi: 10.1111/j.1365-2249.2009.03908.x. [DOI] [PMC free article] [PubMed] [Google Scholar]
- Mattos AM, Almeida Cde S, Franken KL, et al. Increased IgG1, IFN-gamma, TNF-alpha and IL-6 responses to Mycobacterium tuberculosis antigens in patients with tuberculosis are lower after chemotherapy. Int Immunol. 2010;22:775–782. doi: 10.1093/intimm/dxq429. [DOI] [PubMed] [Google Scholar]
- Veenstra H, Crous I, Brahmbhatt S, et al. Changes in the kinetics of intracellular IFN-gamma production in TB patients during treatment. Clin Immunol. 2007;124:336–344. doi: 10.1016/j.clim.2007.05.014. [DOI] [PubMed] [Google Scholar]
- Day CL, Abrahams DA, Lerumo L, et al. Functional capacity of Mycobacterium tuberculosis-specific T cell responses in humans is associated with mycobacterial load. J Immunol. 2011;187:2222–2232. doi: 10.4049/jimmunol.1101122. [DOI] [PMC free article] [PubMed] [Google Scholar]
- de Steenwinkel JE, de Knegt GJ, ten Kate MT, Verbrugh HA, Ottenhoff TH, Bakker-Woudenberg IA. Dynamics of interferon-gamma release assay and cytokine profiles in blood and respiratory tract specimens from mice with tuberculosis and the effect of therapy. Eur J Clin Microbiol Infect Dis. 2012;31:1195–1201. doi: 10.1007/s10096-011-1428-2. [DOI] [PMC free article] [PubMed] [Google Scholar]
- den Hertog AL, de Vos AF, Klatser PR, Anthony RM. Early specific host response associated with starting effective tuberculosis treatment in an infection controlled placebo controlled mouse study. PLOS ONE. 2013;8:e57997. doi: 10.1371/journal.pone.0057997. [DOI] [PMC free article] [PubMed] [Google Scholar]
- Jackson-Sillah D, Cliff JM, Mensah GI, et al. Recombinant ESAT-6–CFP10 fusion protein induction of Th1/Th2 cytokines and FoxP3 expressing Treg cells in pulmonary TB. PLOS ONE. 2013;8:e68121. doi: 10.1371/journal.pone.0068121. [DOI] [PMC free article] [PubMed] [Google Scholar]
- Chiappini E, Fossi F, Bonsignori F, Sollai S, Galli L, de Martino M. Utility of interferon-gamma release assay results to monitor anti-tubercular treatment in adults and children. Clin Ther. 2012;34:1041–1048. doi: 10.1016/j.clinthera.2012.03.006. [DOI] [PubMed] [Google Scholar]
- Sester U, Fousse M, Dirks J, et al. Whole-blood flow-cytometric analysis of antigen-specific CD4 T-cell cytokine profiles distinguishes active tuberculosis from non-active states. PLOS ONE. 2011;6:e17813. doi: 10.1371/journal.pone.0017813. [DOI] [PMC free article] [PubMed] [Google Scholar]
- Streitz M, Fuhrmann S, Thomas D, et al. The phenotypic distribution and functional profile of tuberculin-specific CD4 T-cells characterizes different stages of TB infection. Cytometry B Clin Cytom. 2012;82:360–368. doi: 10.1002/cyto.b.21041. [DOI] [PubMed] [Google Scholar]
- Petruccioli E, Petrone L, Vanini V, et al. IFNgamma/TNFalpha specific-cells and effector memory phenotype associate with active tuberculosis. J Infect. 2013;66:475–486. doi: 10.1016/j.jinf.2013.02.004. [DOI] [PubMed] [Google Scholar]
- Chiacchio T, Petruccioli E, Vanini V, et al. Polyfunctional T-cells and effector memory phenotype are associated with active TB in HIV-infected patients. J Infect. 2014 doi: 10.1016/j.jinf.2014.06.009. doi: 10.1016/j.jinf.2014.06.009 . [Epub ahead of print] [DOI] [PubMed] [Google Scholar]
- Day CL, Mkhwanazi N, Reddy S, et al. Detection of polyfunctional Mycobacterium tuberculosis-specific T cells and association with viral load in HIV-1-infected persons. J Infect Dis. 2008;197:990–999. doi: 10.1086/529048. [DOI] [PMC free article] [PubMed] [Google Scholar]
- Millington KA, Innes JA, Hackforth S, et al. Dynamic relationship between IFN-gamma and IL-2 profile of Mycobacterium tuberculosis-specific T cells and antigen load. J Immunol. 2007;178:5217–5226. doi: 10.4049/jimmunol.178.8.5217. [DOI] [PMC free article] [PubMed] [Google Scholar]
- Young JM, Adetifa IM, Ota MO, Sutherland JS. Expanded polyfunctional T cell response to mycobacterial antigens in TB disease and contraction post-treatment. PLOS ONE. 2010;5:e11237. doi: 10.1371/journal.pone.0011237. [DOI] [PMC free article] [PubMed] [Google Scholar]
- Ottenhoff TH. New pathways of protective and pathological host defense to mycobacteria. Trends Microbiol. 2012;20:419–428. doi: 10.1016/j.tim.2012.06.002. [DOI] [PubMed] [Google Scholar]
- Djoba Siawaya JF, Chegou NN, van den Heuvel MM, et al. Differential cytokine/chemokines and KL-6 profiles in patients with different forms of tuberculosis. Cytokine. 2009;47:132–136. doi: 10.1016/j.cyto.2009.05.016. [DOI] [PubMed] [Google Scholar]
- Betts MR, Brenchley JM, Price DA, et al. Sensitive and viable identification of antigen-specific CD8+ T cells by a flow cytometric assay for degranulation. J Immunol Methods. 2003;281:65–78. doi: 10.1016/s0022-1759(03)00265-5. [DOI] [PubMed] [Google Scholar]
- Ritz N, Dutta B, Donath S, et al. The influence of bacille Calmette–Guerin vaccine strain on the immune response against tuberculosis: a randomized trial. Am J Respir Crit Care Med. 2012;185:213–222. doi: 10.1164/rccm.201104-0714OC. [DOI] [PubMed] [Google Scholar]
- Mueller H, Fae KC, Magdorf K, et al. Granulysin-expressing CD4+ T cells as candidate immune marker for tuberculosis during childhood and adolescence. PLOS ONE. 2011;6:e29367. doi: 10.1371/journal.pone.0029367. [DOI] [PMC free article] [PubMed] [Google Scholar]
- Semple PL, Binder AB, Davids M, Maredza A, van Zyl-Smit RN, Dheda K. Regulatory T cells attenuate mycobacterial stasis in alveolar and blood-derived macrophages from patients with tuberculosis. Am J Respir Crit Care Med. 2013;187:1249–1258. doi: 10.1164/rccm.201210-1934OC. [DOI] [PubMed] [Google Scholar]
- Kursar M, Koch M, Mittrucker HW, et al. Cutting Edge: regulatory T cells prevent efficient clearance of Mycobacterium tuberculosis. J Immunol. 2007;178:2661–2665. doi: 10.4049/jimmunol.178.5.2661. [DOI] [PubMed] [Google Scholar]
- Chen X, Zhou B, Li M, et al. CD4(+)CD25(+)FoxP3(+) regulatory T cells suppress Mycobacterium tuberculosis immunity in patients with active disease. Clin Immunol. 2007;123:50–59. doi: 10.1016/j.clim.2006.11.009. [DOI] [PubMed] [Google Scholar]
- Marin ND, Paris SC, Velez VM, Rojas CA, Rojas M, Garcia LF. Regulatory T cell frequency and modulation of IFN-gamma and IL-17 in active and latent tuberculosis. Tuberculosis (Edinb) 2010;90:252–261. doi: 10.1016/j.tube.2010.05.003. [DOI] [PubMed] [Google Scholar]
- de Almeida AS, Fiske CT, Sterling TR, Kalams SA. Increased frequency of regulatory T cells and T lymphocyte activation in persons with previously treated extrapulmonary tuberculosis. Clin Vaccine Immunol. 2012;19:45–52. doi: 10.1128/CVI.05263-11. [DOI] [PMC free article] [PubMed] [Google Scholar]
- Maloy KJ, Powrie F. Regulatory T cells in the control of immune pathology. Nat Immunol. 2001;2:816–822. doi: 10.1038/ni0901-816. [DOI] [PubMed] [Google Scholar]
- Dwyer KM, Hanidziar D, Putheti P, et al. Expression of CD39 by human peripheral blood CD4+ CD25+ T cells denotes a regulatory memory phenotype. Am J Transplant. 2010;10:2410–2420. doi: 10.1111/j.1600-6143.2010.03291.x. [DOI] [PMC free article] [PubMed] [Google Scholar]
- Shafiani S, Dinh C, Ertelt JM, et al. Pathogen-specific Treg cells expand early during Mycobacterium tuberculosis infection but are later eliminated in response to interleukin-12. Immunity. 2013;38:1261–1270. doi: 10.1016/j.immuni.2013.06.003. [DOI] [PMC free article] [PubMed] [Google Scholar]
- Djoba Siawaya JF, Beyers N, van Helden P, Walzl G. Differential cytokine secretion and early treatment response in patients with pulmonary tuberculosis. Clin Exp Immunol. 2009;156:69–77. doi: 10.1111/j.1365-2249.2009.03875.x. [DOI] [PMC free article] [PubMed] [Google Scholar]
- Chiacchio T, Petruccioli E, Vanini V, et al. Higher frequency of T-cell response to M. tuberculosis latency antigen Rv2628 at the site of active tuberculosis disease than in peripheral blood. PLOS ONE. 2011;6:e27539. doi: 10.1371/journal.pone.0027539. [DOI] [PMC free article] [PubMed] [Google Scholar]
- El Fenniri L, Toossi Z, Aung H, et al. Polyfunctional Mycobacterium tuberculosis-specific effector memory CD4+ T cells at sites of pleural TB. Tuberculosis (Edinb) 2011;91:224–230. doi: 10.1016/j.tube.2010.12.005. [DOI] [PMC free article] [PubMed] [Google Scholar]
Associated Data
This section collects any data citations, data availability statements, or supplementary materials included in this article.
Supplementary Materials
Fig. S1. Flow cytometry gating strategy on CD4+ and CD8+ T cells and subpopulations.
Fig. S2. Overview tuberculosis (TB)-specific T cell responses in TB patients.
Fig. S3. Comparisons of cytokine responses in pulmonary and extrapulmonary tuberculosis (TB) during TB therapy.