

Abstract
Regulatory T cells (Tregs) are known to play an immunosuppressive role in the response of contact hypersensitivity (CHS), but neither the dynamics of Tregs during the CHS response nor the exaggerated inflammatory response after depletion of Tregs has been characterized in detail. In this study we show that the number of Tregs in the challenged tissue peak at the same time as the ear-swelling reaches its maximum on day 1 after challenge, whereas the number of Tregs in the draining lymph nodes peaks at day 2. As expected, depletion of Tregs by injection of a monoclonal antibody to CD25 prior to sensitization led to a prolonged and sustained inflammatory response which was dependent upon CD8 T cells, and co-stimulatory blockade with cytotoxic T lymphocyte antigen-4-immunoglobulin (CTLA-4-Ig) suppressed the exaggerated inflammation. In contrast, blockade of the interleukin (IL)-10-receptor (IL-10R) did not further increase the exaggerated inflammatory response in the Treg-depleted mice. In the absence of Tregs, the response changed from a mainly acute reaction with heavy infiltration of neutrophils to a sustained response with more chronic characteristics (fewer neutrophils and dominated by macrophages). Furthermore, depletion of Tregs enhanced the release of cytokines and chemokines locally in the inflamed ear and augmented serum levels of the systemic inflammatory mediators serum amyloid (SAP) and haptoglobin early in the response.
Keywords: contact hypersensitivity, depletion, immunoregulation, regulatory T cells
Introduction
Contact hypersensitivity (CHS) is a T cell-mediated immune reaction where a previously sensitized animal is re-exposed to a hapten, thereby eliciting an immunological reaction at the site of antigen exposure. In mice, CHS has been studied in great detail using haptens such as dinitrofluorobenzene (DNFB) and oxazolone and the immunological reaction is thought to be driven mainly by CD8 T cells 1, but also to encompass multiple other cell types, including both Langerhans cells (LC) 2, dermal dendritic cells 3, B-1 cells 4, natural killer (NK) T cells 5, NK cells 6, granulocytes (in particular neutrophils) 7, mast cells 8 and regulatory T cells (Tregs) 9–12. Furthermore, several cytokines and chemokines are implicated in the process 13. This makes the CHS model useful for studying the in-vivo effect of modulating one or more of these pathways and it therefore represents a mechanistic model of general immune-activation 13.
CD4+CD25+ forkhead box protein 3 (FoxP3)+ regulatory T cells (Tregs) are central in maintaining peripheral tolerance, and a reduction in their number or a defect in their suppressive function has been associated with autoimmune diseases such as rheumatoid arthritis (RA) 14. In normal adult mice or humans, Tregs represent 5–10% of the peripheral CD4 T cells and are characterized by a low sensitivity to stimulation via the antigen T cell receptor (TCR) as well as an impairment in interleukin (IL)-2 production 15. The first evidence for a regulatory function of a subset of CD4 T cells in the CHS model was suggested by studies which showed that CD4 depletion with monoclonal antibodies (mAbs) 1,16 or the use of MHC class II knock-out (KO) mice 17,18 led to an increased CHS response. Subsequently, the role of CD4+CD25+ T cells in CHS has been investigated further. Thus, adoptive transfer of freshly isolated or in-vitro expanded CD4+CD25+ T cells has been demonstrated to reduce the ear-swelling response in CHS significantly 10. Furthermore, treatment of wild-type mice with anti-CD25 monoclonal antibodies (mAb) during hapten sensitization increased the magnitude and duration of the CHS response 19. Tregs can exert their regulatory function in two different phases of the CHS response: during the expansion and differentiation of CD8 effector T cells in the skin-draining lymph node (dLN) or during the inflammatory process generated in the skin. In the dLN, several mechanisms have been suggested: first, it has been shown that a gap junction can be formed between Tregs and antigen-presenting cells (APCs) which may transfer cyclic adenosine monophosphate (cAMP) or cAMP-inducing second messengers to the APC. This intercellular communication leads to down-regulation of T cell co-stimulatory molecules on the surface of the APC, abrogating the priming, activation and proliferation of CD8 T cells and thereby blocking sensitization 11. Secondly, the development and expansion of antigen-specific CD8 T cells is thought to be restricted by Tregs through a Fas ligand (FasL)-dependent mechanism 20. In the dLN it is further suggested that IL-2 is required to maintain the presence and activity of Tregs that restrict the development of effector CD8 T cells and further the magnitude and duration of the CHS response 19. Additionally, CCR7 expression on Tregs is required for their migration into the dLNs and contributes to their suppressive function 21. In the skin, it has been demonstrated that Tregs directly block influx of effector T cells into the challenged tissue and that IL-10 produced by Tregs is involved in this effect 12. Furthermore, a role for adenosine in this control of recruitment has been proposed, as adenosine down-regulates endothelial cell expression of E- and P-selectin needed for cell recruitment 9. Trafficking of Tregs has been studied during the CHS response using kaede-transgenic mice by Tomura et al. 22, who showed that activated Tregs migrate from the skin upon sensitization into the dLN, where they exert a stronger immunosuppressive function than the LN-resident Tregs. Moreover, these migrating Tregs recirculate into the skin after challenge to terminate the inflammatory response. Recently, the role of Tregs in the CHS response has been studied using conditional depletion of Tregs in transgenic mice expression of human diphteria toxin receptor (DTR) specifically in Tregs (FoxP3-DTR mice). In this model it was shown that Treg cell function is critical both during the sensitization phase and during the resolution of the response 23.
Although an important role of Tregs in CHS seems beyond doubt, several aspects of Treg function during CHS remain unresolved. To this end, we demonstrate that during CHS, Treg numbers and phenotype are dynamically regulated both in the tissue and in the draining lymph nodes, and we characterize the enhanced inflammation observed during CHS in Treg-depleted mice. As expected, depletion of Tregs resulted in an exaggerated inflammatory response which changed from being heavily dominated by neutrophils to a response dominated by macrophages. Furthermore, CHS in Treg-depleted animals was characterized by increased levels of cytokines and chemokines locally in the ear as well as increased systemic inflammatory markers, and we showed that in the absence of Tregs, the exaggerated inflammatory response was driven by T cells and could be suppressed by co-stimulatory blockade with cytotoxic T lymphocyte antigen-4-immunoglobulin (CTLA-4-Ig) but not by blockade of tumour necrosis factor (TNF)-α. Additionally, blockade of IL-10R did not further increase the exaggerated inflammatory response in the Treg-depleted mice.
Materials and methods
Mice
Female BALB/c mice were purchased from Taconic, Ry, Denmark. The mice were used at the age of 8–10 weeks. The mice had free access to water and standard mouse chow (Altromin®) and were kept in a room with a 12-h day/night cycle. All animal experiments were approved by the ethical review committee at Novo Nordisk A/S as well as the Danish Animal Inspectorate.
Contact hypersensitivity
CHS experiments were performed largely as described previously 24. In brief, the mice were sensitized on day −5 by applying 20 μl 0·5% 1–fluoro-2·4-dinitrobenzene (DNFB; Sigma, St Louis, MO, USA) dissolved in 4 : 1 acetone (VWR, Radnor, PA, USA)/olive oil (Sigma) on the shaved abdominal skin. Five days later (on day 0), the baseline ear thickness on the left ear was measured, after which both sides of the left ear were challenged by epicutaneous application of 20 μl 0·2% DNFB. The challenge treatment was performed under light anaesthesia with isoflurane. The ear thickness of the left ear was measured multiple times after challenge with a dial-thickness gauge from Mitutoyo (Mitutoyo Pocket Thickness Gages 7309; Kawasaki, Japan). The ear swelling (ΔT) was calculated as ear thickness 1–10 days after challenge minus baseline ear thickness. It is expressed as the mean ± standard error of the mean in units of 10−2 mm. All groups always comprised five animals.
Antibody treatment
On days −16 and −13 mice were treated with 200 μg rat anti-mouse CD25 monoclonal antibody (mAb) intraperitoneally (i.p.) (clone: PC.61·5, rIgG1; BioXcell, West Lebanon, NH, USA). Where indicated, a rat anti-mouse TNF-α mAb (500 μg/mouse) (clone: XT3·11, rIgG1; BioXcell) or a rat anti-mouse IL-10R mAb (250 μg/mouse) (clone: 1B1·3A, rIgG1; BioXcell) were injected 1 day prior to sensitization (day −6) in groups depleted for Tregs as well as in non-depleted control groups. Additionally, a group treated with rat IgG1 (BioXcell) in 500 μg/mouse served as negative control for both anti-TNF-α and anti-IL-10R mAb. Where indicated, a group was treated 1 day prior to sensitization (day −6) with human CTLA-4-Ig (Orencia®, Abatacept marketed by Bristol-Myers Squibb, NH, USA) in a dose of 500 μg/mouse and compared to an isotype control group treated with the Fc part of human IgG1 (BioXcell) in the same dose as CTLA-4-Ig. Treatments were repeated on days −3, −1, 2, 5, 8 and 10. Also when indicated, CD4 and CD8 T cells were depleted simultaneously or CD8 T cells were depleted exclusively by using a rat anti-mouse CD4 mAb (clone GK1·5, rIgG2b; BioXcell) and a rat anti-mouse CD8 mAb (clone 53·6.72, rIgG2b; BioXcell) injected in 1 mg/200 μl phosphate-buffered saline (PBS)/mouse i.p. Groups of mice were treated with depleting antibodies either on day −6 (1 day prior to sensitization) and again on day 3 after challenge or solely on day 2 after challenge. An overview of the dosing regimen, dose and clone of the different antibodies is provided in Table 1.
Table 1.
Overview of the antibodies and compounds specifying clone, dose, depletion check and days of dosing in relation to sensitization on day −5 and challenge on day 0
| Antibody/compound | Clone | Dose/mouse | Days of dosing | Depletion check |
|---|---|---|---|---|
| Rat anti-mouse CD25 mAb | PC.61·5 | 200 μg | Days −16 and −13 | Days −12 and −5 |
| Rat anti-mouse CD4 mAb + rat anti-mouse CD8 mAb | CD4: GK1·5 | 1 mg | Group 1: days −6 and 3 | Day 4 |
| CD8: 53·6.72 | ||||
| Group 2: day 2 | ||||
| Rat anti-mouse TNF-α mAb | XT3·11 | 500 μg | Days −6, −3, 1, 2, 5 and 8 | |
| Rat anti-mouse IL-10R mAb | 1B1·3A | 250 μg | Days −6, −3, 1, 2, 5 and 8 | |
| Rat IgG1 | HRPN | 500 μg | Days −6, −3, 1, 2, 5 and 8 | |
| CTLA-4-Ig | n.a. | 500 μg | Days −6, −3, 1, 2, 5 and 8 | |
| Recombinant human Fc-G1 | Human Fc-G1 | 500 μg | Days −6, −3, 1, 2, 5, and 8 |
mAb = monoclonal antibody; TNF = tumour necrosis factor; IL = interleukin; Ig = immunoglobulin; CTLA-4 = cytotoxic T lymphocyte antigen-4; n.a. = not applicable.
Depletion check
Depletion of CD4+CD25+FoxP3+ T cells was confirmed by flow cytometric analysis using a LSRII flow cytometer (BD Biosciences, San Jose, CA, USA) on days −7 and 0. Cell preparation and staining were performed using the protocol provided together with the intracellular FoxP3 staining kit (BD Biosciences). Briefly, a blood sample (100 μl in ethylenediamine tetraacetic acid (EDTA)-coated Eppendorf tubes (Eppendorf, Hamburg, Germany) was collected from each mouse. The samples were first blocked with anti-CD32/CD16 (Fc block; BD Biosciences) for 10 min and surface-stained with the following anti-mouse mAbs: anti-CD25-fluorescein isothiocyanate (FITC) (BD Biosciences), anti-CD4-APC (BD Biosciences) and anti-CD45-PerCP (BD Biosciences). After lysing and permeabilization, each sample was split into two where one was stained with anti-FoxP3-PE (BD Bioscience) and the other stained with the isotype control rIgG2 (BD Bioscience). Flow cytometric data were analysed using fluorescence activated cell sorter (FACS) DIVA software (version 6·01) and was expressed as a percentage of CD4+FoxP3+CD25+ cells of CD4+ cells after gating for single events by forward- (FSC) and side-scatter (SSC) and using a lymphocyte FSC/SSC size gate. Depletion of CD4 and CD8 T cells was confirmed on day 4 after challenge by flow cytometric analysis on blood samples. A blood sample (100 μl in EDTA-coated Eppendorf tubes; Eppendorf) was collected from each mouse. The samples were first blocked with anti-CD32/CD16 (Fc block, BD Biosciences) for 10 min and surface-stained with anti-CD8-FITC (Santa-Cruz Laboratories, Santa Cruz, CA, USA), anti-CD4-phycoerythrin (PE) (eBioscience, San Diego, CA, USA), anti-CD45-APC (BD Biosciences) and anti-T cell receptor (TCR)-β PE-cyanin 7 (Cy7) (Biolegend, San Diego, CA, USA). After staining, red blood cells were lysed with FACS lysing solution (BD Biosciences). Flow cytometric analysis of samples was analysed on a BD LSRII flow cytometer equipped with a blue, red and violet laser and data were analysed using BD FACS Diva software version 6·1.3.
Flow cytometry on ear infiltrating cells on days 3 and 8 after challenge
Flow cytometric analysis was performed on the cellular infiltrate in the ear on days 3 and 8 after challenge in Treg-depleted mice and in non-depleted controls. Briefly, the inflamed ear was divided into dorsal and ventral halves. Using a scalpel, the dermis was separated from epidermis and both parts were subsequently incubated with 2000 U/ml collagenase (Sigma) and 2000 U/ml DNAse (Roche, San Diego, CA, USA) for 60 min. Next, ear tissue was passed through a 70 μm cell strainer before cells were washed and resuspended in PBS (without Mg2+ and Ca2+; Gibco/Invitrogen, Carlsbad, CA, USA). The cell suspensions were blocked thereafter with CD32/CD16 (Fc block, BD Biosciences) for 10 min and stained with the following anti-mouse mAb: anti-CD45-eFfluor605 (eBioscience, San Diego, CA, USA), anti-TCR-Qdot655 (Molecular Probes, Eugene, OR, USA), anti-CD4-PE-Cy7 (BD Biosciences), anti-CD44-peridinin chlorophyll (PerCP)Cy5·5 (eBiosciences), anti-CD11b-AF700 (eBiosciences), anti-CD8a-Pacific Blue (BD Biosciences), anti-F4/80-PE (eBiosciences), anti-Ly6G-FITC (BD Biosciences) and anti-NK G2D-APC (eBiosciences) for 30 min. Flow cytometric analysis of samples was analysed on a BD LSRII flow cytometer equipped with a blue, red and violet laser and data was analysed using BD FACS Diva software version 6·1.3.
Cytokine measurements
Ears were removed 3 and 8 days after challenge and each ear was weighed and placed in 0·5 ml buffer (0·9% saline with 0·01% Triton X-100 (Sigma) + 1 protease inhibitor cocktail tablet (complete EDTA-free; Roche) on ice. The ears were subsequently homogenized and centrifuged for 15 min for 10 000 g at 4°C. The supernatants were centrifuged once more before being frozen at −80 degrees until use. Supernatants were analysed with A Milliplex MAP mouse cytokine/chemokine panel (Millipore, Billerica, MA, USA) by the Luminex detection method for the following cytokines and chemokines: IL-4, IFN-γ-induced protein 10 (IP-10), IL-12p40, macrophage inflammatory protein-2 (MIP-2), TNF-α, IFN-γ, IL-1β, IL-10 and IL-6.
Histology
The left inflamed ear from mice depleted of Tregs and from non-depleted control mice were dissected at days 3 and 8 after challenge. They were then immersed in 4% formaldehyde (VWR) for 24 h at room temperature, followed by transfer to 70% ethanol, where they were stored at 4°C until embedding in paraffin using the Milestone Pathos (Bergamo, Italy) automatic microwave histoprocessor. Subsequently, samples were embedded in paraffin blocks using the embedding centre (Shandon Histocentre 3; Thermo Scientific, Waltham, MA, USA). Sections of 4–5 μm were prepared at the microtome (Leica RM2165) and stained with haematoxylin and eosin (H&E). The inflammatory cell infiltrate was then studied under a light microscope (Olympus AX70 (Olympus, Tokyo, Japan) at ×10 and 40 magnification) and pictures taken using the software program Visiopharm.
Immunohistochemistry
immunohistochemical (IHC) staining of F4/80+ cells was performed to detect the infiltration of macrophages. Briefly, paraffin-embedded sections were deparaffinized and rehydrated, whereafter antigen retrieval was performed with a Tris-buffered saline (TBS) buffer for 5 min. Endogenous peroxidase was quenched using 0·5% H2O2 for 20 min and sections were incubated in the preincubation buffer (7% donkey serum, 3% mouse serum and 3% skimmed milk in TBS). Subsequently, sections were incubated overnight at room temperature (RT) with rat anti-mouse F4/80 antibody (Abcam, Cambridge, UK) or rat IgG2b isotype control (R&D Systems, Minneapolis, MN, USA) diluted in 7% donkey serum, 3% mouse serum and 0·5% skimmed milk in TBS, respectively. For detection, the section were incubated for 30 min with Histofine® Simple Stain™ Mouse Max peroxidase (PO) (rat) (Nichirei, Tokyo, Japan), which is a labelled polymer prepared by combining amino acid polymers with PO and secondary antibody reduced to a Fab′ fragment. Peroxidase activity was demonstrated by incubation with 3,3′-diaminobenzidine/tetrahydrochloride (Sigma)–H2O2 solution. Slides were counterstained with haematoxylin. Slides were scanned using the Nanozoomer 2·0 HT slidescanner (Hamamatsu, Japan).
Acute-phase proteins
Serum samples taken 24 and 48 h after challenge were analysed for serum amyloid P (SAP) and haptoglobin using enzyme-linked immunosorbent assays (ELISAs) according to the manufacturer's recommendations (Genway, San Diego, CA, USA).
Flow cytometric analysis of FoxP3+ Tregs during the normal CHS response
To study the presence and proliferation of FoxP3+ Tregs during the CHS response, the ear-draining auricular lymph node as well as the inflamed ear were removed days 1, 2 and 4 after challenge. Cell suspensions were prepared by transferring the lymph node through a 70-μm cell strainer and washing cells with 1 × PBS (without Mg2+ and Ca2+; Gibco/Invitrogen). Cells were resuspended at 10 × 106 cells/ml and 1 × 10⁶ cells/sample were used for staining. Additionally, the inflamed ear was divided into dorsal and ventral halves. Using a scalpel, the dermis was separated from epidermis and both parts were incubated subsequently with 2000 U/ml collagenase (Sigma) and 2000 U/ml DNAse (Roche) for 60 min. Next, ear tissue was passed through a 70-μm cell strainer before cells were washed and resuspended in PBS (without Mg2+ and Ca2+; Gibco/Invitrogen). The cell suspensions were then blocked with anti-CD32/CD16 (Fc block; BD Biosciences) for 10 min and surface-stained with the following anti-mouse mAbs: anti-CD25-PerCPCy5·5 (eBiosciences), anti-CD4-Qdot605 (Invitrogen), anti-CD45-eFluor450 (eBiosciences), anti-CTLA-4-PE (BD Biosciences), anti-CD44-FITC (eBiosciences) and near-infrared (NearIR) for live/dead staining for 30 min. After surface-staining, cells were permeabilized and fixated using the FoxP3 fixation/permeabilization buffer provided by the manufacturer (eBiosciences) and subsequently each sample was divided into two. One was stained with FoxP3-APC (eBiosciences) and Ki67-PE-Cy7 (eBiosciences), while the other was stained with the respective isotype controls rIgG2a-PE-Cy7 (eBiosciences) and rIgG2a-APC (eBiosciences). Tregs were defined as CD45+TCR-β+CD4+FoxP3+ cells. Flow cytometric analysis of samples was performed on a BD LSRII flow cytometer equipped with a blue, red and violet laser and data were analysed using BD FACS Diva software version 6·1.3
Statistical analysis
Statistical analysis to assess differences between experimental groups was performed using a Student's t-test when comparing only two groups and a one-way analysis of variance (anova) with Bonferroni's correction when comparing more than two groups. Differences were considered significant when P < 0·05. Data are shown as *P < 0·05, **P < 0·01 and ***P < 0·001.
Results
Tregs infiltrate and proliferate in the ear early in the response
To investigate the dynamics of Tregs during the CHS response we determined the presence of CD4+FoxP3+ cells in the challenged ear and in the ear-draining auricular lymph node (dLN) at days 1, 2 and 4 post-challenge by flow cytometry. From Fig. 1a,e it can be seen that in the inflamed ear, CD4+FoxP3+ Tregs were most abundant at day 1 compared to days 2 and 4 in both absolute numbers (#) and as % of total CD4+ cells. The abundant number of Tregs on day 1 compared to day 4 is illustrated in Fig. 1i, which shows representative FACS plots of the FoxP3+CD4+ population on days 1 and 4, respectively. Furthermore, Tregs were proliferating in the tissue, as shown by significant expression of Ki67 at all time-points. In absolute numbers (#), Ki67+ Tregs were highest at day 1 due to a higher total number of Tregs in the ear at that time-point, as seen in Fig. 1b,f. Moreover, CTLA-4+ Tregs peaked at day 1 and declined to day 4 both in percentage and in absolute numbers (#) (Fig. 1c,g). This decline in CTLA-4+FoxP3+ cells is shown in the representative FACS plot in Fig. 1j. When analysing CD44 expression on Tregs in the inflamed ear, we noted that the frequency of CD44+ Tregs (%CD44+ cells out of Tregs) was highest at day 4 compared to days 1 and 2, suggesting that Tregs are adopting an activated phenotype during the response (Fig. 1d). However, when looking at absolute numbers, the number of CD44+ Tregs decreased from days 2 to 4 (Fig. 1h). Figure 1k shows a representative FACS plot gated on CD44+ Treg cells (CD44+FoxP3+ cells). We next analysed the presence of Tregs in the dLN at days 1, 2 and 4 after challenge as well as in naive mice (Fig. l1–s). The frequency of Tregs in the dLN (%CD4+FoxP3+cells out of CD4+ cells) did not change during CHS induction compared to naive controls (Fig. 1l). However, the absolute number of Tregs increased significantly at days 1 and 2 (Fig. 1p) due to an overall increase in cell numbers in the dLN at days 1 and 2. Furthermore, although the overall frequency of Tregs in the dLN did not change during the CHS response, we noted a significant increase in Ki67+ Tregs at all time-points, suggesting that Tregs started to proliferate during the CHS response (Fig. 1m,q). In accordance with the observations in ear tissue, Tregs in the dLN down-regulated CTLA-4 from days 1 to 4 after challenge (Fig. 1n,r), whereas expression of CD44 on Tregs in the dLN was more variable (Fig. 10s,). Taken together, these results suggest that Tregs are abundantly present in the inflamed ear and already express the highest level of CTLA-4 the day after challenge, whereas in the ear-draining lymph node, the number of Tregs peaks at day 2 after challenge and were found to proliferate, increase their expression of CTLA-4 and have a more activated phenotype after challenge compared to Tregs from a naive lymph node.
Fig 1.

Dynamics and phenotypic changes of regulatory T cells during contact hypersensitivity (CHS) response. At days 1, 2 and 4 after challenge, cellular infiltrates in the ear and the cells in the ear-draining lymph node (dLN) were analysed for the presence of forkhead box protein 3 (FoxP3)+ cells by intracellular staining followed by flow cytometry analysis. The ear dLNs from a group of naive mice were also included in the analysis. The cells were analysed further for their expression of the proliferation marker Ki67, the activation marker CD44 as well as cytotoxic T lymphocyte antigen-4 (CTLA-4). (a) %FoxP3+ cells of CD4+ cells in the ear; (b) %Ki67+ cells of CD4+FoxP3+ cells in the ear; (c) %CTLA-4+ cells of CD4+FoxP3+ cells in the ear; (d) %CD44+ cells of CD4+FoxP3+ cells in the ear; (e) absolute number (#) of CD4+FoxP3+ cells in the ear; (f) absolute number (#) of CD4+FoxP3+Ki67+ cells in the ear; (g) absolute number (#) of CD4+FoxP3+CTLA4+ cells in the ear; (h) absolute number (#) of CD4+FoxP3+CD44+ cells in the ear; (i) representative fluorescence activated cell sorter (FACS) plots of the population of CD4+FoxP3+ cells in the ear at days 1 (left) and 4 (right) after challenge; (j) representative FACS plots of the population of CD4+FoxP3+CTLA-4+ cells in the ear at days 1 (left) and 4 (right) after challenge; (k) representative FACS plots of the population of CD4+FoxP3+CD44+ cells in the ear at days 1 (left) and 4 (right) after challenge; (l) %FoxP3+ cells of CD4+ cells in the dLN. (m) %Ki67+ cells of CD4+FoxP3+ cells in the dLN; (n) %CTLA-4+ cells of CD4+FoxP3+ cells in the dLN; (o) %CD44+ cells of CD4+FoxP3+ cells in the dLN; (p) absolute number (#) of CD4+FoxP3+ cells in the dLN; (q) absolute number (#) of CD4+FoxP3+Ki67+ cells in the dLN; (r) absolute number (#) of CD4+FoxP3+CTLA4+ cells in the dLN; (s) absolute number (#) of CD4+FoxP3+CD44+ cells in the dLN. Data are depicted as mean ± standard error of the mean. *P < 0·05; **P < 0·01 and ***P < 0·001, n = 5/group.
Depletion of Tregs results in sustained and prolonged inflammatory response
To investigate further the role of Tregs in the DNFB-induced CHS response, a rat anti-mouse CD25 mAb was administered in doses of 100, 200 or 400 μg/mouse at days −16 and −13 prior to sensitization. Depletion of CD4+CD25+FoxP3+ cells was confirmed on days −12, −5 and 10. Mice were sensitized on day −5, challenged on day 0 and ear swelling was measured 1–10 days post-challenge. The experimental outline is depicted schematically in Fig. 2a. As can be seen in Fig. 2b, depletion of Tregs was complete for all three doses of anti-CD25 mAb compared to the untreated control group on days −12 and −5. On day 10, a small increase in the Treg population was observed in the group treated with 100 μg anti-CD25 mAb/mouse. The population of non-regulatory CD4 T cells was not affected by administration of anti-CD25 mAb on days −12 and day −5, suggesting that only the population of CD4+CD25+FoxP3+ Tregs was depleted by the anti-CD25 mAb (Fig. 2d,e). The ear-swelling response depicted in Fig. 2c reveals that depletion of Tregs resulted in a sustained and prolonged inflammation for all three doses of anti-CD25 mAb, which confirmed previous studies where anti-CD25 antibodies were used to deplete Tregs during CHS 19. Ear swelling in all three Treg-depleted groups reached a plateau from days 1 to 5 and decreased slightly thereafter in contrast to the untreated control group, where the response peaked on day 1 and declined quickly to days 2 and 3. Based on these observations, 200 μg/mouse was chosen as the preferred dose of anti-CD25 mAb in the following studies.
Fig 2.

Depletion of regulatory T cells (Tregs) with a rat anti-mouse CD25 monoclonal antibody. (a) Mice were treated with rat anti-mouse CD25 monoclonal antibody (mAb) on days −16 and −13 prior to challenge. Depletion was confirmed using intracellular forkhead box protein 3 (FoxP3)-staining followed by flow cytometric analysis on days −12, −5 and 10. Mice were subsequently sensitized on day −5, challenged on day 0 and the ear-swelling response was measured 10 days post-challenge. (b) %CD25+FoxP3+ cells of CD4+ cells in blood checked by flow cytometry at days −12, −5 and 10 in relation to challenge in groups treated with 100, 200 and 400 μg anti-CD25 mAb/mouse, respectively, as well as in a untreated control group. (c) Ear-swelling response in groups treated with 0 (untreated control), 100, 200 and 400 μg anti-CD25 mAb/mouse in 10 days post-challenge. (d,e) %CD4+ cells of CD45+ cells in the blood at days −12 (d) and −5 (e) in groups treated with 100, 200 and 400 μg anti-CD25 mAb/mouse, respectively, as well as in an untreated control group. Data are depicted as mean ± standard error of the mean, n = 5/group.
Depletion of Tregs results in an exaggerated inflammation driven by CD8 T cells
To assess the driver mechanisms behind the exaggerated inflammatory response due to Treg depletion, infiltrating cells in the inflamed ear were analysed by flow cytometry on days 3 and 8 after challenge. Both at days 3 and 8 after challenge, a significantly increased number of CD8 T cells was detected in the inflamed ear in the absence of Tregs compared to non-depleted controls (Fig. 3a). In contrast, the number of CD4 T cells was affected to a much lesser degree, although a small but significant rise in numbers was observed in the Treg-depleted group 8 days after challenge, as seen in Fig. 3b. To examine further the role of T cells and to establish whether the exaggerated inflammatory response seen in Treg-depleted mice was dependent upon T cells, we treated Treg-depleted mice with anti-CD4 and anti-CD8 mAb simultaneously at different time-points after challenge. As expected, depletion of CD4 and CD8 T cells 1 day prior to sensitization (day −6) totally abrogated the inflammatory response (Fig. 3c), and depletion of CD4 and CD8 T cells at peak after challenge (day 2) suppressed the sustained inflammatory reaction significantly. Depletion was confirmed on day 4 after challenge and revealed complete depletion of the relevant cell types (see Supporting information, Fig. S1). These data suggested that T cells also play a role in sustaining the inflammatory response in the absence of Tregs. Furthermore, as the DNFB-induced CHS reaction is known to be strongly dependent upon CD8 T cells, we performed selective depletion of CD8 T cells in Treg-depleted mice. As shown in Fig. 3d, depletion of CD8 T cells reduced the ear-swelling response in the Treg-depleted mice significantly. Together, these results illustrate that depletion of Tregs results in a sustained inflammation mediated primarily by CD8 T cells.
Fig 3.

CD8 T cells are important in the exaggerated inflammatory response in the absence of regulatory T cells (Tregs). The cellular infiltrate in the inflamed ear was analysed at day 3 and 8 after challenge by flow cytometry in Treg-depleted mice as well as in non-depleted control mice. (a) Absolute number (#) of CD8 T cells/ear; (b) absolute number (#) of CD4 T cells/ear; (c) to deplete both CD4 and CD8 T cells, a rat anti-mouse CD4 and a rat anti-mouse CD8 monoclonal antibody (mAb) were administered either at day −6 (one day prior to sensitization) or day 2 (at peak of the response) in groups previously depleted for Tregs. Ear-swelling response was measured 8 days post-challenge and the response after depletion of T cells at either days −6 or 2 in Treg-depleted mice was compared to a group only depleted for Tregs. (d) To investigate the effect of selective depletion of CD8 T cells, a rat anti-mouse CD8 mAb was administered at peak of the inflammatory response at day 2 after challenge in a Treg-depleted group. Ear-swelling response was followed 8 days after challenge and compared to a Treg-depleted group as well as a group depleted for neither Tregs nor CD8 T cells. Data are depicted as mean ± standard error of the mean. *P < 0·05, **P < 0·01 and ***P < 0·001, n = 5/group.
Sustained inflammation by depletion of Tregs is dominated by neutrophils in the early phase and macrophages in the late phase
To investigate if depletion of Tregs affected the number of other cell types in the inflamed tissue we analysed the cellular infiltrates in the inflamed ear by flow cytometry on days 3 and 8 after challenge, with the focus on neutrophils (gated as CD45+CD11b+Ly6Ghigh cells), and on macrophages (gated as CD45+CD11b+Ly6GlowF4/80+ cells). At day 3, depletion of Tregs led to an increased number of neutrophils compared to the non-depleted control, which corresponded to the general increased ear-swelling response. However, a decrease in the absolute number of neutrophils was observed at day 8 in both Treg-depleted and non-depleted control mice compared to day 3 (Fig. 4a). In contrast, the number of macrophages did not decrease, and a slight increase in their number was observed from days 3 to 8 in the Treg-depleted group (Fig. 4b). The findings using flow cytometry were confirmed by histology, demonstrating that the cellular infiltrate in a Treg-depleted mouse on day 3 (Fig. 4d, left row) was dominated by polymorphonuclear cells located in intraepithelial foci, whereas on day 8 the cells in the ear were mainly mononuclear cells, as well as macrophages and monocytes (Fig. 4d, right row). As a control, inflamed ears from non-depleted control mice from days 3 and 8 are shown in Fig. 4e. Additionally, the infiltration of macrophages was detected by immunohistochemical staining of F4/80+ cells. Fig. 4f,g shows representative sections of the macrophage-specific staining, which illustrated the presence of macrophages in the inflamed ear from a Treg-depleted mouse on day 8 (Fig. 4f, right). On day 3 macrophages could also be detected in the ear from a Treg-depleted mouse; however, their presence appeared to be less dominating compared to day 8 (Fig. 4f, left). In a non-depleted control mouse, macrophages could also be detected both at days 3 and 8, but not to the same extent as after Treg depletion. Taken together, these results demonstrate that the response changes from being dominated by neutrophils to a more chronic phase dominated by monocytes and macrophages.
Fig 4.

Cellular changes from early to late during the inflammatory response after depletion of regulatory T cells (Tregs). The cellular infiltrate in the inflamed ear was analysed by flow cytometry on days 3 and 8 after challenge in Treg-depleted groups and in non-depleted control groups, respectively. (a) Absolute number (#) of neutrophils gated as CD45+CD11b+lymphocyte antigen 6 (Ly6)G+ cells; (b) absolute number of macrophages gated as CD45+CD11b+F4/80+ cells; (c) representative fluorescence activated cell sorter (FACS) plot showing the CD45+CD11b+Ly6G+ population of neutrophils (orange) and the CD45+CD11b+F4/80+ cells of macrophages (purple) in a Treg-depleted mouse on day 3 (upper) and day 8 (lower); (d,e) histological sections showing the cellular infiltrate in the ear from a Treg-depleted mouse on day 3 (d, left row) and day 8 (d, right row) and in a non-depleted control mouse on day 3 (e, left row) and 8 (e, right row); (f,g) immunohistochemically stained sections showing the presence of F4/80+ macrophages in the ear from a Treg-depleted mouse on day 3 (f, left) and day 8 (f, right) and in a non-depleted control mouse on day 3 (g, left) and 8 (g, right). Data are depicted as mean ± standard error of the mean. *P < 0·05, **P < 0·01 and ***P < 0·001, n = 5/group. Scale bar = 0·1 mm. The study was repeated twice with similar results.
Depletion of Tregs results in increased inflammation both systemically and locally early in the response
To study the effect of Treg depletion on inflammation locally in the tissue, homogenates of inflamed ear tissue were analysed for selected cytokines and chemokines at days 3 and 8 after challenge. As seen in Fig. 5a,e,g,h, the levels of the cytokines TNF-α, IL-6, IL-1β, IFN-γ and IL-4 as well as chemokines IP-10 and MIP-2 were increased significantly at day 3 in the absence of Tregs compared to non-depleted controls. In contrast, levels of IL-10 (Fig. 5f) were not affected by Treg depletion, suggesting that other cell types than Tregs are capable of producing IL-10. In the later phase of the response at day 8, the levels of the selected cytokines and chemokines were low in both groups, which suggest that inflammation might be sustained by other cytokines or by other mechanisms than cytokine-release late in the response. To investigate the impact of Treg depletion on systemic inflammation, serum levels of the acute phase reactants serum amyloid P (SAP) and haptoglobin were measured at days 3 and 8 after challenge. In Treg-depleted mice, serum levels of both SAP and haptoglobin were increased significantly at day 3 compared to non-depleted control mice, as depicted in Fig. 5i,j. In contrast, low levels of SAP (I) and haptoglobin (J) were found in both groups at day 8. Together, these data suggest that depletion of Tregs leads to exaggerated local as well as systemic response in the early phase of the inflammatory response.
Fig 5.

Depletion of regulatory T cells (Tregs) augments the level of local and systemic inflammatory mediators early in the response. (a–h) Homogenates of inflamed ear tissue were analysed for their content of a range of selected cytokines and chemokines at days 3 and 8 after challenge both in Treg-depleted mice and in non-depleted control mice. (a) Tumour necrosis factor (TNF)-α; (b) interleukin (IL)-6; (c) IL-1β; (d) interferon (IFN)-γ; (e) IL-4; (f) IL-10; (g) macrophage inflammatory protein (MIP)-2; (h) IFN-γ-induced protein 10 (IP-10); (i,j) serum from Treg-depleted mice and non-depleted control mice was analysed for acute-phase reactants serum amyloid P (SAP) (i) and haptoglobin (j) at days 3 and 8 after challenge. Data are depicted as mean ± standard error of the mean. *P < 0·05, **P < 0·01 and ***P < 0·001, n = 5/group.
Co-stimulatory blockade suppresses the exaggerated inflammatory response after Treg depletion
To characterize further the enhanced ear-swelling response after Treg depletion, we speculated that increased T cell activation and/or increased cytokine production could contribute to the exaggerated and sustained inflammation. To test this, we choose to block T cell co-stimulation or TNF-α function during challenge in Treg-depleted mice. Similarly, as IL-10 production locally in the tissue was unaffected by Treg depletion, we wanted to test whether blockade of IL-10R signalling would further exaggerate the response in Treg-depleted mice. As depicted in Fig. 6a, blockade of TNF-α during Treg depletion did not suppress the exaggerated inflammatory response compared to isotype control-treated Treg-depleted mice. This suggested that the exaggerated inflammatory response in the absence of Tregs was not driven by TNF-α alone. Furthermore, as depicted in Fig. 6b, blockade of IL-10R did not increase the ear swelling in the Treg-depleted mice significantly compared to the isotype control-treated Treg-depleted group, demonstrating that IL-10 neutralization could not increase the inflammatory response further after Treg depletion. However, in non-Treg-depleted mice, IL-10R blockade resulted in increased ear-swelling compared to isotype-treated mice, showing that in Treg-sufficient mice, IL-10 is involved in limiting the inflammatory reaction (Fig. 6b). Finally, co-stimulatory blockade by CTLA-4-Ig significantly inhibited the enhanced inflammation after depletion of Tregs compared to the isotype control-treated Treg-depleted group and confirmed that blockade of T cell co-stimulation can inhibit the increased inflammation caused by Treg depletion (Fig. 6c).
Fig 6.
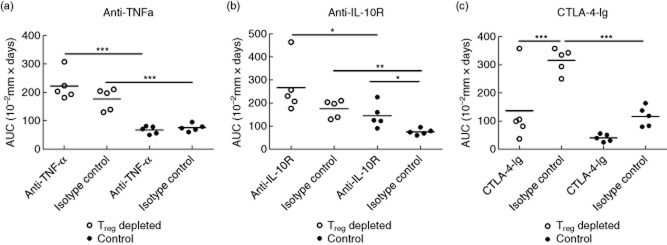
Co-stimulatory blockade suppresses the exaggerated inflammatory response in the absence of regulatory T cells (Tregs) but no effect after blocking interleukin (IL)-10R or tumour necrosis factor (TNF)-α was observed. Groups of mice depleted of Tregs (open dots) and non-depleted control groups (black dots) were treated with rat anti-mouse anti-TNF-α monoclonal antibody (mAb) (500 μg/mouse) (a), rat anti-mouse IL-10R mAb (250 μg/mouse) (b) or cytotoxic T lymphocyte 4-immunoglobulin ( (CTLA-4-Ig) (500 μg/mouse) (c), respectively, 1 day prior to sensitization (day −6) and again on days −3, 1, 2, 5 and 8. Ear swelling was followed 9 days after challenge and is depicted here as the area under curve (AUC). Data are depicted as mean ± standard error of the mean. *P < 0·05, **P < 0·01 and ***P < 0·001, n = 5/group.
Discussion
In this study we investigated the kinetics of Tregs during the normal CHS response in the inflamed ear and in the ear-draining lymph node and characterized the sustained and prolonged inflammatory response observed when Tregs were depleted by administration of an anti-CD25 mAb. During the CHS response, we found that absolute numbers of Tregs in the ear already peaked at day 1 after challenge, and we demonstrated that depletion of Tregs prior to sensitization resulted in a prolonged and sustained inflammation driven mainly by CD8 T cells. The exaggerated inflammation was characterized, in the early phase, by heavy infiltration of neutrophils but changed over time to be dominated by macrophages. In the early phase, the prolonged and sustained inflammatory response in the absence of Tregs was associated with increased levels of cytokines and chemokines locally in the tissue as well as raised systemic levels of acute phase reactants. To our knowledge, this is the first study to characterize the early and the late phases of the inflammatory response after depletion of Tregs in the DNFB-induced CHS model, both with regard to cellular infiltrate as well as local and systemic inflammatory mediators.
The number of Tregs in the inflamed ear was highest 1 day after challenge, demonstrating that at the time where the local inflammation peaked, Tregs were already present in the ear. This observation is in accordance with Tomura et al. 22, who showed that FoxP3+ Treg cells can be found in substantial numbers in the challenged skin 24 h after challenge. Additionally, the same group showed that in the draining lymph node the number of FoxP3+ Tregs peaks 48 h after challenge, which is in accordance with our observations. Furthermore, Lehtimaki et al. 23 also detected Tregs (measured as % FoxP3+ cells out of CD4+ cells) in the inflamed ear. However, they found that the frequency of Tregs peaked 96 h post-challenge. The reason for this discrepancy in kinetic is currently unknown, but might be due to experimental differences. However, as the inflammatory response in the CHS model peaks after 24 h, it seems likely that regulatory mechanisms would already be dominant at this time-point (or even earlier).
Depletion of Tregs resulted in an increased number of CD8 T cells in the inflamed ear both at days 3 and 8 after challenge and depletion of CD8 T cells at day 2 after challenge in the Treg-depleted group significantly suppressed the response. This suggests that exaggerated inflammation is driven by CD8 T cells and is therefore not solely a result of the increased infiltration of neutrophils also observed in the acute phase. This indicates further that CD8 T cells may be a significant target for Tregs although this could, of course, be indirect. Nevertheless, the observation that depletion of Tregs resulted in prolonged activation of T cells has also been described in other animal models 25,26.
The ear-swelling response in the Treg-depleted mice changed from being dominated by neutrophils to a response with an increasing presence of macrophages. Similarly, Frey et al. 27 described an increased number of macrophages, monocytes and osteoclasts in an arthritis model after Treg depletion. How the presence of macrophages in the late phase contributes to the sustained inflammatory response is currently not known.
Tregs exert their immunosuppressive effect by the use of a range of different mechanisms, including inhibitory cytokines, induction of cytolysis and in controlling priming of effector T cells by APCs 28. We observed the highest expression of CTLA-4 at day 1 after challenge compared to days 2 and 4, which could indicate that Tregs play a role in limiting the activation of hapten-specific T cells by APCs which takes place in the dermis of the challenged skin 29. We showed further that treatment with CTLA-4-Ig after Treg depletion suppressed the exaggerated inflammatory response present in the absence of Tregs. In patients with RA, it has been suggested that the suppressive capacity of Tregs is compromised and the proportion of Tregs is reduced 14. Thus, in this context it is interesting that CTLA-4-Ig can limit the immune reaction in an animal with insufficient regulatory T cell capacity. Another important immunoregulatory mechanism of Tregs is the release of IL-10. Surprisingly, we only found moderately decreased levels of IL-10 in the absence of Tregs in the early phase of the response and no change in the IL-10 release in the late phase compared to non-depleted control mice. This suggests that Tregs are not the only source of IL-10, and that other cell types can release IL-10 during CHS. The possibility that IL-10 expression is sustained in the absence of Tregs was also shown by Lehtimaki et al. 23, and it is possible that LCs may provide an additional source of IL-10 during CHS 30. Furthermore, blocking IL-10R in the absence of Tregs did not result in a further exaggerated response, suggesting that IL-10 released in the absence of Tregs does not contribute significantly to immunoregulation during the CHS response.
In conclusion, we have shown that depletion of Tregs in a DNFB-induced CHS model resulted in a sustained and prolonged inflammatory response that changed from being an acute reaction with heavy infiltration of neutrophils to a sustained response with more chronic manifestations such as infiltration of macrophages. The exaggerated inflammatory response was driven by CD8 T cells and was characterized in the early phase by increased levels of cytokines and chemokines locally in the ear as well as raised serum levels of acute phase reactants.
Acknowledgments
This research is the result of a PhD project funded by the Novo Nordisk & LIFE In Vivo Pharmacology Centre (LIFEPHARM). The authors wish to thank Jeanette Juhl, Laboratory Technician, Department of Histology and Bioimaging, Novo Nordisk A/S for excellent work in setting up and conducting the histology and immunohistochemistry. Furthermore, the authors wish to thank the Laboratory Animal Science staff at Novo Nordisk A/S for care of the experimental animals.
Disclosures
A.D. C., P. H. K and C. H. are employees of Novo Nordisk A/S.
Author contributions
A. D. C. performed the experiments, A. D. C. and C. H. designed the study and A. D. C. and C. H. wrote the paper, with significant contributions from S. S. and P. H. K.
Supporting Information
Additional Supportingporting information may be found in the online version of this article at the publisher's web-site:
Fig. S1. Depletion check for CD4 and CD8 T cells.
References
- Gocinski BL, Tigelaar RE. Roles of CD4+ and CD8+ T cells in murine contact sensitivity revealed by in vivo monoclonal antibody depletion. J Immunol. 1990;144:4121–4128. [PubMed] [Google Scholar]
- Bennett CL, Noordegraaf M, Martina CAE, Clausen BE. Langerhans cells are required for efficient presentation of topically applied hapten to T cells. J Immunol. 2007;179:6830–6835. doi: 10.4049/jimmunol.179.10.6830. [DOI] [PubMed] [Google Scholar]
- Bursch LS, Wang L, Igyarto B, et al. Identification of a novel population of Langerin+ dendritic cells. J Exp Med. 2007;204:3147–3156. doi: 10.1084/jem.20071966. [DOI] [PMC free article] [PubMed] [Google Scholar]
- Itakura A, Szczepanik M, Campos RA, et al. An hour after immunization peritoneal B-1 cells are activated to migrate to lymphoid organs where within 1 day they produce IgM antibodies that initiate elicitation of contact sensitivity. J Immunol. 2005;175:7170–7178. doi: 10.4049/jimmunol.175.11.7170. [DOI] [PubMed] [Google Scholar]
- Campos RA, Szczepanik M, Lisbonne M, Itakura A, Leite-de-Moraes M, Askenase PW. Invariant NKT cells rapidly activated via immunization with diverse contact antigens collaborate in vitro with B-1 cells to initiate contact sensitivity. J Immunol. 2006;177:3686–3694. doi: 10.4049/jimmunol.177.6.3686. [DOI] [PubMed] [Google Scholar]
- O'Leary JG, Goodarzi M, Drayton DL, von Andrian UH. T cell- and B cell-independent adaptive immunity mediated by natural killer cells. Nat Immunol. 2006;7:507–516. doi: 10.1038/ni1332. [DOI] [PubMed] [Google Scholar]
- Engeman T, Gorbachev AV, Kish DD, Fairchild RL. The intensity of neutrophil infiltration controls the number of antigen-primed CD8 T cells recruited into cutaneous antigen challenge sites. J Leukoc Biol. 2004;76:941–949. doi: 10.1189/jlb.0304193. [DOI] [PubMed] [Google Scholar]
- Dudeck A, Dudeck J, Scholten J, et al. Mast cells are key promoters of contact allergy that mediate the adjuvant effects of haptens. Immunity. 2011;34:973–984. doi: 10.1016/j.immuni.2011.03.028. [DOI] [PubMed] [Google Scholar]
- Ring S, Oliver SJ, Cronstein BN, Enk AH, Mahnke K. CD4+CD25+ regulatory T cells suppress contact hypersensitivity reactions through a CD39, adenosine-dependent mechanism. J Allergy Clin Immunol. 2009;123:1287–1296. doi: 10.1016/j.jaci.2009.03.022. [DOI] [PubMed] [Google Scholar]
- Ring S, Thome M, Pretsch L, Enk AH, Mahnke K. Expanded murine regulatory T cells: analysis of phenotype and function in contact hypersensitivity reactions. J Immunol Methods. 2007;326:10–21. doi: 10.1016/j.jim.2007.06.007. [DOI] [PubMed] [Google Scholar]
- Ring S, Karakhanova S, Johnson T, Enk AH, Mahnke K. Gap junctions between regulatory T cells and dendritic cells prevent sensitization of CD8(+) T cells. J Allergy Clin Immunol. 2010;125:237–246. doi: 10.1016/j.jaci.2009.10.025. [DOI] [PubMed] [Google Scholar]
- Ring S, Schafer SC, Mahnke K, Lehr HA, Enk AH. CD4+ CD25+ regulatory T cells suppress contact hypersensitivity reactions by blocking influx of effector T cells into inflamed tissue. Eur J Immunol. 2006;36:2981–2992. doi: 10.1002/eji.200636207. [DOI] [PubMed] [Google Scholar]
- Christensen AD, Haase C. Immunological mechanisms of contact hypersensitivity in mice. APMIS. 2012;120:1–27. doi: 10.1111/j.1600-0463.2011.02832.x. [DOI] [PubMed] [Google Scholar]
- Miyara M, Gorochov G, Ehrenstein M, Musset L, Sakaguchi S, Amoura Z. Human FoxP3+ regulatory T cells in systemic autoimmune diseases. Autoimmun Rev. 2011;10:744–755. doi: 10.1016/j.autrev.2011.05.004. [DOI] [PubMed] [Google Scholar]
- Dubois B, Chapat L, Goubier A, Kaiserlian D. CD4+CD25+ T cells as key regulators of immune responses. Eur J Dermatol. 2003;13:111–116. [PubMed] [Google Scholar]
- Saint-Mezard P, Krasteva M, Chavagnac C, et al. Afferent and efferent phases of allergic contact dermatitis (ACD) can be induced after a single skin contact with haptens: evidence using a mouse model of primary ACD. J Invest Dermatol. 2003;120:641–647. doi: 10.1046/j.1523-1747.2003.12093.x. [DOI] [PubMed] [Google Scholar]
- Bouloc A, Cavani A, Katz SI. Contact hypersensitivity in MHC class II-deficient mice depends on CD8 T lymphocytes primed by immunostimulating Langerhans cells. J Invest Dermatol. 1998;111:44–49. doi: 10.1046/j.1523-1747.1998.00236.x. [DOI] [PubMed] [Google Scholar]
- Bour H, Peyron E, Gaucherand M, et al. Major histocompatibility complex class I-restricted CD8+ T cells and class II-restricted CD4+ T cells, respectively, mediate and regulate contact sensitivity to dinitrofluorobenzene. Eur J Immunol. 1995;25:3006–3010. doi: 10.1002/eji.1830251103. [DOI] [PubMed] [Google Scholar]
- Kish DD, Gorbachev AV, Fairchild RL. CD8+ T cells produce IL-2, which is required for CD(4+)CD25+ T cell regulation of effector CD8+ T cell development for contact hypersensitivity responses. J Leukoc Biol. 2005;78:725–735. doi: 10.1189/jlb.0205069. [DOI] [PubMed] [Google Scholar]
- Gorbachev AV, Fairchild RL. CD4+ T cells regulate CD8+ T cell-mediated cutaneous immune responses by restricting effector T cell development through a Fas ligand-dependent mechanism. J Immunol. 2004;172:2286–2295. doi: 10.4049/jimmunol.172.4.2286. [DOI] [PubMed] [Google Scholar]
- Schneider MA, Meingassner JG, Lipp M, Moore HD, Rot A. CCR7 is required for the in vivo function of CD4+ CD25+ regulatory T cells. J Exp Med. 2007;204:735–745. doi: 10.1084/jem.20061405. [DOI] [PMC free article] [PubMed] [Google Scholar]
- Tomura M, Honda T, Tanizaki H, et al. Activated regulatory T cells are the major T cell type emigrating from the skin during a cutaneous immune response in mice. J Clin Invest. 2010;120:883–893. doi: 10.1172/JCI40926. [DOI] [PMC free article] [PubMed] [Google Scholar]
- Lehtimaki S, Savinko T, Lahl K, et al. The temporal and spatial dynamics of Foxp3+ Treg cell-mediated suppression during contact hypersensitivity responses in a murine model. J Invest Dermatol. 2012;132:2744–2751. doi: 10.1038/jid.2012.212. [DOI] [PubMed] [Google Scholar]
- Gaspari AA, Katz SI. Contact hypersensitivity. Curr Protoc Immunol. 2001;Chapter 4:4.2.1–425. doi: 10.1002/0471142735.im0402s08. [DOI] [PubMed] [Google Scholar]
- Frey O, Petrow P, Gajda M, et al. The role of regulatory T cells in antigen-induced arthritis: aggravation of arthritis after depletion and amelioration after transfer of CD4+CD25+ T cells. Arthritis Res Ther. 2005;7:R291–301. doi: 10.1186/ar1484. [DOI] [PMC free article] [PubMed] [Google Scholar]
- Suvas S, Kumaraguru U, Pack CD, Lee S, Rouse BT. CD4+CD25+ T cells regulate virus-specific primary and memory CD8+ T cell responses. J Exp Med. 2003;198:889–901. doi: 10.1084/jem.20030171. [DOI] [PMC free article] [PubMed] [Google Scholar]
- Frey O, Reichel A, Bonhagen K, Morawietz L, Rauchhaus U, Kamradt T. Regulatory T cells control the transition from acute into chronic inflammation in glucose-6-phosphate isomerase-induced arthritis. Ann Rheum Dis. 2010;69:1511–1518. doi: 10.1136/ard.2009.123422. [DOI] [PubMed] [Google Scholar]
- Josefowicz SZ, Lu LF, Rudensky AY. Regulatory T cells: mechanisms of differentiation and function. Annu Rev Immunol. 2012;30:531–564. doi: 10.1146/annurev.immunol.25.022106.141623. [DOI] [PMC free article] [PubMed] [Google Scholar]
- Egawa G, Honda T, Tanizaki H, Doi H, Miyachi Y, Kabashima K. In vivo imaging of T-cell motility in the elicitation phase of contact hypersensitivity using two-photon microscopy. J Invest Dermatol. 2011;131:977–979. doi: 10.1038/jid.2010.386. [DOI] [PubMed] [Google Scholar]
- Igyarto BZ, Jenison MC, Dudda JC, et al. Langerhans cells suppress contact hypersensitivity responses via cognate CD4 interaction and Langerhans cell-derived IL-10. J Immunol. 2009;183:5085–5093. doi: 10.4049/jimmunol.0901884. [DOI] [PMC free article] [PubMed] [Google Scholar]
Associated Data
This section collects any data citations, data availability statements, or supplementary materials included in this article.
Supplementary Materials
Fig. S1. Depletion check for CD4 and CD8 T cells.