

Abstract
The aim of the present study was to identify differentially expressed genes and biological processes associated with periodontitis. In this study, the most significant 200 differentially expressed genes associated with periodontitis were identified using integrated analysis of multiple microarray data in combination with screening for genome-wide relative significance and genome-wide global significance. Gene Ontology (GO) enrichment analysis and pathway analysis were performed using the GO website and Kyoto Encyclopedia of Genes and Genomes (KEGG). A protein-protein interaction (PPI) network was constructed based on the Search Tool for the Retrieval of Interacting Genes/Proteins. The top 200 differentially expressed genes were found to be highly associated with periodontitis. GO enrichment analyses revealed that the identified genes were significantly enriched in terms of response to organic substance, response to wounding and cell migration. The most common term of the KEGG pathway was cytokine-cytokine receptor interaction. PPI network analysis indicated that interleukin (IL)8, IL1β, vascular endothelial growth factor A, intercellular adhesion molecule 1, PTGS2 and CXCL10 were hub genes, which formed numerous interactions with several genes. In conclusion, the present study identified numerous genes that were differentially expressed in periodontitis, as well as determined the biological pathways and PPI network associated with those genes.
Keywords: periodontitis, differentially expressed genes, bioinformatics
Introduction
Periodontitis is a common chronic infection of the supporting tissues of teeth, which has been epidemiologically associated with cardiovascular diseases (1). Previous studies have indicated that periodontitis is more than a localized oral infection and it may have marked effects on systemic health (2,3).
Numerous clinical and scientific studies have provided evidence that the risk of adult periodontitis has a genetic component (4–6). Genetic factors are important for assessing the susceptibility of patients to periodontitis and the rate of its progression, as demonstrated by studies in humans and animals, which have indicated that genetic factors influence general inflammatory and immune responses (7,8). Individuals have differential responses to common environmental stimuli, which is dependent on the genetic profile of an individual (9). Different forms of genes (allelic variants) may induce variations in tissue structure (innate immunity), antibody responses (adaptive immunity) and inflammatory mediators (non-specific inflammation) (10). In order to elucidate the potential effect of a patient’s genetic profile on periodontitis, the contribution of different genes to the pathogenesis of periodontitis must be understood. Therefore, identification of the most important genes that contribute to the development of this disease is essential.
Analyses of differential gene expression, performed using high-throughput experimental methods, such as microarray analysis, have been used in an increasing number of studies in recent years (11,12). At present, a vast quantity of microarray data have been produced and deposited in publically-available data repositories, including Gene Expression Omnibus (GEO; http://www.ncbi.nlm.nih.gov/geo/) (13) and Array Express Archive (http://www.ebi.ac.uk/arrayexpress/) (14). These repositories allow researchers to advance the identification of genetic and diagnostic signatures using data integration and bioinformatics analysis. This may therefore provide insights into the biological mechanisms underlying the development of periodontitis. Demmer et al (15) revealed that 5,295 genes were upregulated and 7,449 genes were downregulated in periodontitis using transcriptome analysis. Gene ontology (GO) analysis identified groups of differently expressed genes (DEGs) in periodontitis, including those involved in apoptosis, antimicrobial humoral responses and antigen presentation. Becker et al (16) also presented a disease-associated mRNA profile, which displayed the potential underlying mechanisms of periodontitis. GO analysis revealed that the regulation of transcripts associated with bacterial response systems were dominant in periodontitis tissues. However, microarray-based biomarkers have had poor translation into clinical practice; furthermore, the results were non-conformal among studies due to small sample sizes.
A robust genetic marker signature may be beneficial to the diagnosis and targeted treatment of periodontitis in clinical practice. In the present study, in order to identify a more credible gene biomarker signature for periodontitis, an integrated analysis of microarray data was performed using a novel model that screened for genome-wide relative significance (GWRS) and genome-wide global significance (GWGS) (17). The present study also aimed to build a more precise target network for periodontitis using the selected biomarkers and then further investigate the identified DEGs through functional enrichment analysis, pathway enrichment analysis and protein-protein interaction (PPI) networks.
Materials and methods
Identification of gene expression datasets
In the present study, DEGs were identified between normal healthy volunteers and periodontitis patients. Between January 2008 and January 2014, three microarray datasets were extracted from the National Center for Biotechnology Information GEO database: GEO access nos. GSE10334 (15), GSE27993 (18) and GSE33774 (16). The experimental protocol for the present study is shown in Fig. 1. The following information was extracted from each identified study: GEO accession number, sample type, platform, number of cases and controls, and gene expression data. Animal studies and studies in which microarray data were uncertain were excluded.
Figure 1.

Experimental protocol of the present study. DEG, differentially expressed genes; GO, gene ontology.
Integrated analysis of DEGs from multiple microarray data
Data pre-processing was performed using the Bioconductor XPS package v1.24.1 (www.bioconductor.org/packages/release/bioc/html/xps.html) (19), which was based on the data analysis framework ROOT v5 (http://root.cern.ch). Probes were excluded when they did not match a corresponding gene symbol; when a probe-set was mapped to multiple genes, all of these genes were given the expression of the probe-set. Maxim-based methods were used to deal with the situations where multiple probe-sets were associated with a gene. Microarry Suite 5 v7.3–35 (Affymetrix, Inc., Santa Clara, CA, USA) was used to compute expression levels. For each dataset, P<0.05 and a false discovery rate value<0.05 were set as the parameters for DEGs.
Integrated analysis of DEGs identified in the three microarray datasets using GWRS and GWGS
The gene signatures were identified using a novel model which measured the GWRS and GWGS of gene expression. The GWRS of a gene was measured using its ranking position on a genome-wide scale based on the differential expression measured in each individual microarray dataset The number of datasets was denoted by n, the number of unique genes across n datasets was denoted by m; GWRS of the i-th gene in the j-th dataset was measured by: , where rij, i=1-m, j=1-n, was the rank number of the i-th gene in the j-th study. GWGS was applied to synthetically analyze multiple microarray studies. The GWGS of a gene was estimated based on its corresponding GWRS across n datasets. GWGS of a gene was calculated by: sir = ∑j=1n ωjsij, where wj represented the relative weight of the j-th dataset. These calculations were performed as previously described (17). A gene with a large GWGS value was considered to be globally significant across multiple independent studies.
In the present study, the degree of differential gene expression was measured by a fold-change based algorithm, which was found to be more suited to measure the significance of differential expression compared with that of other statistical tests which give P-values and the significance analysis of microarray (SAM). The fold-change-based differential expression analysis was conducted using the Linear Models for Microarray Data (LIMMA) package (http://bioinf.wehi.edu.au/limma/) (20). A rank number was assigned to each gene according to its degree of differential expression (in descending order from 1 to m) and equal weight was assigned to each data. The smallest number of genes that may achieve a suitable level of classification performance was 200; therefore, the top 200 genes were selected for further analysis.
Functional and pathway enrichment analysis
In order to further investigate the functions of the DEGs, GO-categories were organized based on the GO database (http://www.geneontology.org/). The enrichment analyses required >5 genes to be present and P<0.01 for a category to be considered significant. In order to further investigate the signaling pathway of the DEGs, pathway analysis based on the Kyoto Encyclopedia of Genes and Genomes (KEGG) database (www.genome.jp/kegg/) was performed. The two analyses were performed using the Database for Annotation, Visualization and Integrated Discovery (DAVID; http://david.abcc.ncifcrf.gov/home.jsp) (21). The significant categories were identified by expression analysis systematic exprorer (EASE) scores, a modified Fisher Exact P-value. The threshold for significance for a category was P<0.05, with >2 genes for the corresponding term.
PPI network construction
The PPI network is a useful research tool for investigating the cellular networks of protein interactions. A PPI network was constructed for the top 200 DEGs. Interaction data were obtained from the Search Tool for the Retrieval of Interacting Genes/Proteins (STRING; http://string.embl.de/). DEGs were then imported into the interaction network and interactions were screened with both end nodes having DEGs. All nodes with the degree ≥1 were reserved. The networks were constructed using Cytoscape 3.1.0 (http://www.cytoscape.org/).
Results
Integrated analysis of DEGs in multiple studies
Information was extracted from the microarray datasets GSE10334, GSE27993 and GSE33774 for 9,925, 8,322 and 6609 genes, respectively, following the exclusion of animal and uncertain data as well as duplicated genes. Following intersection of the microarray datasets, 2,754 common genes were identified. The GWGS values of genes were then applied to the integrated independent microarray data. Genes with large GWGS values were considered to be globally significant across multiple independent studies as genes with larger fold-changes were ranked highly for individual microarray. Following the intersection of the three microarray datasets, the top 200 DEGs were identified (Table I). The expression pattern of the top 10 genes is presented in Fig. 2.
Table I.
Top 200 differentially expressed genes identified by the integrated analysis of three microarray datasets.
| No. | Gene |
|---|---|
| 1 | SLAMF7 |
| 2 | DDX3Y |
| 3 | CD79A |
| 4 | MMP12 |
| 5 | FAM46C |
| 6 | IL8 |
| 7 | SELE |
| 8 | SEL1L3 |
| 9 | APOD |
| 10 | EIF1AY |
| 11 | SLC7A11 |
| 12 | CD27 |
| 13 | MMP7 |
| 14 | ADAM28 |
| 15 | IL1β |
| 16 | LAX1 |
| 17 | IGLJ3 |
| 18 | CSF3 |
| 19 | TNFRSF17 |
| 20 | CD36 |
| 21 | SOCS3 |
| 22 | RPS4Y1 |
| 23 | PIM2 |
| 24 | FLG |
| 25 | FLG2 |
| 26 | SEC11C |
| 27 | PTGS2 |
| 28 | MMP3 |
| 29 | RGS5 |
| 30 | CCL18 |
| 31 | RGS1 |
| 32 | SFRP2 |
| 33 | ZNF215 |
| 34 | YOD1 |
| 35 | CXCL1 |
| 36 | AQP9 |
| 37 | KDM5D |
| 38 | SLC2A3 |
| 39 | ODAM |
| 40 | ALOX15B |
| 41 | HOOK1 |
| 42 | SEL1L |
| 43 | CXCL10 |
| 44 | SGMS2 |
| 45 | IL10RA |
| 46 | TP53AIP1 |
| 47 | XDH |
| 48 | COL1A1 |
| 49 | CYP1B1 |
| 50 | ICAM1 |
| 51 | ENTPD1 |
| 52 | STEAP4 |
| 53 | CLDN20 |
| 54 | RGS2 |
| 55 | SPIN4 |
| 56 | SORBS2 |
| 57 | VPS41 |
| 58 | BAMBI |
| 59 | PCDH18 |
| 60 | BBS10 |
| 61 | WDR74 |
| 62 | CXCL6 |
| 63 | GPR110 |
| 64 | MALAT1 |
| 65 | CXCR4 |
| 66 | TXNDC11 |
| 67 | PLA2G7 |
| 68 | KCNJ2 |
| 69 | EVI2B |
| 70 | IFI44L |
| 71 | SELL |
| 72 | NRCAM |
| 73 | NR4A2 |
| 74 | GLCCI1 |
| 75 | PANX1 |
| 76 | BTG2 |
| 77 | CRISP3 |
| 78 | ABCA8 |
| 79 | MYADM |
| 80 | PDK4 |
| 81 | PLAUR |
| 82 | BPGM |
| 83 | LAMC2 |
| 84 | ROR1 |
| 85 | PRDM1 |
| 86 | ICK |
| 87 | IFIT5 |
| 88 | FMO1 |
| 89 | ABCA12 |
| 90 | STARD5 |
| 91 | AVPI1 |
| 92 | ARG1 |
| 93 | VEGFA |
| 94 | SELK |
| 95 | CEACAM7 |
| 96 | PSPH |
| 97 | HBB |
| 98 | ALDH1L2 |
| 99 | BHLHE41 |
| 100 | SLC16A9 |
| 101 | BNC1 |
| 102 | KRT19 |
| 103 | FCGR2A |
| 104 | STK39 |
| 105 | IL1A |
| 106 | CTGF |
| 107 | SLC7A5 |
| 108 | EPCAM |
| 109 | ZNF273 |
| 110 | DUSP5 |
| 111 | MMP1 |
| 112 | HLA-DQB1 |
| 113 | GATM |
| 114 | F13A1 |
| 115 | TNFRSF19 |
| 116 | ADAM12 |
| 117 | STXBP5 |
| 118 | LYRM2 |
| 119 | FOSB |
| 120 | IFIT1 |
| 121 | PVRL4 |
| 122 | MAN1A1 |
| 123 | CDH19 |
| 124 | TTC39A |
| 125 | NEFM |
| 126 | PIGW |
| 127 | EIF2AK2 |
| 128 | CFB |
| 129 | STX11 |
| 130 | GBP1 |
| 131 | SLC39A8 |
| 132 | DDX60L |
| 133 | ELTD1 |
| 134 | CYP4X1 |
| 135 | ACTA2 |
| 136 | GBP2 |
| 137 | DLX5 |
| 138 | SOSTDC1 |
| 139 | OAS1 |
| 140 | TSPAN11 |
| 141 | TNFRSF12A |
| 142 | ALYREF |
| 143 | NID1 |
| 144 | SPAG17 |
| 145 | LCE2B |
| 146 | PNLIPRP3 |
| 147 | PLEKHM3 |
| 148 | CHD9 |
| 149 | PARM1 |
| 150 | EPHA4 |
| 151 | CNIH4 |
| 152 | SFRP4 |
| 153 | ANKRD22 |
| 154 | EXOC5 |
| 155 | CORIN |
| 156 | MS4A6A |
| 157 | MYO5B |
| 158 | ANXA3 |
| 159 | ZFAND2A |
| 160 | BGN |
| 161 | PLP1 |
| 162 | GLT8D2 |
| 163 | SERPINE1 |
| 164 | CRIP2 |
| 165 | PALMD |
| 166 | TMEM117 |
| 167 | JUND |
| 168 | CISD2 |
| 169 | RNASE1 |
| 170 | FAM103A1 |
| 171 | CXCL12 |
| 172 | STK17A |
| 173 | CORO1A |
| 174 | IGJ |
| 175 | MMP13 |
| 176 | CALCRL |
| 177 | A2M |
| 178 | CORO1C |
| 179 | TGFBR3 |
| 180 | GSTM1 |
| 181 | TRIM5 |
| 182 | FGFBP1 |
| 183 | BMP2K |
| 184 | OLFML1 |
| 185 | UFM1 |
| 186 | SERPINB9 |
| 187 | PMP22 |
| 188 | FMO2 |
| 189 | TRIM13 |
| 190 | HIST2H2BE |
| 191 | C15orf41 |
| 192 | PHACTR2 |
| 193 | TCEA3 |
| 194 | CDK8 |
| 195 | CD177 |
| 196 | CACHD1 |
| 197 | SELP |
| 198 | ADH7 |
| 199 | EEA1 |
| 200 | HSPA4L |
IL, interleukin; VEGFA, vascular endothelial growth factor A; ICAM1, intercellular adhesion molecule 1.
Figure 2.
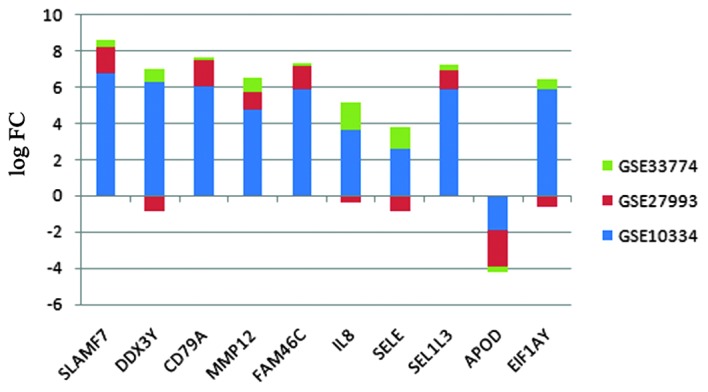
Expression pattern of the top 10 ranked differentially expressed genes identified by the integrated analysis of three microarray databases. FC, fold change.
Functional and pathway enrichment analysis
In order to further investigate the functions of the identified top 200 genes, pathway and GO analysis were performed. A total of 135 terms were retrieved from the DAVID database.
Pathway analysis revealed genes that were significantly enriched in six terms; the most common three terms were those involved in cytokine-cytokine receptor interactions (P=2.6×10⁻⁶), cell adhesion molecules (P=1.1×10⁻²) and complement and coagulation cascades (P=1.6×10⁻²) (Table II).
Table II.
Pathway analysis based on the Kyoto Encyclopedia of Genes and Genomes.
| Term | P-value | Count |
|---|---|---|
| Cytokine-cytokine receptor interaction | 2.60E-06 | 16 |
| Cell adhesion molecules | 1.10E-02 | 7 |
| Complement and coagulation cascades | 1.60E-02 | 5 |
| Intestinal immune network for Immunoglobulin A production | 3.20E-02 | 4 |
| Chemokine signaling pathway | 4.80E-02 | 7 |
| Drug metabolism | 5.70E-02 | 4 |
GO analysis revealed that the identified genes were predominantly involved in biological processes of immune response (P=6.6×10⁻⁹), response to organic substances (P=1.1×10⁻⁵) and response to wounding (P=1.3×10⁻⁵). The top 10 GO terms are shown in Table III.
Table III.
Top 10 GO terms of the top 200 differentially expressed genes.
| ID | Term | P-value | Count |
|---|---|---|---|
| GO:0006955 | Immune response | 6.60E-09 | 29 |
| GO:0010033 | Response to organic substance | 1.10E-05 | 24 |
| GO:0009611 | Response to wounding | 1.30E-05 | 20 |
| GO:0016477 | Cell migration | 9.60E-05 | 13 |
| GO:0006935 | Chemotaxis | 1.10E-04 | 10 |
| GO:0042330 | Taxis | 1.10E-04 | 10 |
| GO:0051674 | Localization of cell | 2.60E-04 | 13 |
| GO:0048870 | Cell motility | 2.60E-04 | 13 |
| GO:0032963 | Collagen metabolic process | 2.90E-04 | 5 |
| GO:0042127 | Regulation of cell proliferation | 3.30E-04 | 22 |
Structure interaction network of the DEGs
Based on the STRING database, the interaction networks of the identified DEGs were constructed, which consisted of 332 edges (biological associations) and 106 nodes (genes that form associations) (Fig. 3). Genes with a high degree of association included interleukin (IL)8, IL1β, vascular endothelial growth factor A (VEGFA), intercellular adhesion molecule 1 (ICAM1), PTGS2 and CXCL10. Genes with degrees >10 in the PPI network are show in Table IV.
Figure 3.

Protein-protein interaction networks of the top 200 differentially expressed genes identified by the integrated analysis of three microarray databases. Each biological relationship (an edge) between two genes (nodes) is supported by at least one reference from the literature or information stored in the Search Tool for the Retrieval of Interacting Genes/Proteins Base. The degree for each gene is represented by the size of the gene node.
Table IV.
Genes with degrees >10 in the protein-protein interactions network.
| Gene | Degree |
|---|---|
| IL8 | 28 |
| IL1β | 25 |
| VEGFA | 24 |
| ICAM1 | 22 |
| PTGS2, CXCL10 | 21 |
| MMP1, CXCR4 | 17 |
| CXCL12 | 16 |
| COL1A1, CSF3 | 15 |
| IL1A, SERPINE1 | 14 |
| CD79A, SELL, PLAUR, MMP3 | 13 |
| CXCL1, CTGF | 12 |
| SELP, SELE, MMP12, A2M | 11 |
IL, interleukin; VEGFA, vascular endothelial growth factor A; ICAM1, intercellular adhesion molecule 1.
Discussion
GWGS has been demonstrated to be a reliable method for comparing microarray data from different sources and studies (17). Based on this strategy, the analysis of the present study focused on significantly DEGs in order to reveal the transcriptional responses of each periodontitis sample. The results of this analysis indicated that these genes were enriched in cytokine-cytokine receptor interactions, cell adhesion molecules as well as complement and coagulation cascades.
Hub nodes are genes highly connected with other genes and have been identified to have important roles in numerous networks. In addition, highly connected hub genes were proposed to have an important role in biological development (22). Hub nodes have more complex interactions compared with those of other genes, which indicates that they have pivotal roles in the underlying mechanisms of disease. Identification of the hub genes involved in periodontitis may lead to the development of effective diagnostic and therapeutic approaches for periodontitis. In the present study, DEGs, which were algorithmically predicted to be biomarkers for periodontitis using GWGS, were found in high levels within patients with periodontitis. In addition, certain identified biomarkers, including IL8, IL1β, ICAM1 and VEGFA, were hub genes, therefore suggesting that they may be useful diagnostic markers for periodontitis.
In the present study, the IL8 gene had a degree of 28, which was the highest degree in the PPI network. IL8 is a member of the family of chemokines that mediates the activation and migration of neutrophils from peripheral blood into tissues (23). IL8 expression may be induced by IL18 in natural killer cells, which was reported to be inhibited by tumor necrosis factor binding protein (24). Kimata et al (25) demonstrated that IL8 selectively inhibited immunoglobulin (Ig)E and IgG4, which were induced by IL4; however, IL8 exerted no effects on the production of IgM, IgG1, IgA, IgG2 and IgG3. A previous study suggested that chronic stress was associated with increased IL8 levels (26). This was consistent with another study, which reported that individuals with high levels of trait anxiety were more prone to periodontal disease (27).
IL1β is also a potent pro-inflammatory cytokine, which is upregulated by radiation and is involved in the regulation of other inflammation-associated molecules (28). In cultured human umbilical vein endothelial cells, IL1β activated VCAM-1 gene expression (29). Several previous studies have demonstrated strong associations between the high frequency of genetic polymorphism in IL1β and the development of severe chronic periodontitis (30–32). Gursoy et al (33)revealed that IL1β was the only biomarker associated with periodontitis among the salivary cytokines and enzymes tested. In addition, IL1β polymorphisms were reported to be associated with an increased risk of cancer (34,35).
In the present study, the VEGFA gene was also found to have a high degree of 24 in the PPI network. VEGFA is the predominant mediator of angiogenesis in the VEGF family (36) and is essential for chondrocyte survival during bone development (37). A previous study demonstrated that VEGFA stimulated lymphangiogenesis and hemangiogenesis in inflammatory neovascularization via macrophage recruitment (38). In a study by Kasprzak et al (39) VEGF was overexpressed in patients with chronic periodontitis, suggesting its significance in protracting the inflammatory process or periodic exacerbations of the process and the destruction of the periodeontium. In addition, Tian et al (40) reported that the genotypes of VEGF and its protein production were associated with chronic periodontitis in a Chinese population. Furthermore, VEGFs were also found to have an important role in neurodegeneration (41).
ICAM1 was reported to have a role in the onset and manifestation of the inflammatory responses. ICAM1 was identified as a co-stimulatory ligand, which bound to lymphocyte function-associated antigen-1 (42); in addition, ICAM1 was reported to contribute to the adhesion of T lymphocytes to chondrocytes (43). A previous study demonstrated that ICAM1 was highly expressed in infected gingival cells as well as in tissues from periodontitis patients compared with those from healthy controls (44). Nedbal et al (45) suggested that the local topical applications of ICAM1-directed antisense oligonucleotides may be used as an effective therapeutic tool against the inflammatory processes of the human gingival. Furthermore, ICAM1 expression has been reported to be associated with other diseases including Alzheimer’s Disease (46) and cancer (47).
In conclusion, the present study identified several DEGs associated with periodontitis, as well as the functions and signaling pathways in which these genes were involved. Comprehensive network analyses of the dysregulated gene expression in periodontitis identified a series of hub genes that had high degrees of PPI in this network. This PPI network was therefore proposed to reflect the interaction of genes in the periodontitis-specific micro-environment. In addition, the hub genes identified may be potential useful diagnostic markers and novel therapeutic targets for periodontitis.
References
- 1.Loos BG, Craandijk J, Hoek FJ, et al. Elevation of systemic markers related to cardiovascular diseases in the peripheral blood of periodontitis patients. J Periodontol. 2000;71:1528–1534. doi: 10.1902/jop.2000.71.10.1528. [DOI] [PubMed] [Google Scholar]
- 2.Iacopino AM, Cutler CW. Pathophysiological relationships between periodontitis and systemic disease: recent concepts involving serum lipids. J Periodontol. 2000;71:1375–1384. doi: 10.1902/jop.2000.71.8.1375. [DOI] [PubMed] [Google Scholar]
- 3.Iacopino AM. Periodontitis and diabetes interrelationships: role of inflammation. Ann Periodontol. 2001;6:125–137. doi: 10.1902/annals.2001.6.1.125. [DOI] [PubMed] [Google Scholar]
- 4.Michalowicz BS, Diehl SR, Gunsolley JC, et al. Evidence of a substantial genetic basis for risk of adult periodontitis. J Periodontol. 2000;71:1699–1707. doi: 10.1902/jop.2000.71.11.1699. [DOI] [PubMed] [Google Scholar]
- 5.Divaris K, Monda KL, North KE, et al. Exploring the genetic basis of chronic periodontitis: a genome-wide association study. Hum Mol Genet. 2013;22:2312–2324. doi: 10.1093/hmg/ddt065. [DOI] [PMC free article] [PubMed] [Google Scholar]
- 6.Grigoriadou ME, Koutayas SO, Madianos PN, Strub JR. Interleukin-1 as a genetic marker for periodontitis: review of the literature. Quintessence Int. 2010;41:517–525. [PubMed] [Google Scholar]
- 7.Scapoli L, Girardi A, Palmieri A, Carinci F, Testori T, Zuffetti F, Monguzzi R, Lauritano D. IL6 and IL10 are genetic susceptibility factors of periodontal disease. Dent Res J (Isfahan) 2012;9(Suppl 2):S197–S201. doi: 10.4103/1735-3327.109754. [DOI] [PMC free article] [PubMed] [Google Scholar]
- 8.Zhang N, Xu Y, Zhang B, Zhang T, Yang H, Feng Z, Zhong D. Analysis of interleukin-8 gene variants reveals their relative importance as genetic susceptibility factors for chronic periodontitis in the Han population. PLoS One. 2014;9:e104436. doi: 10.1371/journal.pone.0104436. [DOI] [PMC free article] [PubMed] [Google Scholar]
- 9.Mercado FB, Marshall RI, Klestov AC, Bartold PM. Relationship between rheumatoid arthritis and periodontitis. J Periodontol. 2001;72:779–787. doi: 10.1902/jop.2001.72.6.779. [DOI] [PubMed] [Google Scholar]
- 10.Kinane DF, Hart TC. Genes and gene polymorphisms associated with periodontal disease. Crit Rev Oral Biol Med. 2003;14:430–449. doi: 10.1177/154411130301400605. [DOI] [PubMed] [Google Scholar]
- 11.Wray CJ, Ko TC, Tan FK. Secondary use of existing public microarray data to predict outcome for hepatocellular carcinoma. J Surg Res. 2014;188:137–42. doi: 10.1016/j.jss.2013.12.013. [DOI] [PubMed] [Google Scholar]
- 12.Lee S, Stewart S, Nagtegaal I, Luo J, Wu Y, Colditz G, Medina D, Allred DC. Differentially expressed genes regulating the progression of ductal carcinoma in situ to invasive breast cancer. Cancer Res. 2012;72:4574–4586. doi: 10.1158/0008-5472.CAN-12-0636. [DOI] [PMC free article] [PubMed] [Google Scholar]
- 13.Barrett T, Troup DB, Wilhite SE, et al. NCBI GEO: archive for functional genomics data sets - 10 years on. Nucleic Acids Res. 2011;39:D1005–D1010. doi: 10.1093/nar/gkq1184. [DOI] [PMC free article] [PubMed] [Google Scholar]
- 14.Parkinson H, Kapushesky M, Shojatalab M, et al. Array Express - a public database of microarray experiments and gene expression profiles. Nucleic Acids Res. 2007;35:D747–D750. doi: 10.1093/nar/gkl995. [DOI] [PMC free article] [PubMed] [Google Scholar]
- 15.Demmer RT, Behle JH, Wolf DL, et al. Transcriptomes in healthy and diseased gingival tissues. J Periodontol. 2008;79:2112–2124. doi: 10.1902/jop.2008.080139. [DOI] [PMC free article] [PubMed] [Google Scholar]
- 16.Becker ST, Beck-Broichsitter BE, Graetz C, Dörfer CE, Wiltfang J, Häsler R. Peri-implantitis versus periodontitis: functional differences indicated by transcriptome profiling. Clin Implant Dent Relat Res. 2014;16:401–411. doi: 10.1111/cid.12001. [DOI] [PubMed] [Google Scholar]
- 17.Liu W, Peng Y, Tobin DJ. A new 12-gene diagnostic biomarker signature of melanoma revealed by integrated microarray analysis. Peer J. 2013;1:e49. doi: 10.7717/peerj.49. [DOI] [PMC free article] [PubMed] [Google Scholar]
- 18.Miosge N. Expression data from human periodontal ligament. Gene Expression Omnibus [Database] 2011 [Google Scholar]
- 19.Stratowa C. Introduction to the xps Package: Overview. 2013. [Google Scholar]
- 20.Smyth GK. Linear models and empirical bayes methods for assessing differential expression in microarray experiments. Stat Appl Genet Mol Biol. 2004;3 doi: 10.2202/1544-6115.1027. Article3. [DOI] [PubMed] [Google Scholar]
- 21.Huang da W, Sherman BT, Lempicki RA. Systematic and integrative analysis of large gene lists using DAVID bioinformatics resources. Nat Protoc. 2009;4:44–57. doi: 10.1038/nprot.2008.211. [DOI] [PubMed] [Google Scholar]
- 22.Langfelder P, Mischel PS, Horvath S. When is hub gene selection better than standard meta-analysis? PloS One. 2013;8:e61505. doi: 10.1371/journal.pone.0061505. [DOI] [PMC free article] [PubMed] [Google Scholar]
- 23.Puthothu B, Krueger M, Heinze J, Forster J, Heinzmann A. Impact of IL8 and IL8-receptor alpha polymorphisms on the genetics of bronchial asthma and severe RSV infections. Clin Mol Allergy. 2006;4:2. doi: 10.1186/1476-7961-4-2. [DOI] [PMC free article] [PubMed] [Google Scholar]
- 24.Puren AJ, Fantuzzi G, Gu Y, Su MS, Dinarello CA. Interleukin-18 (IFNgamma-inducing factor) induces IL8 and IL1beta via TNFalpha production from non-CD14+ human blood mononuclear cells. J Clin Invest. 1998;101:711–721. doi: 10.1172/JCI1379. [DOI] [PMC free article] [PubMed] [Google Scholar]
- 25.Kimata H, Yoshida A, Ishioka C, Lindley I, Mikawa H. Interleukin 8 (IL8) selectively inhibits immunoglobulin E production induced by IL4 in human B cells. J Exp Med. 1992;176:1227–1231. doi: 10.1084/jem.176.4.1227. [DOI] [PMC free article] [PubMed] [Google Scholar]
- 26.Shahzad MM, Arevalo JM, Armaiz-Pena GN, et al. Stress effects on FosB-and interleukin-8 (IL8)-driven ovarian cancer growth and metastasis. J Biol Chem. 2010;285:35462–35470. doi: 10.1074/jbc.M110.109579. [DOI] [PMC free article] [PubMed] [Google Scholar]
- 27.Vettore MV, Leão AT, Monteiro Da, Silva AM, Quintanilha RS, Lamarca GA. The relationship of stress and anxiety with chronic periodontitis. J Clin Priodontol. 2003;30:394–402. doi: 10.1034/j.1600-051X.2003.10271.x. [DOI] [PubMed] [Google Scholar]
- 28.Liu W, Ding I, Chen K, et al. Interleukin 1β (IL1β ) signaling is a critical component of radiation-induced skin fibrosis. Radiat Res. 2006;165:181–191. doi: 10.1667/RR3478.1. [DOI] [PubMed] [Google Scholar]
- 29.Marui N, Offermann MK, Swerlick R, et al. Vascular cell adhesion molecule-1 (VCAM-1) gene transcription and expression are regulated through an antioxidant-sensitive mechanism in human vascular endothelial cells. J Clin Invest. 1993;92:1866–1874. doi: 10.1172/JCI116778. [DOI] [PMC free article] [PubMed] [Google Scholar]
- 30.Tawil G, Akl FA, Dagher MF, Karam W, Abdallah Hajj Hussein I, Leone A, Jurjus AR. Prevalence of IL-1beta +3954 and IL-1α-889 polymorphisms in the Lebanese population and its association with the severity of adult chronic periodontitis. J Biol Regul Homeost Agents. 2012;26:597–606. [PubMed] [Google Scholar]
- 31.Tsarev VN, Nikolaeva EN. Polymorphism of IL1α and IL1β genes and bacterial invasion in patients with chronic generalized periodontitis. Stomatologiia (Mosk) 2010;89:19–23. (In Russian) [PubMed] [Google Scholar]
- 32.Gayathri R, Saadi AV, Bhat KM, Bhat SG, Satyamoorthy K. Allele, genotype, and composite genotype effects of IL-1A +4845 and IL-1B +3954 polymorphisms for chronic periodontitis in an Indian population. Indian J Dent Res. 2011;22:612. doi: 10.4103/0970-9290.90323. [DOI] [PubMed] [Google Scholar]
- 33.Gursoy UK, Könönen E, Uitto VJ, Pussinen PJ, Hyvärinen K, Suominen-Taipale L, Knuuttila M. Salivary interleukin-1beta concentration and the presence of multiple pathogens in periodontitis. J Clin Periodontol. 2009;36:922–927. doi: 10.1111/j.1600-051X.2009.01480.x. [DOI] [PubMed] [Google Scholar]
- 34.Al-Moundhri MS, Al-Nabhani M, Al-Bahrani B, et al. Interleukin-1β gene (IL1B) and interleukin 1 receptor antagonist gene (IL1RN) polymorphisms and gastric cancer risk in an Omani Arab population. Gastric Cancer. 2006;9:284–290. doi: 10.1007/s10120-006-0392-5. [DOI] [PubMed] [Google Scholar]
- 35.Xu J, Yin Z, Cao S, et al. Systematic review and meta-analysis on the association between IL1B polymorphisms and cancer risk. PloS One. 2013;8:e63654. doi: 10.1371/journal.pone.0063654. [DOI] [PMC free article] [PubMed] [Google Scholar]
- 36.Ghosh R, Lipson KL, Sargent KE, et al. Transcriptional regulation of VEGF-A by the unfolded protein response pathway. PloS One. 2010;5:e9575. doi: 10.1371/journal.pone.0009575. [DOI] [PMC free article] [PubMed] [Google Scholar]
- 37.Zelzer E, Mamluk R, Ferrara N, Johnson RS, Schipani E, Olsen BR. VEGFA is necessary for chondrocyte survival during bone development. Development. 2004;131:2161–2171. doi: 10.1242/dev.01053. [DOI] [PubMed] [Google Scholar]
- 38.Cursiefen C, Chen L, Borges LP, et al. VEGF-A stimulates lymphangiogenesis and hemangiogenesis in inflammatory neovascularization via macrophage recruitment. J Clin Invest. 2004;113:1040–1050. doi: 10.1172/JCI20465. [DOI] [PMC free article] [PubMed] [Google Scholar]
- 39.Kasprzak A, Surdacka A, Tomczak M, Przybyszewska W, Seraszek-Jaros A, Malkowska-Lanzafame A, Siodla E, Kaczmarek E. Expression of angiogenesis-stimulating factors (VEGF, CD31, CD105) and angiogenetic index in gingivae of patients with chronic periodontitis. Folia Histochem Cytobiol. 2012;50:554–564. doi: 10.5603/FHC.2012.0078. [DOI] [PubMed] [Google Scholar]
- 40.Tian Y, Li JL, Hao L, et al. Association of cytokines, high sensitive C-reactive protein, VEGF and beta-defensin-1 gene polymorphisms and their protein expressions with chronic periodontitis in the Chinese population. Int J Biol Markers. 2013;28:100–107. doi: 10.5301/jbm.5000010. [DOI] [PubMed] [Google Scholar]
- 41.Storkebaum E, Carmeliet P. VEGF: a critical player in neurodegeneration. J Clin Invest. 2004;113:14–18. doi: 10.1172/JCI20682. [DOI] [PMC free article] [PubMed] [Google Scholar]
- 42.Lebedeva T, Dustin ML, Sykulev Y. ICAM-1 co-stimulates target cells to facilitate antigen presentation. Cur Opin Immunol. 2005;17:251–258. doi: 10.1016/j.coi.2005.04.008. [DOI] [PubMed] [Google Scholar]
- 43.Kienzle G, von Kempis J. Vascular cell adhesion molecule 1 (CD106) on primary human articular chondrocytes: functional regulation of expression by cytokines and comparison with intercellular adhesion molecule 1 (CD54) and very late activation antigen 2. Arthritis Rheum. 1998;41:1296–1305. doi: 10.1002/1529-0131(199807)41:7<1296::AID-ART21>3.0.CO;2-8. [DOI] [PubMed] [Google Scholar]
- 44.Umeda JE, Demuth DR, Ando ES, Faveri M, Mayer MP. Signaling transduction analysis in gingival epithelial cells after infection with Aggregatibacter actinomycetemcomitans. Mol Oral Microbiol. 2012;27:23–33. doi: 10.1111/j.2041-1014.2011.00629.x. [DOI] [PMC free article] [PubMed] [Google Scholar]
- 45.Nedbal W, Tomakidi P, Lehmann MJ, Dorfer C, Kohl A, Sczakiel G. Antisense-mediated inhibition of ICAM-1 expression: a therapeutic strategy against inflammation of human periodontal tissue. Antisense Nucleic Acid Drug Dev. 2002;12:71–78. doi: 10.1089/108729002760070812. [DOI] [PubMed] [Google Scholar]
- 46.Mattila KM, Hiltunen M, Rinne JO, et al. Absence of association between an intercellular adhesion molecule 1 gene E469K polymorphism and Alzheimer’s disease in Finnish patients. Neurosci Lett. 2003;337:61–63. doi: 10.1016/S0304-3940(02)01296-X. [DOI] [PubMed] [Google Scholar]
- 47.Usami Y, Ishida K, Sato S, et al. Intercellular adhesion molecule-1 (ICAM-1) expression correlates with oral cancer progression and induces macrophage/cancer cell adhesion. Int J Cancer. 2013;133:568–578. doi: 10.1002/ijc.28066. [DOI] [PubMed] [Google Scholar]