

Abstract
Rationale and Objectives
A number of studies have reported decreases in fractional anistropy (FA) in amyotrophic lateral sclerosis using diffusion tensor imaging (DTI). The purpose of this study was to perform a meta-analysis in order to estimate the diagnostic test accuracy measures of DTI for the diagnosis of amyotrophic lateral sclerosis (ALS).
Materials and Methods
We searched MEDLINE (1966–April 2011), EMBASE (1999–April 2011), CINAHL (1999–April 2011), and Cochrane (2005–April 2011) databases to identify studies that measured FA in ALS subjects. Human, single-center studies using a DTI region of interest (ROI) or tractography techniques were used to compare FA values along the brain corticospinal tracts between ALS subjects and healthy controls. There were no language restrictions. Independent extraction of articles by 2 authors using predefined data fields including study quality indicators. We identified 30 case-control studies that used region of interest or tractography DTI techniques. We applied binormal receiver operative characteristic (ROC) curve analysis to assign specificity and sensitivity for each study. We applied the bivariate mixed-effects regression model using the Markov Chain Monte Carlo Simulation to calculate summary estimates for the sensitivity and specificity. We used the metan module in Stata, version 11.0, to calculate the area under the ROC curve, diagnostic odds ratio and the test effectiveness summary estimates.
Results
The pooled sensitivity was 0.65 (95% CI 0.61–0.69); the pooled specificity, 0.67 (95% CI 0.63–0.72); the pooled diagnostic odds ratio, 1.88 (95% CI 1.46–2.30); the pooled test effectiveness, 1.04 (95% CI 0.81–1.27); and the pooled area under the ROC curve, 0.76 (95% CI 0.71–0.81). Subanalyses comparing magnetic resonance imaging (MRI) field strength (1.5T vs. 3.0T) and brain location (corticospinal tract average vs. internal capsule) revealed no significant differences in the test accuracy measures. Reference standard used for the diagnosis of ALS was the El Escorial criteria. There was at least moderate heterogeneity between the studies. True study quality is uncertain.
Conclusion
The discriminatory capability of DTI to make a diagnosis of ALS is only modest. There were no significant differences in the diagnostic test accuracy summary estimates with respect to MRI field strength or brain location.
Keywords: Amyotrophic lateral sclerosis, magnetic resonance imaging, diffusion tensor imaging, meta-analysis
Amyotrophic lateral sclerosis (ALS), a neurodegenerative condition of the corticospinal tract and spinal anterior horn cells, presents with varying degrees of lower motor neuron (LMN) and upper motor neuron (UMN) signs (1,2). The incidence of ALS is estimated to be 1.5–2.7 per 100,000 (3), with a uniformly fatal outcome. Mean survival of 2–4 years after initial diagnosis has been reported (4). Delay between onset of symptoms and diagnosis reaches one year (5), which in part is due to an absence of reliable biomarkers. Thus, objective diagnostic tests to establish and corroborate extent of UMN disease are needed (6).
Diffusion tensor imaging (DTI), an advanced neuroimaging technique, quantifies the local microenvironmental characteristics of water diffusion and evaluates the integrity of white matter fiber tracts (7). DTI holds promise as a potential biomarker to detect the pathologic changes in ALS, particularly UMN involvement (8). One of the key measurements provided by DTI is the fractional anisotropy (FA), which provides a scalar measurement of the degree of water diffusion (9). When the integrity of the white matter tracts is compromised by disease processes that interfere with water diffusion directionality, the FA is reduced (10,11). Over the past decade, a number of published studies have described decreases in the FA of the brain’s corticospinal tract in ALS. However, the vast majority of the publications do not report the test accuracy of DTI to differentiate between diseased and nondiseased populations. In particular, the diagnostic value of DTI in patients presenting with possible or “early” signs of ALS is unknown. If the diagnostic test accuracy measures of this advanced neuroimaging technique are adequate, DTI could be used in the clinical workup of suspected ALS similar to electromyography. The purpose of this study was to aggregate the reported data across the different studies and to estimate summary diagnostic test accuracy measures of DTI in the diagnosis of ALS using standard meta-analysis techniques. Our secondary aims were to investigate study-specific sources of heterogeneity in test accuracy measures.
METHODS
Study Search Strategy
We performed a computerized search to identify relevant articles in MEDLINE (1966–April 2011), EMBASE (1999–April 2011), CINAHL (1999–April 2011), and Cochrane databases (2005–April 2011). For the MEDLINE search, we used the following combination of keywords: [amyotrophic lateral sclerosis or Lou Gehrig’s disease to include all subheadings] and [magnetic resonance imaging or diagnostic imaging or diffusion magnetic resonance imaging or diffusion tensor imaging or fractional anisotropy or anisotropy to include all subheadings]. For the EMBASE search, we used the following combination of keywords: [amyotrophic lateral sclerosis to include all subheadings] and [nuclear magnetic resonance imaging or diagnostic imaging or diffusion tensor imaging or fractional anisotropy to include all subheadings]. For the CINAHL and Cochrane database searches, we used the search words: amyotrophic lateral sclerosis, Lou Gehrig’s disease, imaging, diagnostic imaging, magnetic resonance imaging, diffusion, fractional anisotropy, and diagnostic tests. The results were imported into RefWorks and duplicate references purged. There were no language restrictions. We combined this strategy with a manual search of reference lists from identified articles.
Study Selection
We included a study if it satisfied the following criteria: single-center human studies using DTI region of interest (ROI) or tractography techniques to compare FA values along the brain corticospinal tracts between ALS subjects and healthy controls (HC). The study had to be of an original patient group; follow-up articles based on the same patient group were identified and excluded. Publications that used only voxel based morphometry analysis methods and case studies with fewer than 4 subjects were also excluded. Where data were missing or only graphs provided, we emailed the listed corresponding author twice over a period of 2 weeks for the relevant information.
Data Extraction
Two authors (B.R.F., M.P.) independently evaluated each abstract for inclusion. Next, we obtained full publications for further assessment and data extraction. Two authors (B.R.F., M.P.) independently reviewed each article and reached a final consensus for inclusion. Two investigators (B.R.F., M.P.) abstracted the information from the eligible articles: author, journal, year of publication, number of subjects, demographic and clinical characteristics of subjects, method of FA analysis including brain location, magnetic resonance imaging (MRI) field strength, and the respective mean and standard deviation of fractional anisotropy values for ALS subjects and healthy controls.
Assessment of Methodologic Quality
Two reviewers (B.R.F., M.P.) independently assessed the quality of each study according to the QUADAS criteria (12). These criteria assessed that there were: adequate index test description, adequate reference standard likely to correctly classify disease, adequate reference test description, blinded interpretation of index test, no differential verification bias, no incorporation bias, no partial verification bias, representative spectrum of diseased patients who will receive the test in practice, selection criteria clearly described, short period between index and reference tests and whether uninterpretable test results were reported. Each of these criteria were scored as “yes,” “no,” or “unclear.” In particular, studies that only studied probable or definite diagnosis of ALS by El Escorial criteria (13) were not considered to have a representative disease spectrum. Any disagreements in abstracted results between the reviewers were resolved by discussion and consensus.
Statistical Analysis
Study level analysis
The statistical analysis occurred at the group level because the studies compared average FA values between ALS subjects and HCs. We applied a binormal receiver operating characteristic (ROC) curve analysis to assign cutoff values for the specificity and sensitivity based on the cumulative probability function of the standard normal distribution (14). We assumed equal variance between diseased and nondiseased groups in calculating the threshold for definition of positive test results (15). The specificity and sensitivity values were then estimated. The ROC curve and the area under the binormal ROC curve were then calculated for each study using the respective cutoff values for the specificity and sensitivity. The diagnostic odds ratio and test effectiveness (16) were determined for each study. The 95% confidence intervals for each diagnostic test measure were also calculated.
Meta-analysis model
We applied the bivariate mixed-effects regression model using the Markov Chain Monte Carlo simulation and Gibbs sampling to calculate summary estimates for the sensitivity and specificity (17). For logit transforms of sensitivity and specificity, we assumed independent binomial distributions. We chose Bayesian methodology because in the presence of sparse data, likelihood methods fail to converge (18). Further, when parameters are on their boundary space, estimates of between study correlations are inaccurate (19). To allow the estimates to depend solely on data and provide equivalence to likelihood estimates, we used noninformative priors. Convergence was monitored using trace plots (20). We used the metan module in Stata, version 11.0, to calculate the summary estimates for the area under the ROC curve (AUC), diagnostic odds ratio, and the test effectiveness. The data were intrinsically weighted by using the individual study variances. In addition, subgroup analyses comparing MRI field strength (1.5T versus 3.0T) and brain location (corticospinal tract average versus internal capsule) were performed to generate summary sensitivity, specificity, AUC, diagnostic odds ratio, and test effectiveness values for each subgroup.
Assessment of Heterogeneity
Heterogeneity was assessed using the quantity I2 as defined by I2 = 100% × (Q – df)/Q, where I2 is a measure of consistency across studies, Q is Cochran’s heterogeneity statistic, and df is the degrees of freedom. Higgins et al propose describing I2 values of 25%, 50%, and 75% as low, moderate, and high between-trial heterogeneity (21). We obtained the I2 values as output of the metan program.
Testing for Publication Bias
Publication bias was evaluated using a scatterplot of the area under the ROC curve versus the corresponding study’s standard error measurement, which should have a symmetric distribution when publication bias is not present. A linear regression of area under the ROC curve versus standard error measurement was also used for publication bias assessment, with P < .05 indicating significant asymmetry.
RESULTS
Study Selection
Numbers of studies screened, assessed for eligibility, and included in the review, with reasons for exclusions at each stage, is given in Figure 1. The search yielded 1148 literature citations for potential inclusion. We excluded 1088 of the studies because they were not relevant, because they did not involve DTI or humans, or because they were review based articles or letters to the editor. Of the 60 studies that underwent full publication review, another 30 studies were excluded; reasons included only graphical depiction of data, non-ROI/tractography based analysis, not corticospinal tract data, reanalysis of previously reported patient cohort, case study based, or not relevant.
Figure 1.
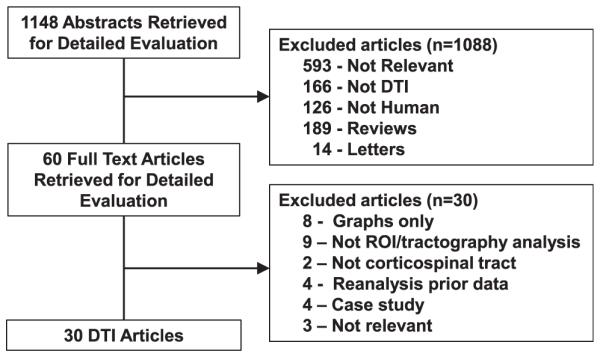
Flowchart illustrates the selection of studies. DTI, diffusion tensor imaging; ROI, region of interest.
Study Characteristics
The 30 evaluated studies involved 561 subjects diagnosed with ALS and 530 HCs (22–51). The studies were published between 1999 and 2011 (Table 1). Nineteen studies were performed on a 1.5T MRI, 1 study on a 2.9T MRI, 9 studies on 3.0T MRI, and 1 study on a 4.0T MRI. Eighteen studies were performed in Europe, 6 in North America, 5 in Asia, and 1 in South America. We extracted FA values from the corticospinal tract region in 12 studies, the posterior limb of the internal capsule in 14 studies, the brainstem in 3 studies, and the right centrum semiovale in 1 study. The 12 studies reporting values from the corticospinal tract used varying methods to calculate an average corticospinal tract fractional anisotropy. Five of the studies used tractography (ie, fiber tracking techniques) to delineate the corticospinal tract to directly calculate an average of the resolved fiber tracks. Two of the studies using tractography to delineate the corticospinal tract to guide the placement of multiple ROIs along the corticospinal tract and calculate an overall average. The other five studies placed ROIs along the corticospinal tract using visual inspection methods, all of which included the posterior limb of the internal capsule in order to calculate an overall average. Almost all of the studies averaged values from the right and left sides; in studies in which the right and left side values were reported separately, we used the average FA value of the right and left sides and the corresponding pooled standard deviations. All studies except one based the diagnosis of ALS on the El Escorial criteria.
TABLE 1.
Individual Study Characteristics
| Author | Year | Origin | MRI | b-Value | Number of Directions | DTI Analysis Method |
|---|---|---|---|---|---|---|
| Agosta et al (23) | 2007 | Italy | 1.5T | 900 | 12 | ROI–visual |
| Agosta et al (24) | 2009 | Italy | 1.5T | Unclear | Unclear | Tractography |
| Aoki et al (25) | 2005 | Japan | 1.5T | 1000 | 13 | ROI–tractography |
| Bartels et al (26) | 2008 | Germany | 2.9T | 1000 | 24 | ROI–tractography |
| Blain et al (27) | 2007 | UK | 1.5T | 1300 | 64 | ROI–visual |
| Blain et al (28) | 2011 | UK | 1.5T | 1300 | 64 | Tractography |
| Ciccarelli et al (29) | 2006 | UK | 1.5T | 1150 | 54 | Tractography |
| Cosotinni et al (30) | 2005 | Italy | 1.5T | 1000 | 25 | ROI–visual |
| Cosottini et al (31) | 2010 | Italy | 1.5T | 1000 | 31 | ROI–visual |
| Ellis et al (32) | 1999 | UK | 1.5T | 620 | 7 | ROI–visual |
| Filippini et al (33) | 2010 | UK | 3.0T | 1000 | 60 | Tractography |
| Garcia et al (34) | 2007 | Brazil | 1.5T | 1000 | 12 | ROI–visual |
| Graham et al (35) | 2004 | UK | 1.5T | 1200 | 54 | ROI–visual |
| Hong et al (36) | 2008 | S. Korea | 3.0T | 1000 | 25 | ROI–tractography |
| Ito et al (37) | 2008 | Japan | 3.0T | 700 | 6 | ROI–tractography |
| Karlsborg et al (38) | 2004 | Denmark | 1.5T | 550 | 6 | ROI–visual |
| Lombardo et al (39) | 2009 | Italy | 1.5T | 1000 | 25 | ROI–visual |
| Metwalli et al (40) | 2010 | USA | 3.0T | 1000 | 64 | ROI–visual |
| Nair et al (41) | 2010 | USA | 3.0T | 1000 | 30 | ROI–visual |
| Nelles et al (42) | 2008 | Germany | 3.0T | 600 | 16 | Tractography |
| Pyra et al (43) | 2010 | Canada | 1.5T | 1000 | 6 | ROI–visual |
| Roccatagliata et al (44) | 2009 | Italy | 1.5T | 1000 | 51 | ROI–visual |
| Sage et al (45) | 2007 | Belgium | 3.0T | 800 | 16 | Tractography |
| Schimrigk et al (46) | 2007 | Germany | 1.5T | 1000 | 6 | ROI–tractography |
| Senda et al (47) | 2009 | Japan | 3.0T | 700 | 6 | ROI–tractography |
| Valsasina et al (48) | 2007 | Italy | 1.5T | 900 | 12 | ROI–visual |
| Wang et al (49) | 2006 | USA | 3.0T | 1000 | 12 | ROI–tractography |
| Wong et al (50) | 2007 | Canada | 1.5T | 1000 | 6 | ROI–visual |
| Woolley et al (51) | 2011 | USA | 4.0T | 800 | 6 | ROI–visual |
| Yin et al (52) | 2004 | China | 1.5T | 1000 | 25 | ROI–visual |
MRI, magnetic resonance imaging; ROI, region of interest; ROI–tractography, used tractography generated fiber tracts to aid placement of ROIs; ROI–visual, placed ROIs manually using visual inspection of structural imaging; Tractography, used tractography techniques to generate fiber tracts to directly calculate fractional anisotropy values; UK, United Kingdom; USA, United States of America.
Diagnostic Test Performance Indexes and Summary Estimates
Figures 2 and 3 show the summary ROC curve and the forest plot of the AUC values. For the overall 30 studies, the pooled sensitivity was 0.65 (95% CI 0.61–0.69); the pooled specificity, 0.67 (95% CI 0.63–0.72); the pooled diagnostic odds ratio, 1.88 (95% CI 1.46–2.30); the pooled test effectiveness, 1.04 (95% CI 0.81–1.27); and the area under the ROC curve, 0.76 (95% CI 0.71–0.81).
Figure 2.
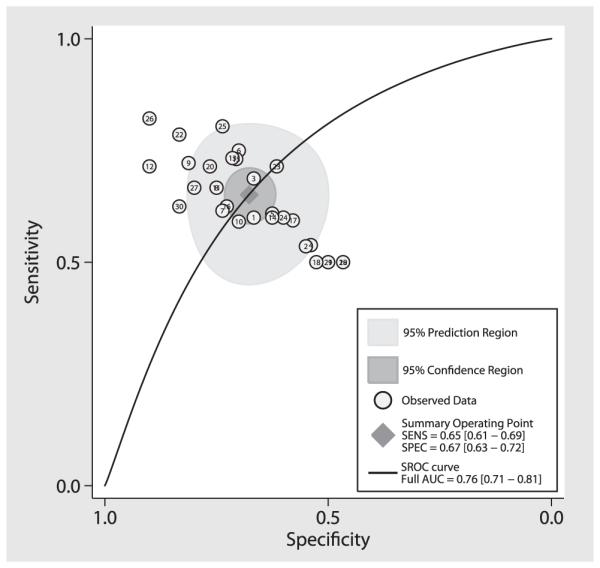
Area under the summary ROC curve for DTI. Each circle represents an individual study result. The diamond in the center represents intersection of the summary sensitivity and specificity, the inner dark gray circle represents the 95% confidence interval of the summary sensitivity and specificity, and the outer light gray circle represents the 95% predicted interval. SENS, sensitivity; SPEC, specificity; SROC, summary receiver operating characteristic; AUC, area under the curve.
Figure 3.

Forest plot of AUC for diagnosis of ALS using DTI-generated fractional anisotropy values. The center point represents the point estimated AUC for the respective study and the horizontal line, the 95% confidence interval (CI) for the respective study. The vertical broken line represents the pooled AUC and the boundaries of the hollow diamond represent the 95% CI of the pooled results. nd, number of diseased; meand, mean fractional anistropy (FA) of diseased; sdd, standard deviation FA of diseased controls; nh, number of healthy controls; meanh, mean FA of healthy controls; sdh, standard deviation FA of healthy controls; AUC, area under the curve.
Effect of Field Strength on Diagnostic Performance (1.5T versus 3.0T)
Figure 4a shows the forest plot of the AUC values for the 1.5T and 3.0T studies, Table 2 displays the sensitivity and specificity measures, and Table 3 shows the diagnostic odds ratio and the test effectiveness measures. There were no significant differences in respective pooled diagnostic test accuracy measures between 1.5T versus 3.0T studies.
Figure 4.


AUC Forest plots for (a) 1.5T and 3.0T MRI field strength and (b) corticospinal tract and internal capsule. The center point represents the point estimated AUC for the respective study and; the horizontal line, the 95% confidence interval (CI) for the respective study. The vertical broken line represents the pooled AUC and the boundaries of the hollow diamond represent the 95% CI of the pooled results. nd, number of diseased; meand, mean fractional anistropy (FA) of diseased; sdd, standard deviation FA of diseased; nh, number of healthy controls; meanh, mean FA of healthy controls; sdh, standard deviation FA of healthy controls; AUC, area under the curve.
TABLE 2.
Sensitivity and Specificity Measures
| Sensitivity | Specificity | |
|---|---|---|
| Overall | 0.65 (0.61–0.69) | 0.67 (0.63–0.72) |
| 1.5T | 0.65 (0.59–0.71) | 0.70 (0.61–0.74) |
| 3.0T | 0.70 (0.61–0.73) | 0.71 (0.57–0.80) |
| CST | 0.68 (0.63–0.74) | 0.72 (0.68–0.76) |
| IC | 0.65 (0.54–0.73) | 0.66 (0.60–0.73) |
CST, corticospinal tract; IC, internal capsule.
TABLE 3.
Diagnostic Odds Ratio and Test Effectiveness Measures
| Diagnostic Odds Ratio | Test Effectiveness | |
|---|---|---|
| Overall | 1.88 (1.46–2.30) | 1.04 (0.81–1.27) |
| 1.5T | 2.03 (1.45–2.61) | 1.12 (0.80–1.44) |
| 3.0T | 1.92 (1.36–2.48) | 1.06 (0.75–1.37) |
| CST | 2.18 (1.56–2.81) | 1.20 (0.86–1.55) |
| IC | 1.93 (1.29–2.56) | 1.06 (0.71–1.41) |
CST, corticospinal tract; IC, internal capsule.
Effect of Brain Location on Diagnostic Performance (Corticospinal Tract Average versus Internal Capsule)
Figure 4b shows the forest plot of the AUC values for studies reporting corticospinal tract (CST) average measurements compared to those reporting internal capsule (IC) measurements. Table 2 displays the sensitivity and specificity measures, and Table 3 shows the diagnostic odds ratio and the test effectiveness measures. There were no significant differences in the respective pooled diagnostic test accuracy measures between CST versus IC studies.
Assessment of Methodological Quality
Study quality scores ranged from 5 to 10 of a possible total score of 11 (Fig 5). The majority of studies did not incorporate ALS patients with a representative spectrum of disease and studied only patients with probable or definite diagnosis of ALS by the El Escorial criteria. Eighteen of the 30 studies also did not explicitly state the inclusion and/or the exclusion criteria for the participants. Many of the studies did not clearly state that a short period was used between recruitment and the MRI scans. Only 11 of 30 studies explicitly stated that the investigators evaluating the DTI data were blinded to the clinical status of the subject. The majority of the studies also did not clearly comment on whether there were uninterpretable test results.
Figure 5.

Study quality scores. Graph illustrates study quality based on QUADAS criteria, expressed as a percent of studies meeting each criterion.
Assessment of Heterogeneity
The study-specific AUCs for the 30 studies demonstrated at least moderate heterogeneity (I2 = 70%; P < .001). The subgroup analysis of the AUC for the MRI field strengths of 1.5T demonstrated a greater degree of heterogeneity (I2 = 71%; P < .001) compared to the 3.0T subgroup (I2 = 46%; P = .061). Similar degrees of heterogeneity were demonstrated in the subgroup analyses by brain location (CST [I2 = 70%; P < .001], IC [I2 = 59%; P = .002]).
Publication Bias
There was significant publication bias (bias coefficient = −4.14; P < .001). As seen in Figure 6, there was an asymmetric distribution of the data with a tendency of the studies with a lower standard error to have a higher area under the ROC curve.
Figure 6.
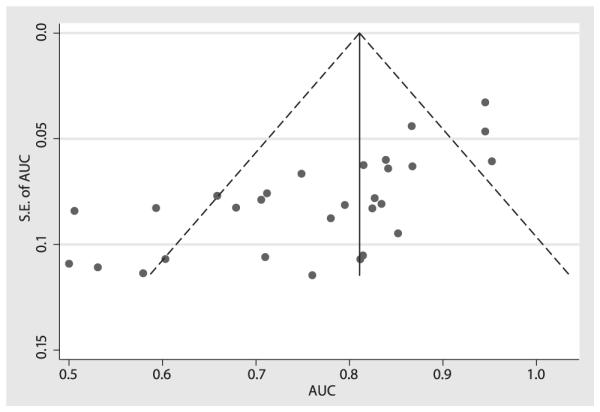
Assessing publication bias. The funnel plot horizontal axis expresses treatment effect, in this instance, measured by area under the receiver operating characteristic curve (AUC). The vertical axis expresses study size, as measured by standard error (SE). Studies with larger standard errors have a wider confidence interval from smaller sample size. The graphed vertical line represents the observed mean AUC and the dashed lines represent the 95% confidence interval limits for the expected distribution for published studies. The points represent the observed distribution of the published studies. Visual inspection of the plot demonstrates the presence of publication bias, with many studies outside the 95% confidence interval limits. Further, the plot demonstrates that studies with smaller study size (ie, larger standard errors) have lower test performance (ie, AUC).
DISCUSSION
In the diagnostic workup of ALS, standard neuroimaging techniques are typically used to exclude other neurological diseases that can cause both UMN and LMN neurological signs such as a compressive lesion involving the upper cervical spinal cord. MRI can also demonstrate subtle changes in ALS patients such as T2 hypointensity in the precentral gyrus (52) and T2 hyperintensity in the corticospinal tract (53,54). However, these findings are nonspecific and lack diagnostic validity (55–58). As a result, advanced neuroimaging techniques, such as DTI, have been investigated to further our understanding of ALS pathophysiology and establish improved disease markers (2,6,48,59).
The ALS DTI literature comprises a series of case-control studies with relatively small populations predominately focused on determining a significant difference between diseased and nondiseased populations (ie, exploratory phase of clinical test development). We conducted what we believe is the first meta-analysis to assess the test accuracy measures of DTI to diagnose ALS by aggregating those small studies. In our meta-analysis, we assessed the sensitivity, specificity, diagnostic odds ratio, test effectiveness, and area under the ROC curve in case-control studies using DTI comparing ALS subjects to healthy controls. Part of the scope of this metaanalysis is to investigate the potential of DTI to progress along the test validation phases.
The overall summary measures of DTI to diagnose ALS yield the relatively low sensitivity of 0.65 and specificity of 0.67 which is reflected in the relatively small area under the ROC curve value of 0.76. To place these results in clinical use context, early test accuracy studies of MRI in the context of multiple sclerosis and herniated nucleus pulposus-caused nerve compression yielded area under the ROC curve values of 0.82 and 0.81–0.84, respectively (60,61). The test effectiveness results also reflected the limited discriminatory capacity of DTI in the setting of ALS. The average difference of the means between diseased and nondiseased groups is just over one standard deviation indicating that there is significant overlap in the FA value distribution curves between the two groups. The diagnostic odds ratio was slightly under 2, indicating that ALS subjects had approximately twice the odds of a positive test result compared to HCs. To provide implications of these results for clinical decision-making, we used Bayesian techniques to calculate the posttest probability after positive and negative DTI results with different pretest probabilities in Figure 7. For example, for an individual with an ALS pretest probability of a 0.50 based on clinical criteria, the posttest probability of ALS is 0.66 with a positive test results and the post-test probability of ALS is 0.34 with a negative test result.
Figure 7.
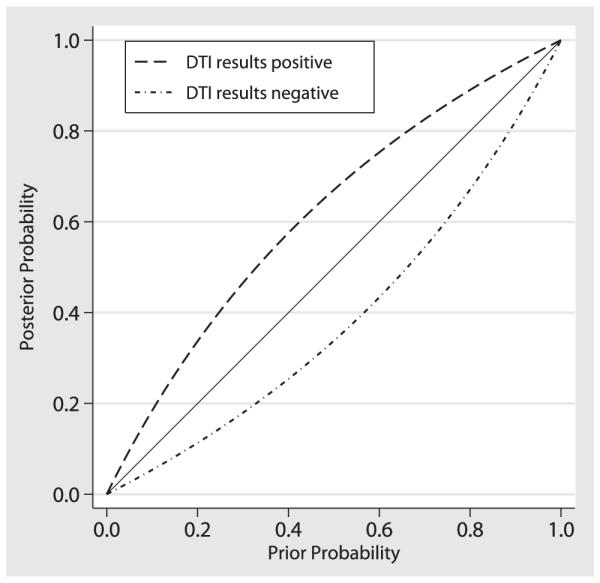
Posttest probabilities after diffusion tensor imaging (DTI) for hypothetical populations with different prevalence of disease according to Bayes theorem.
It is interesting to note that we did not find differences between the test accuracy measures and either MRI field strength or brain region studied. There has been discussion in the literature with respect to ROI placement for DTI measures in the setting of ALS. Although differences in ROI placement likely generate heterogeneity between studies, it does not appear to significantly impact disease discrimination. Higher field strength magnets are generally considered more desirable in terms of improved signal to noise ratio; however, our subanalysis reveals no difference in diagnostic test performance measures between 1.5T and 3.0T, although the heterogeneity of the studies was considerably lower for the 3.0T studies suggesting greater reliability of the summary accuracy of 3.0T studies.
There are several limitations to our study. None of the studies used the gold standard of reference (autopsy) for confirmation of ALS. The reference test in 29 of 30 publications was based on the El Escorial criteria; the El Escorial criteria have been shown in clinicopathological studies to have a high level of diagnostic concordance with histopathological findings of ALS in subjects with definite or probable ALS based on the initial El Escorial criteria published in 1994. Pathologic confirmation of disease in those with possible or suspected ALS is limited, however (62,63). The El Escorial criteria were subsequently revised to increase their sensitivity, but the criticism still remains (64,65). There was also significant heterogeneity between the studies likely reflecting differences in equipment, patient populations, imaging protocols, and analysis methods reflecting the need for improved protocol uniformity across research centers. We also used only published studies in this meta-analysis; study trials are more likely to be reported if they are statistically significant creating publication bias (66). We did not include studies that used only voxel-based morphometry analysis, which allows for interrogation of the entire brain but requires appropriate statistical analysis to minimize Type I error. Many of the included studies did not explicitly state whether the protocol met certain quality criteria adding uncertainty to the true study quality. As noted previously, the majority of studies did not incorporate ALS patients with possible ALS; the reported results may therefore be biased by a greater effect size. It would also be interesting to evaluate DTI changes with respect to disease duration as well as other clinical characteristics such as revised Amyotrophic Lateral Sclerosis Rating Scale (ALSFRS-R) score and disease progression rate. However, this analysis would be best accomplished using individual level data rather than the group level analysis implemented here. Consensus guidelines for ALS MRI and clinical information protocols (such as presented at the first Neuroimaging Symposium in ALS) (11) should help reduce statistical variation between studies furthering testing validation efforts. Given these limitations and the modest test accuracy measures of DTI in the setting of ALS, future DTI research efforts should be focused on running larger trials with more rigorous methodological quality standards, using consensus research guidelines and combining other advanced neuroimaging techniques with DTI. These steps will be necessary in order to translate and validate this technology to the clinical setting.
There have been a large number of case-control studies using relatively small numbers of ALS patients investigating changes in DTI measurements. Through this meta-analysis, we present a quantitative review of the literature and provide summary estimates of diagnostic test accuracy. The discriminatory capability of DTI to make a diagnosis of ALS is only modest. There were no significant differences in the diagnostic test accuracy summary estimates with respect to MRI field strength or brain location (corticospinal tract average versus internal capsule). These results indicate that DTI will have to be combined with additional potential diagnostic tests (32) in order to have clinical relevance with respect to ALS.
ACKNOWLEDGMENTS
The authors thank Cristina Churchill, Dr. Hannelore Ehrenreich, Dr. Massimo Filippi, Dr. Mizuki Ito, Dr. Jiří, Keller, Dr. Kanako Sato, Dr. Gen Sobue, Dr. Martin Turner, Dr. Josef Vymazal, and Dr. Susan Woolley for their help in data acquisition. Dr. Foerster thanks the Johns Hopkins Graduate Training Programs in Clinical Investigation for its mentorship. Funded in part by the American Roentgen Ray Fund and the Radiological Society of North America Research Fund.
APPENDIX 1. STATISTICAL APPROACH FOR BINORMAL CURVE ANALYSIS
We assumed a binormal ROC curve data analysis (14) in which the proposed diagnostic marker, A, is normally distributed in the healthy control population (nondiseased) and the ALS population (diseased):
For each cutoff value c, specificity and sensitivity are defined as
Where Φ denotes the cumulative probability function of the standard normal distribution. We derived for each study the optimal cutoff based on the Youden index. We assumed equal variance to calculate the cutoff which results in the midpoint between the means of the diseased and the healthy population to generate proper ROC curves to avoid hooking, an accepted approach (15):
Contributor Information
Bradley R. Foerster, Department of Radiology and Radiological Science, Johns Hopkins University School of Medicine, Baltimore, MD; Department of Radiology, University of Michigan, Ann Arbor, MI 48109-5030; Ann Arbor VA Healthcare System, Ann Arbor, MI.
Ben A. Dwamena, Department of Radiology, University of Michigan, Ann Arbor, MI 48109-5030; Ann Arbor VA Healthcare System, Ann Arbor, MI.
Myria Petrou, Department of Radiology and Radiological Science, Johns Hopkins University School of Medicine, Baltimore, MD; Department of Radiology, University of Michigan, Ann Arbor, MI 48109-5030.
Ruth C. Carlos, Department of Radiology, University of Michigan, Ann Arbor, MI 48109-5030.
Brian C. Callaghan, Department of Neurology, University of Michigan, Ann Arbor, MI 48109-5030.
Martin G. Pomper, Department of Radiology and Radiological Science, Johns Hopkins University School of Medicine, Baltimore, MD.
REFERENCES
- 1.Ghadge GD, Slusher BS, Bodner A, et al. Glutamate carboxypeptidase II inhibition protects motor neurons from death in familial amyotrophic lateral sclerosis models. Proc Natl Acad Sci U S A. 2003;100:9554–9559. doi: 10.1073/pnas.1530168100. [DOI] [PMC free article] [PubMed] [Google Scholar]
- 2.Turner MR, Kiernan MC, Leigh PN, et al. Biomarkers in amyotrophic lateral sclerosis. Lancet Neurol. 2009;8:94–109. doi: 10.1016/S1474-4422(08)70293-X. [DOI] [PubMed] [Google Scholar]
- 3.Worms PM. The epidemiology of motor neuron diseases: a review of recent studies. J Neurol Sci. 2001;191:3–9. doi: 10.1016/s0022-510x(01)00630-x. [DOI] [PubMed] [Google Scholar]
- 4.Eisen A, Schulzer M, MacNeil M, et al. Duration of amyotrophic lateral sclerosis is age dependent. Muscle Nerve. 1993;16:27–32. doi: 10.1002/mus.880160107. [DOI] [PubMed] [Google Scholar]
- 5.Zoccolella S, Beghi E, Palagano G, et al. Predictors of delay in the diagnosis and clinical trial entry of amyotrophic lateral sclerosis patients: a population-based study. J Neurol Sci. 2006;250:45–49. doi: 10.1016/j.jns.2006.06.027. [DOI] [PubMed] [Google Scholar]
- 6.Kaufmann P, Mitsumoto H. Amyotrophic lateral sclerosis: objective upper motor neuron markers. Curr Neurol Neurosci Rep. 2002;2:55–60. doi: 10.1007/s11910-002-0054-x. [DOI] [PubMed] [Google Scholar]
- 7.Chenevert TL, Brunberg JA, Pipe JG. Anisotropic diffusion in human white matter: demonstration with MR techniques in vivo. Radiology. 1990;177:401–405. doi: 10.1148/radiology.177.2.2217776. [DOI] [PubMed] [Google Scholar]
- 8.Turner MR. MRI as a frontrunner in the search for amyotrophic lateral sclerosis biomarkers? Biomark Med. 2011;5:79–81. doi: 10.2217/bmm.10.120. [DOI] [PMC free article] [PubMed] [Google Scholar]
- 9.Pierpaoli C, Basser PJ. Toward a quantitative assessment of diffusion anisotropy. Magn Reson Med. 1996;36:893–906. doi: 10.1002/mrm.1910360612. [DOI] [PubMed] [Google Scholar]
- 10.Nucifora PG, Verma R, Lee SK, et al. Diffusion-tensor MR imaging and tractography: exploring brain microstructure and connectivity. Radiology. 2007;245:367–384. doi: 10.1148/radiol.2452060445. [DOI] [PubMed] [Google Scholar]
- 11.Turner MR, Grosskreutz J, Kassubek J, et al. Towards a neuroimaging biomarker for amyotrophic lateral sclerosis. Lancet Neurol. 2011;10:400–403. doi: 10.1016/S1474-4422(11)70049-7. [DOI] [PubMed] [Google Scholar]
- 12.Whiting P, Rutjes AW, Reitsma JB, et al. The development of QUADAS: a tool for the quality assessment of studies of diagnostic accuracy included in systematic reviews. BMC Med Res Methodol. 2003;3:25. doi: 10.1186/1471-2288-3-25. [DOI] [PMC free article] [PubMed] [Google Scholar]
- 13.Brooks BR, Miller RG, Swash M, et al. El Escorial revisited: revised criteria for the diagnosis of amyotrophic lateral sclerosis. Amyotroph Lateral Scler Other Motor Neuron Disord. 2000;1:293–299. doi: 10.1080/146608200300079536. [DOI] [PubMed] [Google Scholar]
- 14.Hellmich M, Abrams KR, Sutton AJ. Bayesian approaches to meta-analysis of ROC curves. Med Decis Making. 1999;19:252–264. doi: 10.1177/0272989X9901900304. [DOI] [PubMed] [Google Scholar]
- 15.Perkins NJ, Schisterman EF. The Youden Index and the optimal cut-point corrected for measurement error. Biomed J. 2005;47:428–441. doi: 10.1002/bimj.200410133. [DOI] [PubMed] [Google Scholar]
- 16.Hasselblad V, Hedges LV. Meta-analysis of screening and diagnostic tests. Psychol Bull. 1995;117:167–178. doi: 10.1037/0033-2909.117.1.167. [DOI] [PubMed] [Google Scholar]
- 17.Abrams K, Sanso B. Approximate Bayesian inference for random effects meta-analysis. Stat Med. 1998;17:201–218. doi: 10.1002/(sici)1097-0258(19980130)17:2<201::aid-sim736>3.0.co;2-9. [DOI] [PubMed] [Google Scholar]
- 18.Cologne JB, Breslow NE. A small sample simulation study of methods for log odds ratio regression-analysis. Comput Stat Data Anal. 1990;9:217–235. [Google Scholar]
- 19.Feng ZD, Mcculloch CE. Statistical-inference using maximum-likelihood-estimation and the generalized likelihood ratio when the true parameter is on the boundary of the parameter space. Stat Probabil Lett. 1992;13:325–332. [Google Scholar]
- 20.Novielli N, Cooper NJ, Sutton AJ, et al. Bayesian model selection for meta-analysis of diagnostic test accuracy data: Application to Ddimer for deep vein thrombosis. Research Synthesis Methods. 2010;1:226–238. doi: 10.1002/jrsm.15. [DOI] [PubMed] [Google Scholar]
- 21.Higgins JP, Thompson SG, Deeks JJ, et al. Measuring inconsistency in meta-analyses. BMJ. 2003;327:557–560. doi: 10.1136/bmj.327.7414.557. [DOI] [PMC free article] [PubMed] [Google Scholar]
- 22.Agosta F, Pagani E, Rocca MA, et al. Voxel-based morphometry study of brain volumetry and diffusivity in amyotrophic lateral sclerosis patients with mild disability. Hum Brain Mapping. 2007;28:1430–1438. doi: 10.1002/hbm.20364. [DOI] [PMC free article] [PubMed] [Google Scholar]
- 23.Agosta F, Rocca MA, Valsasina P, et al. A longitudinal diffusion tensor MRI study of the cervical cord and brain in amyotrophic lateral sclerosis patients. J Neurol Neurosurg Psychiatry. 2009;80:53–55. doi: 10.1136/jnnp.2008.154252. [DOI] [PubMed] [Google Scholar]
- 24.Aoki S, Iwata NK, Masutani Y, et al. Quantitative evaluation of the pyramidal tract segmented by diffusion tensor tractography: feasibility study in patients with amyotrophic lateral sclerosis. Radiat Med. 2005;23:195–199. [PubMed] [Google Scholar]
- 25.Bartels C, Mertens N, Hofer S, et al. Callosal dysfunction in amyotrophic lateral sclerosis correlates with diffusion tensor imaging of the central motor system. Neuromuscular Disord. 2008;18:398–407. doi: 10.1016/j.nmd.2008.02.005. [DOI] [PubMed] [Google Scholar]
- 26.Blain CR, Williams VC, Johnston C, et al. A longitudinal study of diffusion tensor MRI in ALS. Amyotroph Lateral Scler. 2007;8:348–355. doi: 10.1080/17482960701548139. [DOI] [PubMed] [Google Scholar]
- 27.Blain CR, Brunton S, Williams VC, et al. Differential corticospinal tract degeneration in homozygous ’D90A’SOD-1 ALS and sporadic ALS. J Neurol Neurosurg Psychiatry. 2011;82:843–849. doi: 10.1136/jnnp.2010.236018. [DOI] [PMC free article] [PubMed] [Google Scholar]
- 28.Ciccarelli O, Behrens TE, Altmann DR, et al. Probabilistic diffusion tractography: a potential tool to assess the rate of disease progression in amyotrophic lateral sclerosis. Brain. 2006;129:1859–1871. doi: 10.1093/brain/awl100. [DOI] [PubMed] [Google Scholar]
- 29.Cosottini M, Giannelli M, Siciliano G, et al. Diffusion-tensor MR imaging of corticospinal tract in amyotrophic lateral sclerosis and progressive muscular atrophy. Radiology. 2005;237:258–264. doi: 10.1148/radiol.2371041506. [DOI] [PubMed] [Google Scholar]
- 30.Cosottini M, Giannelli M, Vannozzi F, et al. Evaluation of corticospinal tract impairment in the brain of patients with amyotrophic lateral sclerosis by using diffusion tensor imaging acquisition schemes with different numbers of diffusion-weighting directions. J Comput Assist Tomogr. 2010;34:746–750. doi: 10.1097/RCT.0b013e3181e35129. [DOI] [PubMed] [Google Scholar]
- 31.Ellis CM, Simmons A, Jones DK, et al. Diffusion tensor MRI assesses corticospinal tract damage in ALS. Neurology. 1999;53:1051–1058. doi: 10.1212/wnl.53.5.1051. [DOI] [PubMed] [Google Scholar]
- 32.Filippini N, Douaud G, Mackay CE, et al. Corpus callosum involvement is a consistent feature of amyotrophic lateral sclerosis. Neurology. 2010;75:1645–1652. doi: 10.1212/WNL.0b013e3181fb84d1. [DOI] [PMC free article] [PubMed] [Google Scholar]
- 33.Garcia LN, Silva AV, Carrete H, Jr, et al. [Correlation between corticospinal tract degeneration through magnetic resonance imaging, and functional scale (ALSFRS) in patients with amyotrophic lateral sclerosis] Arq Neuropsiquiatr. 2007;65:869–874. doi: 10.1590/s0004-282x2007000500029. [DOI] [PubMed] [Google Scholar]
- 34.Graham JM, Papadakis N, Evans J, et al. Diffusion tensor imaging for the assessment of upper motor neuron integrity in ALS. Neurology. 2004;63:2111–2119. doi: 10.1212/01.wnl.0000145766.03057.e7. [DOI] [PubMed] [Google Scholar]
- 35.Hong YH, Sung JJ, Kim SM, et al. Diffusion tensor tractography-based analysis of the pyramidal tract in patients with amyotrophic lateral sclerosis. J Neuroimaging. 2008;18:282–287. doi: 10.1111/j.1552-6569.2007.00153.x. [DOI] [PubMed] [Google Scholar]
- 36.Ito M, Watanabe H, Atsuta N, et al. Fractional anisotropy values detect pyramidal tract involvement in multiple system atrophy. J Neurol Sci. 2008;271:40–46. doi: 10.1016/j.jns.2008.03.013. [DOI] [PubMed] [Google Scholar]
- 37.Karlsborg M, Rosenbaum S, Wiegell MR, et al. Corticospinal tract degeneration and possible pathogenesis in ALS evaluated by MR diffusion tensor imaging. Amyotroph Lateral Sc. 2004;5:136–140. doi: 10.1080/14660820410018982. [DOI] [PubMed] [Google Scholar]
- 38.Lombardo F, Frijia F, Bongioanni P, et al. Diffusion tensor MRI and MR spectroscopy in long lasting upper motor neuron involvement in amyotrophic lateral sclerosis. Arch Italiennes De Biol. 2009;147:69–82. [PubMed] [Google Scholar]
- 39.Metwalli NS, Benatar M, Nair G, et al. Utility of axial and radial diffusivity from diffusion tensor MRI as markers of neurodegeneration in amyotrophic lateral sclerosis. Brain Res. 2010;1348:156–164. doi: 10.1016/j.brainres.2010.05.067. [DOI] [PubMed] [Google Scholar]
- 40.Nair G, Carew JD, Usher S, et al. Diffusion tensor imaging reveals regional differences in the cervical spinal cord in amyotrophic lateral sclerosis. Neuroimage. 2010;53:576–583. doi: 10.1016/j.neuroimage.2010.06.060. [DOI] [PubMed] [Google Scholar]
- 41.Nelles M, Block W, Traber F, et al. Combined 3T diffusion tensor tractography and H-1-MR spectroscopy in motor neuron disease. Am J Neuroradiol. 2008;29:1708–1714. doi: 10.3174/ajnr.A1201. [DOI] [PMC free article] [PubMed] [Google Scholar]
- 42.Pyra T, Hui B, Hanstock C, et al. Combined structural and neurochemical evaluation of the corticospinal tract in amyotrophic lateral sclerosis. Amyotroph Lateral Scler. 2010;11:157–165. doi: 10.3109/17482960902756473. [DOI] [PubMed] [Google Scholar]
- 43.Roccatagliata L, Bonzano L, Mancardi G, et al. Detection of motor cortex thinning and corticospinal tract involvement by quantitative MRI in amyotrophic lateral sclerosis. Amyotroph Lateral Scler. 2009;10:47–52. doi: 10.1080/17482960802267530. [DOI] [PubMed] [Google Scholar]
- 44.Sage CA, Peeters RR, Gorner A, et al. Quantitative diffusion tensor imaging in amyotrophic lateral sclerosis. Neuroimage. 2007;34:486–499. doi: 10.1016/j.neuroimage.2006.09.025. [DOI] [PubMed] [Google Scholar]
- 45.Schimrigk SK, Bellenberg B, Schluter M, et al. Diffusion tensor imaging-based fractional anisotropy quantification in the corticospinal tract of patients with amyotrophic lateral sclerosis using a probabilistic mixture model. Am J Neuroradiol. 2007;28:724–730. [PMC free article] [PubMed] [Google Scholar]
- 46.Senda J, Ito M, Watanabe H, et al. Correlation between pyramidal tract degeneration and widespread white matter involvement in amyotrophic lateral sclerosis: a study with tractography and diffusion-tensor imaging. Amyotroph Lateral Scler. 2009;10:288–294. doi: 10.3109/17482960802651717. [DOI] [PubMed] [Google Scholar]
- 47.Valsasina P, Agosta F, Benedetti B, et al. Diffusion anisotropy of the cervical cord is strictly associated with disability in amyotrophic lateral sclerosis. J Neurol Neurosurg Psychiatry. 2007;78:480–484. doi: 10.1136/jnnp.2006.100032. [DOI] [PMC free article] [PubMed] [Google Scholar]
- 48.Wang S, Poptani H, Woo JH, et al. Amyotrophic lateral sclerosis: diffusion-tensor and chemical shift MR imaging at 3.0 T. Radiology. 2006;239:831–838. doi: 10.1148/radiol.2393050573. [DOI] [PubMed] [Google Scholar]
- 49.Wong JC, Concha L, Beaulieu C, et al. Spatial profiling of the corticospinal tract in amyotrophic lateral sclerosis using diffusion tensor imaging. J Neuroimaging. 2007;17:234–240. doi: 10.1111/j.1552-6569.2007.00100.x. [DOI] [PubMed] [Google Scholar]
- 50.Woolley SC, Zhang Y, Schuff N, et al. Neuroanatomical correlates of apathy in ALS using 4 Tesla diffusion tensor MRI. Amyotroph Lateral Scler. 2011;12:52–58. doi: 10.3109/17482968.2010.521842. [DOI] [PubMed] [Google Scholar]
- 51.Yin H, Lim CC, Ma L, et al. Combined MR spectroscopic imaging and diffusion tensor MRI visualizes corticospinal tract degeneration in amyotrophic lateral sclerosis. J Neurol. 2004;251:1249–1254. doi: 10.1007/s00415-004-0526-9. [DOI] [PubMed] [Google Scholar]
- 52.Bowen BC, Pattany PM, Bradley WG, et al. MR imaging and localized proton spectroscopy of the precentral gyrus in amyotrophic lateral sclerosis. AJNR Am J Neuroradiol. 2000;21:647–658. [PMC free article] [PubMed] [Google Scholar]
- 53.Chan S, Shungu DC, Douglas-Akinwande A, et al. Motor neuron diseases: comparison of single-voxel proton MR spectroscopy of the motor cortex with MR imaging of the brain. Radiology. 1999;212:763–769. doi: 10.1148/radiology.212.3.r99au35763. [DOI] [PubMed] [Google Scholar]
- 54.Unrath A, Ludolph AC, Kassubek J. Brain metabolites in definite amyotrophic lateral sclerosis. A longitudinal proton magnetic resonance spectroscopy study. J Neurol. 2007;254:1099–1106. doi: 10.1007/s00415-006-0495-2. [DOI] [PubMed] [Google Scholar]
- 55.Chan S, Kaufmann P, Shungu DC, et al. Amyotrophic lateral sclerosis and primary lateral sclerosis: evidence-based diagnostic evaluation of the upper motor neuron. Neuroimaging Clin N Am. 2003;13:307–326. doi: 10.1016/s1052-5149(03)00018-2. [DOI] [PubMed] [Google Scholar]
- 56.Cheung G, Gawel MJ, Cooper PW, et al. Amyotrophic lateral sclerosis: correlation of clinical and MR imaging findings. Radiology. 1995;194:263–270. doi: 10.1148/radiology.194.1.7997565. [DOI] [PubMed] [Google Scholar]
- 57.Comi G, Rovaris M, Leocani L. Review neuroimaging in amyotrophic lateral sclerosis. Eur J Neurol. 1999;6:629–637. doi: 10.1046/j.1468-1331.1999.660629.x. [DOI] [PubMed] [Google Scholar]
- 58.Hofmann E, Ochs G, Pelzl A, et al. The corticospinal tract in amyotrophic lateral sclerosis: an MRI study. Neuroradiology. 1998;40:71–75. doi: 10.1007/s002340050543. [DOI] [PubMed] [Google Scholar]
- 59.Karitzky J, Ludolph AC. Imaging and neurochemical markers for diagnosis and disease progression in ALS. J Neurol Sci. 2001;191:35–41. doi: 10.1016/s0022-510x(01)00628-1. [DOI] [PubMed] [Google Scholar]
- 60.Mushlin AI, Detsky AS, Phelps CE, et al. The accuracy of magnetic resonance imaging in patients with suspected multiple sclerosis. The Rochester-Toronto Magnetic Resonance Imaging Study Group. JAMA. 1993;269:3146–3151. [PubMed] [Google Scholar]
- 61.Thornbury JR, Fryback DG, Turski PA, et al. Disk-caused nerve compression in patients with acute low-back pain: diagnosis with MR, CT myelography, and plain CT. Radiology. 1993;186:731–738. doi: 10.1148/radiology.186.3.8267688. [DOI] [PubMed] [Google Scholar]
- 62.Chaudhuri KR, Crump S, al-Sarraj S, et al. The validation of El Escorial criteria for the diagnosis of amyotrophic lateral sclerosis: a clinicopathological study. J Neurol Sci. 1995;129(Suppl):11–12. doi: 10.1016/0022-510x(95)00050-c. [DOI] [PubMed] [Google Scholar]
- 63.Brooks BR. Diagnostic dilemmas in amyotrophic lateral sclerosis. J Neurol Sci. 1999;165(Suppl 1):S1–S9. doi: 10.1016/s0022-510x(99)00019-2. [DOI] [PubMed] [Google Scholar]
- 64.Schrooten M, Smetcoren C, Robberecht W, et al. Benefit of the Awaji diagnostic algorithm for amyotrophic lateral sclerosis: a prospective study. Ann Neurol. 2011;70:79–83. doi: 10.1002/ana.22380. [DOI] [PubMed] [Google Scholar]
- 65.Douglass CP, Kandler RH, Shaw PJ, et al. An evaluation of neurophysiological criteria used in the diagnosis of motor neuron disease. J Neurol Neurosurg Psychiatry. 2010;81:646–649. doi: 10.1136/jnnp.2009.197434. [DOI] [PubMed] [Google Scholar]
- 66.Dickersin K, Min YI. Publication bias: the problem that won’t go away. Ann N Y Acad Sci. 1993;703:135–146. doi: 10.1111/j.1749-6632.1993.tb26343.x. [DOI] [PubMed] [Google Scholar]