

Abstract
External beam radiation therapy procedures have, until recently, been planned almost exclusively using anatomic imaging methods. Molecular imaging using hybrid positron emission tomography (PET)/computed tomography scanning or single-photon emission computed tomography (SPECT) imaging has provided new insights into the precise location of tumors (staging) and the extent and character of the biologically active tumor volume (BTV) and has provided differential response information during and after therapy. In addition to the commonly used radiotracer 18F-fluoro- 2-deoxyD-glucose (FDG), additional radiopharmaceuticals are being explored to image major physiological processes as well as tumor biological properties, such as hypoxia, proliferation, amino acid accumulation, apoptosis, and receptor expression, providing the potential to target or boost the radiation dose to a biologically relevant region within a tumor, such as the most hypoxic or most proliferative area. Imaging using SPECT agents has furthered the possibility of limiting dose to functional normal tissues. PET can also portray the distribution of particle therapy by displaying activated species in situ. With both PET and SPECT imaging, fundamental physical issues of limited spatial resolution relative to the biological process, partial volume effects for quantification of small volumes, image misregistration, motion, and edge delineation must be carefully considered and can differ by agent or the method applied. Molecular imaging–guided radiation therapy (MIGRT) is a rapidly evolving and promising area of investigation and clinical translation. As MIGRT evolves, evidence must continue to be gathered to support improved clinical outcomes using MIGRT versus purely anatomic approaches.
The rapid evolution of precision radiation therapy now permits the delivery of high-dose rates to tumors located near normal structures with exquisitely sculpted dose sparing of the normal tissues. Currently, anatomic imaging is essential and the primary means applied to guide precision radiation therapy planning and serves as an important tool for providing attenuation maps to facilitate accurate dose calculation.1 Anatomic imaging is, however, limited in sensitivity for defining tumor extent, capacity to probe the selective biology of tumors and normal tissues, and potential for monitoring response of tumors and normal tissues to treatment.
The concept of a “biological tumor volume”(BTV) was introduced by Ling et al2 over a decade ago to describe radiation treatment planning, which included imaging data specific to tumor biology beyond that provided by anatomy alone. In this review, the term “molecular imaging– guided radiation therapy” (MIGRT) is used to describe imaging processes from which the signal is expected to map molecular distributions and their surrogates and can be used to guide external beam therapy plans. Although the discussion focuses on molecular imaging, it is understood that these images operate in concert with anatomic imaging to guide precision radiation therapy.
Although 18F-fluoro- 2-deoxyD-glucose (FDG) positron emission tomography (PET) has had a reasonably long history of use as an adjunct to anatomic imaging for radiation treatment planning, a large number of interesting (and some targeted) agents for both PET and single-photon emission computed tomography (SPECT) have been introduced or are under investigation to probe other aspects of tumor biology and normal tissue physiology. Internally administered radio-pharmaceuticals that target cancer after systemic administration include, among others, radiolabeled monoclonal antibodies, such as anti-CD20 reagents; radiopeptides binding to the somatostatin receptors; 131I-meta-iodo-benzylguanidine (MIBG); bone-targeting tracers such as 89Sr (strontium 89) or 153Sm-EDTMP (samavium 153-ethylene dlamine tetramethylene phosphonate); and 131I and 90Y microspheres for the treatment of hepatic malignancies. These therapeutic radio-pharmaceuticals often require imaging (often SPECT) before treatment is performed and treatment may include image-guided quantitative dosimetry to personalize radiation dose to normal tissues. Recent reviews further describe the role of targeted radionuclide therapies and the associated role of imaging in their guidance.3–7
Overview of PET and of SPECT
PET is an imaging method in which typically short-lived positron emitters, commonly produced in a medical cyclotron and usually attached to a targeting molecule, are used to qualitatively and quantitatively assess the biodistribution of the targeting molecule in vivo. Accurate and biologically relevant imaging depends on the delivery of the imaging agent to the relevant biological process. When the positron is emitted; it travels a short distance in tissue (about 1 mm for an 18F-associated positron) and then loses sufficient energy to interact with an electron, transiently producing positronium. This material gives off two 511-keV photons traveling at essentially 180° from one another as well as a neutrino. The 511-keV photons can be imaged using a specialized PET camera. Modern PET scanners often include a computed tomography (CT) scanner as a part of the instrument. Thus, patients can have a PET and a CT scan in a single imaging session.
Advantages of PET are its high sensitivity because of the use of precise timing information to determine if photons interact with detector materials simultaneously (coincidently or nearly so, as is the case for positron annihilation) as well as the opportunity to accurately correct radiation measurements for body thickness (attenuation). The CT scan from the PET/CT produces a data source for an attenuation map. PET images quite accurately provide quantitative radioactivity measurements in vivo.
A wide range of PET radiotracers have been developed to examine biologically relevant processes. The most common PET radioisotopes are 18F (109-minute half-life) and 11C (20-minute half-life) with growing applications of 68Ga (1-hour half life). These short half-lives mean that most PET tracer studies have relatively favorable radiation absorbed dose profiles. These tracers are usually best suited for assessing rather rapid biological processes. Longer-lived positron emitters like I-124 have more limited applications because of their unfavorable dosimetric properties.
SPECT is a method of performing single-photon imaging (a class of imaging techniques in use for over 50 years) and typically involves rotating one or more gamma camera heads about the patient and acquiring, for example, 64 to 128 projection views from varying angles. This allows reconstruction of the 3D distribution of radioactivity in vivo for single-photon emitters.
Common single-photon emitters (so named as they emit at least 1 gamma ray per decay which can travel in any direction) include 99mTc, 123I, 111In, and 131I. Determining the location of the emitted photons in single-photon imaging is typically achieved through the use of a lead collimator with 1 or many holes that provide spatial information. When integrated with CT systems, SPECT can measure radioactivity in vivo with moderate quantitative accuracy, but in general PET is more quantitatively accurate in determining the distribution of radioactivity in vivo.
SPECT radiotracers typically have longer half-lives than PET tracers, but because they often release less energy, often nonparticulate, per decay their dosimetry can be satisfactory. They can be used to study slower biological processes (eg, localization of monoclonal antibodies to tumors which can take several days).
Both PET/CT and SPECT/CT methods allow export of Digital Imaging and Communications in Medicine (DICOM) image datasets for CT and for the nuclear images, which can be imported into radiation therapy planning systems. A critical point for both imaging methods is that routine clinical positioning for optimal patient comfort in a diagnostic study is often not identical to the positioning used in delivery of radiation therapy. It is often highly desirable to perform the studies using a flat table, lasers, and similar imaging equipment. Detailed reviews8,9 describing these methods have been published. PET/CT simulators are an ideal way to minimize differences in patient setup, but these are only available at select centers. Alternatively, one can immobilize the patient in a cradle or mold and use the same device for the separate PET and CT scans. We have recently reported on many of the technical issues associated with using FDG PET/CT to guide IMRT.10
Key Biological Processes in Tumors and Normal Tissues
Cancers differ substantially from normal tissues. Their different shapes, location, and densities allow CT imaging to detect and define many cancers. Despite this, many small tumors and/or subcentimeters or micrometastases are not detected on a CT scan. Nodal metastases are difficult to detect, whereas many enlarged nodes do not contain cancer. If surgical or radiation therapy have distorted the normal anatomy, tumor detection and delineation is quite difficult with a CT scan.
Cancers have a variety of characteristics that are associated with survival advantages. These characteristics are sometimes called hallmarks of cancer. Each of these hallmarks is a potential target for tumor imaging. Several of the molecular imaging agents available for cancer imaging as related to radiation oncology have been reviewed fairly recently.11
Glucose Use
From an imaging standpoint, the increased glucose use seen in cancers is often profound. Increased glucose use is a typical alteration of most cancers and may in part be related to the growth of cancers at the extremes of their blood supply that results in hypoxia. Hypoxia upregulates the GLUT 1 glucose transporter and anaerobic glycolysis, which can provide energy to cells under conditions of profound hypoxia. Cancers also have accelerated glucose use under conditions of more normal oxygenation, and this aerobic glycolysis is recognized as the Warburg effect. The Pasteur effect is when glycolysis increases even more under conditions of hypoxia. The precise mechanisms of this process remain under study but are in part related to hypoxia-inducible factor (HIF)-1α, in part to transforming oncogenes, as well as to a variety of mutations in the glucose utilization pathway.
Most studies of tumors by autoradiography have shown FDG to be distributed throughout most of the viable tumor elements. Although most of the FDG signal is from viable cancer cells, there is a component of uptake in viable infiltrating immune cells, such as white cells of various types, which may cause a false-positive PET signal in the absence of tumor. Although FDG is probably the tracer best suited to detecting tumor extent in the vast majority of cancers, not all cancers are FDG avid, including many prostate cancers (especially the non– castrate-resistant form), hepatomas, and renal adenocarcinomas. Mixed results have been reported regarding FDG avidity for pancreatic cancers and mucinous histology colon cancers. Some tumors are not well seen because of surrounding normal tissues that accumulate FDG (eg, brain tumors). The excreted FDG in the urine and normal accumulation in the stomach, heart, and gut can also confound planning.
Combined PET/CT with FDG has shown superior performance to CT scanning alone in common cancers, such as colorectal cancer, lymphoma, and lung. The reader is referred to several textbooks on the subject of the diagnostic accuracy of FDG PET/CT (eg, Principles and Practice of PET) and other reviews focused on radiation therapy.9,12
If the goal of radiation therapy is cure, then knowing the extent of tumor is critically important. Many FDG-avid tumors are staged by FDG PET/CT (a procedure routinely reimbursed by Medicare in the United States). PET/CT is commonly used for staging lung cancer. With PET/CT, about 15% to 20% of patients with cancers being considered for therapy with local radiation therapy were found to have tumors outside of the expected radiation field, either distant metastases or second primary lesions.13,14
Treatment planning of many types of cancer has been explored with FDG PET. Several recent reviews are available on specific cancers and the use of PET/CT in planning treatment.10,11,15,16 However, in the key areas of tumor imaging as related to radiation oncology, there is little doubt that FDG is the dominant molecular imaging tracer.
There is evidence that PET-based as opposed to CT-based plans expose normal lung to less radiation and higher probabilities of tumor control.17,18 This dose savings to normal tissues is most apparent when mediastinal lymph nodes are excluded from the field of radiation if they are “negative” on PET.17 Patients planned with PET and treated with radiation appear to have superior outcomes to those who were planned without PET (probably in part by eliminating the attempt to cure patients whose disease extends out of therapeutic field at presentation).19
Head and neck cancer has been extensively studied using FDG PET/CT. Early studies showed that FDG PET was more accurate than either CT scans or MRI in detecting recurrent tumors after chemotherapy and irradiation, where anatomic alterations may be confounding. A variety of studies have examined changes in field shapes and sizes using FDG and other tracers in head and neck cancer.20 As an example, in a study of 76 patients with head and neck cancer, PET/CT scanning led to a TNM classification alteration in 34% (12/35), a change in the radiotherapy planning technique and/or dose in 29% (10/35), and altered assessment of treatment response in 43% (13/30). A complete metabolic response on PET was predictive of overall survival (P = .037).21 PET with FDG after treatment in head and neck cancer carries prognostic significance. Patients with higher FDG uptake after radiation treatment have inferior outcomes compared with patients with negative scans.22 The general area of PET and radiation therapy in head and neck cancer has been reviewed recently.23
PET and PET/CT have been applied in cervical cancer as well. Grigsby24 has shown that FDG PET is more sensitive than CT in detecting lymph node metastases of cervical cancer. Furthermore, positive PET scans in lymph nodes in the para-aortic area of cervical cancer patients are associated with worse outcomes than patients with negative para-aortic area lymph nodes. Similarly, positive uptake in the primary tumor after therapy has been associated with a less favorable outcome.24
Such data suggest 2 possibilities: (1) the PET findings are clear markers of a poor prognosis and this cannot be altered with current therapies because the underlying biology is so aggressive (ie, it is simply prognostic) or (2) the PET findings indicate where additional treatment should be delivered and can predict if it will be successful. Clearly, this cannot be known until studies are performed to more intensively treat those patients with high-risk phenotypes of cervical cancer, identifying them before or after therapy. For example, positive para-aortic nodes outside of the field of planned therapy should logically be included in the field of therapy (treatment field expanded). Residual FDG uptake in a tumor presumably will need additional therapy as well.
PET/CT scanning can be used to guide the delivery of brachytherapy to primary cervical cancers and para-aortic nodes.25,26 The timing of response in cervical cancer to radiation therapy may also be predictive of outcome.27 The role of FDG PET in cervical cancer has recently been reviewed by Grigsby. It is important to note that in the posttreatment period, PET can also be useful for surveillance and PET scans performed 3 months after the completion of treatment have clear prognostic value.24
PET/CT scanning has been applied to planning a variety of other FDG-avid cancers. Reports in pancreatic, anal, thymic cancers, and myeloma are but a few of the examples that generally show changes in management by identifying additional lesions and by altering the size of the gross tumor volume (GTV) because of the biological information provided by PET.28–31 Recently, dose reduction in anatomically enlarged but FDG PET–negative lymph nodes of anal cancer has been reported to be a promising approach.32 It must be realized, however, that neither PET nor SPECT can detect microscopic tumor involvement.
Clearly, FDG PET is the main MIGRT approach at the present time, but other approaches should be considered. Although not all the following have been applied yet, it is important to realize the following PET and SPECT agents have variable potential to guide external beam therapies to the relevant areas. An example of the biological tumor volume (BTV) from FDG PET and the GTV from CT scanning is shown in Figure 1 for a patient with pancreatic cancer. These volumes are not identical, and, in this case, the PET volume of tumor is smaller than that of CT scanning.
Figure 1.
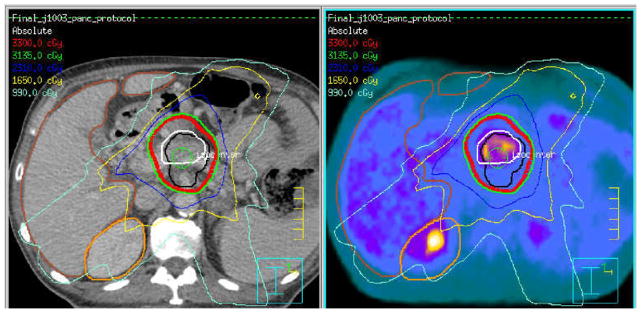
CT-based (left image and black contour) gross tumor volume delineation and FDG PET/CT biological tumor volume (right and white contour). Overlaid isodose distributions are from the CT-based target definition. Potential for booing the most FDG avid tumor region exists.
Flow, Amino Acid Transport, and Membrane Transport
The SPECT tracers 201Tl and 67Ga-citrate have been used to detect tumors of a variety of types.33 Both agents have rather unfavorable imaging and dosimetry characteristics and are being used less often now that FDG PET is available. Nonetheless, these single-photon emitters have been able to identify viable lymphoma; brain tumors; and, in some instances, sarcomas. Their mechanisms of uptake differ from FDG. 201Tl uptake is flow dependent and also depends on intact membrane energetics.
In brain tumors, 201Tl uptake is correlated with blood-brain barrier disruption and may underestimate tumor size versus amino acid tracers, which can also be used for SPECT.34 67Ga uptake in tumors is, in part, related to its behaving as a structural analog to transfer and as an entry to tumor cells via the transferrin receptor.
Amino acid transport and protein synthesis are often increased in cancers. Several amino acid– based PET tracers have been used in PET imaging. The greatest advantages for this type of agent can be seen in non–FDG-avid tumors or in situations like brain tumors in which the normal FDG background activity is too extensive to allow clear distinction of the tumor from normal brain. Although 11C-L-methionine has been used the most, 18F-labeled amino acids or nonnatural amino acids, such as 18F-anti FACBC have shown promise, although the latter displays both wash in and wash out from tumor foci, such as in prostate cancer. Amino acid tracers, such as 11C-methionine, 18F-fluroethyltyrosine, and the SPECT agent 123I-alpha methyl tyrosine, have been applied to plan treatment of patients with brain tumors. Radiation treatment plans based on amino acid accumulation in brain tumors can show more extensive tumor than the simple region of blood brain-barrier enhancement and certainly disparate patterns and discrepancies between GTV and BTV.35,36
Membrane Synthesis and Aerobic Energy Production
Growing tumors require components for membrane synthesis, and tumors that are not hypoxic may have more aerobic energy sources than glycolytic ones. Although our understanding of the exact mechanisms of uptake remains in evolution, it is clear that radiotracers, such as 11C-acetate, 11C-choline, and 18F-fluorocholine, can localize to non–FDG-avid cancers, like prostate cancer, and to a variety of other types of cancer, such as hepatocellular carcinoma (for acetate), that may not be FDG avid. Choline is transported into cancer cells via the choline transporters and appears to be phosphorylated by choline kinase. With time, choline is increasingly incorporated into the cell membrane and cell membrane precursors.
Choline, both 11C- and 18F-labeled analogs (such as fluorcholine and fluoro ethyl choline), have been used in prostate cancer imaging as well as in imaging other cancers. These methods appear to generally be more sensitive for prostate cancer, especially the better differentiated prostate cancers, than FDG PET. Dosimetry estimates have been calculated using choline PET imaging, which have modeled the influence of a localized boost of radiation dose to choline-avid subregions within the prostate gland. Although this specific application may not have yet shown clear clinical benefit, it shows the potential for MIGRT approaches.37,38
Acetate can be used by cancers for oxidative energy production as well as a building block for membrane synthesis. 11C-acetate has been shown to be capable of imaging hepatomas, especially those that are non–FDG avid. Prostate cancer and some head and neck cancers can also be imaged with this tracer. Uptake of the radiotracer appears to be governed, in part, by levels of the enzyme fatty acid synthase.
There has been relatively little work evaluating 11C-acetate for radiation therapy planning. In head and neck cancer, direct comparisons with FDG PET showed the standardized uptake value (SUV) of 11C-acetate avid tumors and nodes to be lower than their SUV for FDG. Tumor volumes estimated from PET were, however, larger for acetate than for FDG. The data on use of 11C-acetate for planning radiation therapy are very limited, but detecting more lesions with acetate than FDG suggests the potential for beneficial modification of treatment plans although much more study is needed.39 An example of a positive 11C-acetate scan in a patient with recurrent prostate cancer and a negative FDG PET scan are shown in Figure 2.
Figure 2.

Prostate cancer imaging with C11 acetate (top panel) and FDG (bottom panel) (JHU series). Note that the C11 acetate images show intense uptake in a lymph node, which appears normal by FDG PET. This node was clinically most consistent with recurrent prostate cancer.
Proliferation
Most, although not all, cancers have increased rates of proliferation. Cancers can grow as long as the rate of cell death is lower than the rate of cell proliferation. Thus, some cancers will have high proliferative rates, and others will have lower rates. In general, cancers with high proliferative rates, if left untreated, are the most lethal and have the worst prognosis. Some therapeutic agents, including radiation and chemotherapy, are more effective in rapidly proliferating than in more quiescent tumors. The measurement of proliferative rates is a key goal of cancer imaging and could have considerable potential for altering radiation therapy treatment plans. Rapidly and slowly proliferating tumors could be identified, responding tumors could be assessed, and tumor re-growth could potentially be measured. Such information could change the approach to the therapy of a specific cancer. It is possible that radiation treatment–induced changes in cell proliferation may occur more rapidly in the presence of effective cancer therapy than changes in more general tumor viability markers, such as FDG, although this remains under study.
Several attempts have been made to study cell proliferation with imaging. At least 2 forms of 11C-thymidine have been applied, but the 20-minute half-life and considerable metabolism are limitations to its use. There can be radioactive CO2 released, which can contaminate the tumor signal. Although 11C-thymidine showed proof of concept, other tracers, most notably 3′-deoxy-3′-fluorothymidine (18F-fluorothymidine [FLT]), which is a substrate for thymidine kinase, have proven more practicable for implementation into clinical imaging trials.
In research applications, it is probable that FLT is second only to FDG in use. However, FLT has some limitations. As a substrate for thymidine kinase, it is able to image only the thymidine “salvage” pathway. If there are high endogenous levels of thymidine present, it is possible that imaging this pathway may be influenced adversely by endogenous thymidine levels. In general, although not invariably, the uptake of FLT in tissue is in the form of FLT phosphate, and the FLT uptake is generally related to the proliferative index measured by other methods.
Proliferation is not unique to tumors, and rapid proliferation can be seen in reactive lymph nodes (with activated lymphocytes in germinal centers) as well as in tumors. FLT uptake in lymph nodes (eg, head and neck cancer) not uncommonly is in reactive as opposed to malignoid lymph nodes.40
Absolute FLT uptake in tumors is often considerably lower than that of FDG so that maximum tumor SUV levels are often about 50% or less than those of FDG. There is often substantial FLT uptake in normal tissues, such as bone marrow, liver, and bowel. Smaller tumors may not be as detectable with FLT as they are with FDG. With a smaller starting SUV, the absolute decline in SUV with therapy is expected to be lower than with FDG. However, this agent is in a variety of clinical trials and has recently been assessed in defining the GTV in esophageal cancer.
A much lower SUV peak cutoff is required to accurately detect tumor sizes with FLT than with FDG (1.4 vs 2.5). FLT will need40 more study and certainly may have its greatest value in assessing early treatment response although it is by no means specific for cancer.41 Autoradiographic studies by our group suggest the signal from FLT is less widely distributed within the tumor than that of FDG, which is consistent with imaging a subset of the BTV as defined by FDG. Another potential role of FLT would be to measure tumor repopulation rates.42 Planning based on FLT PET remains an area of opportunity. An example of a FLT PET study and a FDG PET study in a patient with lung cancer is shown in Figure 3. There is a much more intense visualization of the tumor on the FDG than on the FLT PET study.
Figure 3.

FDG (lower panel) versus FLT (upper) images of lung cancer. Images in untreated lung cancer demonstrate intense FDG uptake in the primary lesion in the left lower lobe with definite but lower FLT uptake in the primary lesion (Courtesy of Dr M. Chaudhry, Johns Hopkins University, Baltimore, MD).
Hypoxia
One of the most exciting areas in MIGRT is the use of agents for imaging hypoxia to define hypoxic tumors that may benefit from more aggressive therapy. The aggressive therapies could include hypofractionation, radiosensitizers, dose escalation, and an alternative form of radiation to overcome radioresistance. Several radiotracers have been developed that have characteristics suitable for imaging hypoxia and are considered hypoxia imaging agents. Interest in this area has been present for many years; although with greater availability of PET/CT scanners, some of the possibilities are now being tested and are testable in both single-center and multicenter trials.43,44
There is little doubt that hypoxia is associated with both resistance to chemotherapy and standard radiation therapy. The oxygen effect is well known to readers of this journal. However, an underlying challenge in hypoxia imaging is whether the hypoxia is diffusely distributed through the tumor or more focal. Focal hypoxia may result in radiation resistance but may be difficult to resolve by PET imaging in which the resolutions are in the 5-mm to 1-cm range.
A variety of radiotracers has been used in attempts to image hypoxia. 18F-fluromisonidazole (FMISO) has been the most extensively evaluated agent. This agent is structurally related to the nonradioactive hypoxia targeting agent, pimonidazole. Both FMISO and pimonidazole are nitroimidazoles that bind to very hypoxic regions. FMISO has a relatively slow blood clearance and develops only relatively low target/background ratios in hypoxic regions. A number of challenges exist with this agent. The relationship between hypoxia and pimonidazole uptake is not always perfect in vivo, and the scale of hypoxia in vivo may be much smaller in some tumors than others. This suggests that hypoxia, at least in small areas of tumors, will be difficult to image with FMISO agents45 and shows a general challenge with molecular imaging agents; the scale of the imaging (resolution) may not be optimally matched to the scale of the biological process. Even if the biological distribution could be imaged at submillimeter resolution, therapeutic photon radiation could not be delivered with this precision because of the fundamental limitations of the physics of radiation transport at high energies. Another concern with hypoxia imaging is that at least 1 report has suggested that hypoxia is inconsistent in tumors and that there is variability of the hypoxic signal using FMISO from day to day in test and retest studies. Some of this variability may be artifactual in that dichotomizing tumors as hypoxic or not based on a cutoff tumor/muscle level of 1.4 or 1.6 to 1 artificially places a cut line on an inherently continuous process. In test-retest studies in vivo, there are challenges with imaging and coregistering precisely the same area of tumor. This may contribute to apparent variability in tracer uptake over time, which may simply be caused by errors in registration.
In all probability, tumor hypoxia is not fully stable.46 This means that challenges are likely to be present if intratumoral “dose painting” is applied over time. If 18F-MISO is used as the basis of the therapeutic plan, its distribution may change over time. This may be beneficial, but it adds complexity to the treatment.46 The temporal variability may be less of an issue if diseases can be treated with hypofractionated regimens in which high doses of radiation are delivered over fewer sessions.
With the ability to image more than 1 aspect of cancer biology, the possibility of targeting the entire tumor (perhaps with FDG and anatomic imaging) and the hypoxic subregions (perhaps with FMISO) may be a useful approach to alter biological dose delivery within tumors. Clearly, the spatial resolution of PET may simply be insufficient to allow for high-resolution delivery of the tumor dose.
There have been several reports showing that the FDG signal and the FMISO signal in head and neck cancers are not identical. There appears to be support for the concept that high FMISO activity in head and neck cancers is associated with a more aggressive phenotype and a less favorable outcome.47 The possibility to target such hypoxic areas within a tumor with an additional radiation dose is thus biologically rational.48
A logical approach to dealing with hypoxic regions identified by imaging with FMISO would be to increase the radiation dose to the area of greatest hypoxia. One group attempted to study the feasibility of boosting the radiation dose to areas of FMISO avidity within FDG-avid tumor volumes. Regions of elevated 18F-FMISO uptake within the FDG PET/CT GTV were targeted for an IMRT boost. Additional targets and/or normal structures were contoured or transferred to treatment planning to generate18F-FMISO PET/CT-guided IMRT plans. The heterogeneous distribution of 18F-FMISO within the GTV showed variable levels of hypoxia within the tumor. It was feasible in planning to dose escalate the GTV (hyopoxic region) to 84 Gy in all 10 patients and in 1 patient to 105 Gy without exceeding the normal tissue tolerance.49
A recent article evaluated 15 patients with locally advanced HNSCC treated with concomitant chemoradiotherapy, who were prospectively imaged with 18F-FDG PET (18F-fluoromisonidazole) and MRI. T1, T2, dynamic-enhanced, and diffusion-weighted sequences were performed before, during, and after radiotherapy. In 7 patients, disease recurred. Disease-free survival correlated negatively with the maximum tissue-to-blood 18F-fluoromisonidazole ratio (T/B[max]) on the baseline 18F-fluoromisonidazole scan (P = .04), with the size of the initial hypoxic volume (P = .04), and with T/B(max) on the 18F-fluoromisonidazole scan during treatment (P = .02). All locoregional recurrences were within the 18F-FDG–avid regions on the baseline 18F-FDG PET; 3 recurrences mapped outside the hypoxic volume on the baseline 18F-fluoromisonidazole PET. Lesions that recurred had lower apparent diffusion coefficients and faster contrast enhancement than nonrecurrent lesions.50
There are other hypoxia-imaging agents under study. Fluoroazomycin arabinoside has been evaluated to some extent and appears to have higher target/background ratios than seen with FMISO. Although the agent is promising, it has only had limited evaluation.51 Similarly, hypoxia agents like 18F-EF5 (Fig. 4) are under study and may, if localization is sufficiently rapid, prove useful for mapping hypoxia.52 The ease of synthesis of such agents varies, and compounds that are difficult to synthesize may be impractical to use widely in clinical trials.
Figure 4.

FDG (left panel) versus EF5 (right panel) images of cancer in the neck. Note that the hypoxic volume on the EF5 scan is considerably smaller than the glycolytic volume identified on FDG PET. (Courtesy of Professor Heikki Minn, Turku U PET Center, Turku, Finland.)
Another promising agent that was developed to image hypoxia is copper (diacetyl-bis (N4-methylthiosemi carbazone)) [Cu ATSM]. Copper radioisotopes offer several possible advantages, including the availability of several radioactive copper isotopes with varying half-lives, including 64Cu (12.7-hour half life), which may make it suitable for test/retest or multitracer studies.53 60Cu and 62Cu have been used in imaging. Chao et al53 showed the feasibility of planning head and neck cancer radiation therapy using Cu ATSM several years ago and showed different radiation distributions than anatomy based plans.54
The potential to identify hypoxic tumors and modify changes in tumor oxygenation with hyperthermia have also been reported in preclinical models using Cu ATSM (“flow and hypoxia”) and copper per-pyruvaldehyde-bis (N4-methyl thio semicarbazone) [Cu PTSM] (“flow”) normalizations.55 Because the Cu agents may have some flow dependence, additional clinical verification studies are needed. However, the images obtained with Cu ATSM agents have been of very high quality, and this agent appears to allow for easier separation of tumor from background activity than has been seen with F-18 fluoromisonidazole. Which will be more predictive of outcomes is uncertain.
Receptors and Tumor Antigens
SPECT agents specific for cancers are limited. One such agent is 111In-Octreoscan (Indium-III-Pentetreotide, Mallinckrudt Medical, St. Louis, MO) (for neuroendocrine tumors). Another is 111In capromab pendetide (ProstaScint, EUSA Pharma, Oxford, UK). The latter has been used in some settings to attempt to boost the dose to prostate cancers.56 This agent suffers from relatively poor accuracy for the detection of prostate cancer.
A 68Ga-labeled PET agent (68Ga-DOTA-toc) for imaging somatostatin receptor–positive neuroendocrine tumors has been developed and appears to be superior to 111In-pente-treotide. This agent has been applied for planning the radiation dose to meningiomas, which can be somatostatin receptor positive. Integration of the DOTA-Tyr3-octreotide (DOTATOC) data led to additional information concerning tumor extension in 17 of 26 patients (65%). Overall, the GTV MRI/CT scanning was larger than the GTV PET in 10 patients (38%), smaller in 13 patients (50%), and almost the same in 3 patients (12%). Most of the adaptations were performed in close vicinity to bony skull base structures or after complex surgery. The median GTV based on MRI was 18.1 mL; the median GTV based on PET was 25.3 mL.57
Normal-Tissue Assessments
The knowledge of the location of normal tissues is typically provided by anatomic imaging, but the functional status of normal tissues can be best depicted by functional imaging. As an example, the path of therapeutic beams through the lungs to treat intrathoracic tumors should ideally spare normal lung tissue. Total sparing of normal lung from radiation may be impossible. However, the least functional areas may be selected to optimize beam entry/exits paths for external beam treatment planning. Irradiation of already damaged lung would not be expected to cause deteriorations in function to as great an extent as seen when normal lung tissue is irradiated. This determination can be made for example using SPECT imaging with 99mTc- (99mTc-MAA [macro aggregated albumin]) perfusion imaging. Such approaches are increasingly possible using more widely available SPECT/CT technology.58
Similarly, agents like 99mTc-HIDA (hepatic iminodiacetic acid) and 99mTc-sulfur colloid depict function of the liver cells or the hepatic reticulo endothelial cells (immobilized macrophages). Other agents with 99mT-DMSA and 99mTc-MAG3 show renal function. Such agents have the potential to monitor normal tissue function in vivo but have not been extensively explored for RT planning. Myocardial perfusion and function can be measured using both single-photon and PET tracers if the heart is to be irradiated.
Practical Issues
For MIGRT to be successful, identification and localization of the relevant tumor characteristics is essential. For FDG PET, the goal would typically be identification of the entire tumor with a good match between the size of the BTV on FDG PET with the true tumor size at histology. For other processes, an accurate match between the extent of the biological process, such as the true hypoxic fraction and the hypoxic volume defined by imaging would be highly desirable.
A large literature has been developed addressing the issue of determining lesion volume from molecular imaging. In early studies, CT scan volumes were compared with FDG PET volumes in untreated lung cancers;59 the tumor size on PET best matched CT tumor volumes when a region of interest was drawn that was 3σ above the mean of the normal lung FDG SUV. This approach worked well in untreated tumors (r = .98) except when there was collapse of the lung distal to the tumor, enlarging the CT volume or in treated tumors. In such instances, the CT-defined volume was, expectedly, higher than the PET-defined volume. In other studies of lung cancer, it was clearly shown that a single SUV cutoff for FDG PET did not result in a reliable estimation of tumor volume relative to the tumor volume from CT scanning. Both SUV cutoffs of 20% and 40% of the maximum SUV value resulted in underestimation of the tumor size versus CT scanning.60
Considerable efforts have been undertaken to precisely match the SUV cutoff for FDG PET (as a percentage of the max single pixel SUV) with tumor size determined at pathology. “Intelligent contouring” in which anatomic and functional cutoff data are used has been shown to be quite reproducible by 1 group.61 A simple numeric SUV cutoff is unlikely to be adequate to define tumor edges because the normal SUV for FDG PET can vary based on patient body habitus. The normal tissue SUV is higher in obese patients than nonobese ones and in specific tumor types.
Daisne and Beriwal62 examined PET versus pathology GTV estimates and found a very good correlation at specific threshold settings. It is improbable that PET will fully replace CT scanning or MRI in defining GTV. Rather, an approach in which the anatomic and functional data are combined, with an overlap of the varying volumes (which are substantially correlated), with possible intensification of dose in the BTV of relevance, will be an evolving approach to delineation.62
Varying characteristics must apply to each radiotracer to optimize thresholding, and it is possible that techniques like kinetic modeling may be useful with some tracers or even FDG.63 Also worth noting is that different tracers will likely require different approaches to accurately extract tumor boundaries. FDG and FLT, for example, require different cutoff values to estimate tumor size properly. This will clearly differ based on tumor size, tumor SUV, and normal tissue SUV (tumor/background uptake ratios) with a lower threshold for FLT- than FDG-based volume estimates.41
A variety of technical issues are present in treatment planning of lung cancer with any tracer. Registration between PET and CT scanning may not be perfect because of respiratory motion. The quantitation of exact SUV in tumors may be altered, and inconsistencies because of motion can affect attenuation maps.64 The size of lesions on PET may be larger than on CT scans because of respiratory effects of blurring during the relatively long duration PET acquisition, which entails multiple respiratory cycles, in contrast to a breath-hold CT scan. Respiratory gating has been applied to help deal with such inconsistencies. If respiratory gating is used with PET, additional radiation dose may occur from additional CT scans required for attenuation correction and additional time for acquisition of images. How to best determine tumor volume from PET remains in evaluation, but real mismatches in lesion size can occur because of the movement of tumors and organs during respiration, which is most important for lesions in the upper abdomen and thorax. It is notable that misregistrations between CT locations of lesions in the thorax on CT scans versus PET are greatest in the lower lung fields but can be 6 mm to 1 cm or more depending on the location.
Pitfalls With FDG and Other Tracers
Although our radiotracers have exquisite specificity for a biological process, the biological process imaged may not always be cancer. Neither FDG nor FLT are tumor specific. Nonspecific uptake has been seen with virtually all PET tracers.40 This may be a particular problem in the post–radiation therapy setting where one observes the infiltration of FDG-avid macrophages.65 Alternative tracers may represent an advantage in this regard.
It is also well known that active infections, reactive lymph nodes, tuberculosis, sarcoidosis, and active inflammation can accumulate FDG. Reactive, nontumor involved, lymph nodes can also have intense accumulation of FLT.40 In addition, there can be transient flares in the extent of tracer accumulation after radiation with increases and decreases in FDG because of the recovery process.
Inflammation
We have taken advantage of the increased FDG uptake in inflammation after surgery to test plans of breast cancer radiation therapy boosts based on the inflammation remaining at the resection site post treatment. Such approaches may be helpful but draw from the non–tumor-specific uptake of the tracer.66 However, it is critically important that the normal uptake pattern and the nonmalignant uptake patterns of radiotracers be known before a specific region of tracer avidity is treated as a malignant process.
Practical Issues in the Translational Process From Bench to Bedside
The table of PET and SPECT imaging agents (Table 1) shows many possibilities for integrating PET and SPECT imaging into radiation therapy planning or monitoring, but many of the agents listed are not Food and Drug Administration approved. Some are under investigation under National Cancer Institute-sponsored Investigational New Drug or individual institution approvals. Others are in use in Europe or Asia/Oceania but not in the United States. Radiopharmaceuticals have limited risks, but the regulatory structure is complex and treats the agents very similarly to therapeutic agents although such agents are typically given in “microdoses.” The cost of securing regulatory approval of the agents for clinical practice can be substantial although it is typically lower than that for therapeutic drugs. Center for Medicare Services payments in the United States for diagnostic imaging agents are much less than for therapeutics.
Table 1.
Molecular Imaging Tools With Potential in MIGRT (Selected Radiopharmaceuticals)
| Agent | Target | Class | Comments |
|---|---|---|---|
| 18F-FDG* | Glucose metabolism, viable tumor | PET | Viable tumor volume, inflammation |
| Thallium 201* | Perfusion, viability | SPECT | Lower energy, long half-life, poor dosimetry |
| Gallium 67 citrate* | General tumor marker Lymphomas including HD | SPECT | Long half-life, poor dosimetry |
| C-11 L-methionine | General tumor marker Amino acid transport |
PET | 20-min half-life of C11 limits availability images many tumor types |
| F-18 fluoroethyl tyrosine (FET) | General tumor marker Amino acid transport |
PET | Applied in brain tumor imaging, especially in Europe |
| F-18 F-anti–ACBC | General tumor marker Amino acid transport |
PET | Investigational. Promise in prostate cancer |
| I-123 alpha methyl tyrosine | General tumor marker Amino acid transport |
SPECT | Applied in brain tumor imaging |
| C-11 acetate | Membrane synthesis, non–FDG-avid tumors | PET | Prostate cancer, hepatomas, etc |
| C-11 choline and F-18 choline analogs | Membrane synthesis, choline metabolism | PET | Prostate cancer, many cancer types |
| C-11 thymidine, fluorothymidine (FLT) | Proliferation tumors Proliferation tumors |
PET PET |
Lung and rapid proliferative tumor |
| F-18 Fluoromisonidazole | Hypoxia | PET | Hypoxic tumors |
| Cu-62, Cu-64 Co-60 ATSM | Hypoxia | PET | Hypoxic tumors |
| F-18 EF5 ([18F]fluoroazomycin-arabinoside [FAZA]) | Hypoxia Hypoxia |
PET PET |
Hypoxic tumors Hypoxic tumors |
| I-123 AZA | Hypoxia | SPECT | Hypoxic tumors |
| F-18 ML-10 | Apoptosis | PET | Apoptosis in tumors |
| Tc99m annexin V | Apoptosis | SPECT | Apoptosis in tumors |
| 18-F RGD binding peptides | Neovasculature | PET | α v β 3 integrins |
| Ga-68 RGD binding peptides | Neovasculature | PET | α v β 3 integrins |
| Tc99m RGD binding peptides | Neovasculature | SPECT | α v β 3 integrins |
| O-15 water | Blood flow | PET | Requires cyclotron, 2 minute half life |
| Tc99m MIBI* | Flow and mitochondrial status | SPECT | Sarcomas, breast cancer, drug resistance? |
| In-111 pentetreotide (Octreoscan-tm)* | Somatostatin receptors | SPECT | Neuroendocrine tumors, SSTR2+ |
| Ga-68 Dota TOC/TATE/NOC | Somatostatin receptors | PET | Neuroendocrine tumors, SSTR2 |
| I-123, I-131 MIBG* | NET-2 transport & vesicular storage | SPECT | Pheo, paragangliomas, neuroblastomas Pheo, paragangliomas, neuroblastoma |
| I-124 MIBG, C-11 HED | NET-2 transport & vesicular storage | PET | Brain tumors and neuroendocrine tumors |
| 18F FDOPA | APUD | PET | Thyroid cancer, reporter gene |
| I-131,* I-123* | Iodine transport & retention | SPECT | Thyroid cancer |
| I-124 | Iodine transport & retention | PET | Prostate ca staging, recurrence |
| In-111 capromab Pendetide (Prostascint)* | Intracellular PSMA | SPECT | Prostate cancer |
| I-123 PSMA binding ligands | Extracellular PSMA | SPECT | Prostate cancer |
| F-18 and Ga 68 PSMA binders | Extracellular PSMA | PET | Bone metastases |
| Tc99m MDP,* HEDP* | Bone remodeling | SPECT | Bone metastases |
| 18F NaF | Bone remodeling | PET | Delineation of normal and abnormal lung or other tissues if IA delivery |
| Tc99m MAA* | Lung perfusion, IA liver perfusion | SPECT | Functional/anatomic mapping |
| Tc99m sulfur colloid* | Liver macrophage function | SPECT | Functional/anatomic mapping |
| Tc99m MAG3,* DMSA* | Kidney function and morphology | SPECT | Functional mapping of hepatocytes/ducts |
| Tc-99m mebrofeninin,* disofenin* | Liver function and excretion | SPECT |
A Food and Drug Administration–approved radiopharmaceutical in the United States. It is clear that a minority of potentially useful radiopharmaceuticals are approved by the US Food and Drug Administration. Such agents are in use in other countries and in research settings in the United States. Some PET tracers are United States Pharmacopeia (USP) approved, such as C-11 methionine, NaF, C-11 acetate, and O-15 water, and may be available at some centers. Note that agents labeled “SPECT” can often be imaged with planar gamma camera imaging in addition to SPECT.
A major problem lies in integrating advanced imaging into radiation therapy and practice. Some of the agents are not patent protected. Several promising agents have very short half-lives (C-11, 20 minutes). The more disease specific the targeting, the smaller the market is. Clearly, many scientifically interesting agents may have a compelling but limited diagnostic utility and may be difficult to translate into practice because the marketplace is small and payments may be low, making commercial risks high. Indeed, except for FDG, which is very widely used, no other PET drug for oncology is in widespread clinical use. NaF, a bone-imaging agent, has the greatest potential because it is generally more accurate than 99mTc-MDP (methylene diphosphonate) and has a projected broad market but as a generic has no clear sponsor. These challenges, plus US Food and Drug Administration regulations on “manufacturing” PET agents, which will go into effect in late 2011, may make the translation process for new agents to practice a difficult and arduous one.
For many of the agents listed in Table 1, no clinical trials of PET in treatment planning have yet been reported. In addition, fee codes in the United States for radiation treatment planning PET studies are lacking. Despite these considerable barriers, the dramatic impact of FDG PET on oncologic imaging and now on radiation therapy planning suggest other MIGRT approaches will emerge and be successful.
Emerging Opportunities
The use of PET/CT scans to generate initial therapeutic plans has been evaluated in a variety of tumor types, with lung, head and neck, and brain tumors highlighted in this discussion although clearly extending broadly across many types of tumor, including pancreas.67 The use of PET/CT of molecular imaging characteristics to modify the treatment course, either by changing the fields or altering the dose, has been considered by several groups, including a recent review on head and neck carcinoma.68 Similarly, the data in cervical cancer have been promising for identifying high-risk groups who can benefit from response adaptation.24 Recent proposed response assessment criteria, like positron emission response criteria in solid tumor, for PET may add greater order to the complexities of estimating tumor response and be useful for adaptation of response as well.69
The concepts that have been outlined by several groups for adaptive planning have been implemented in a clinical trial. In a group of 21 head and neck cancer patients, IMRT and “dose painting by numbers (DPBNs)” was implemented in patients with head and neck cancer. Each patient’s treatment used 3 separate treatment plans: fractions 1–10 used the baseline DPBN18 FDG-PET]) voxel intensity-based IMRT plan based on a pretreatment 18F-FDG-PET/CT scan; fractions 11–20 used a plan based on a 18F-FDG-PET/CT scan acquired after the eighth fraction; and fractions 21–32 used a conventional (uniform dose) IMRT plan. In a phase I trial, 2 dose prescription levels were tested: a median dose of 80.9 Gy to the high-dose clinical target volume (CTV [high-dose] (dose level I) and a median dose of 85.9 Gy to the GTV (dose level II. Treatment adaptation (ie, plans based on the second 18F-FDG-PET/CT scan) reduced the volumes for the GTV (41%, P = .01), CTV (high dose) (18%, P = .01), high-dose planning target volume (14%, P = .02), and parotids (9–12%, P < .05). Because the GTV was much smaller than the CTV (high dose) and target adaptation, further dose escalation at dose level II resulted in less severe toxicity than that observed at dose level I.70
This study, although small, is an example of how PET/CT MIGRT can be implemented. Clearly, larger studies are needed to determine the clinical impact of the approach, especially as it relates to tumor control.
Dose Verification for High-Energy Particle Therapies
Particle beam therapies are seeing increased clinical and research applications. Although such therapy systems can be very expensive, they can offer unique advantages over photon-based IMRT techniques by virtue of the Bragg peak energy deposition profile, which can allow the dose to be delivered in very close proximity to critical structures (eg, the spinal cord or optic nerve). By virtue of the high-energy protons or carbon particles interacting with normal tissues, in vivo activation of tissue can be achieved resulting in the irradiated tissue becoming transiently a positron emitter. This approach has the potential for dose verification in vivo in a manner not previously available.
Short-lived radiotracers, such as 15O (half-life 109 seconds) and 11C, may disappear promptly because of their very short half-life and flow dependence. Studies in normal muscle have shown that about two thirds of radioactivity generated by heavy ion beams washes out with a 4-minute half-life; however, there is a longer-lived component useful for dose deposition verification.71,72 Other longer-lived tracers may be generated and in tissues with low blood flow, such as bone, a more durable signal can be achieved. A variety of recent reports have shown the feasibility of using the in vivo activation of positrons as an imaging tool for verification of the dose distribution.73
Conclusions
FDG PET/CT has revolutionized the diagnosis and follow-up of patients with cancer and is increasingly the test of choice for cancer imaging. The technology also is being more widely applied in radiation oncology to avoid geographic misses, intensify dose to high-risk areas, decrease dose to low-risk areas, and hopefully improve therapeutic outcomes.
A range of additional PET and some SPECT tracers are emerging, which may also have a considerable impact in radiation oncology by portraying, at relatively low resolution, tumor proliferation, hypoxia, non–FDG-avid tumors as well as in displaying normal tissue function. Hybrid functional imaging may help guide dose intensification, dose painting, and adaptive trial designs in which additional intensification/deintensification is performed based on key imaging findings and treatment response to chemotherapeutic and/or targeted agents.
Major challenges remain in this evolving field, including how to precisely define tumor margins, especially for tracers with lower tumor uptake, ensuring registration of CT and molecular imaging data remain precise, issues of variability over the course of many days of radiation treatment, and exactly how to use these powerful data to guide therapy.
Because MIGRT is a rather new area for investigation, it is important that functional imaging and MIGRT are integrated in a systematic manner into clinical trials of radiation oncology, not only for treatment planning but also for diagnosis and response assessment. In an era of constrained resources, studies confirming improved outcomes in patients treated with MIGRT versus standard methods are important and should be performed as the technologies mature.
References
- 1.Gregoire V, Haustermans K, Geets X, et al. PET-based treatment planning in radiotherapy: A new standard? J Nucl Med. 2007;48(suppl 1):68S–77S. [PubMed] [Google Scholar]
- 2.Ling CC, Humm J, Larson S, et al. Towards multidimensional radiotherapy (MD-CRT): Biological imaging and biological conformality. Int J Radiat Oncol Biol Phys. 2000;47:551–560. doi: 10.1016/s0360-3016(00)00467-3. [DOI] [PubMed] [Google Scholar]
- 3.Ott RJ, Tait D, Flower MA, et al. Treatment planning for 131I-mIBG radiotherapy of neural crest tumours using 124I-mIBG positron emission tomography. Br J Radiol. 1992;65:787–791. doi: 10.1259/0007-1285-65-777-787. [DOI] [PubMed] [Google Scholar]
- 4.Ahmadzadehfar H, Sabet A, Biermann K, et al. The significance of 99mTc-MAA SPECT/CT liver perfusion imaging in treatment planning for 90Y-microsphere selective internal radiation treatment. J Nucl Med. 2010;51:1206–1212. doi: 10.2967/jnumed.109.074559. [DOI] [PubMed] [Google Scholar]
- 5.Dewaraja YK, Schipper MJ, Roberson PL, et al. 131I-tositumomab radioimmunotherapy: Initial tumor dose–response results using 3-dimensional dosimetry including radiobiologic modeling. J Nucl Med. 2010;51:1155–1162. doi: 10.2967/jnumed.110.075176. [DOI] [PMC free article] [PubMed] [Google Scholar]
- 6.Forster GJ, Engelbach MJ, Brockmann JJ, et al. Preliminary data on biodistribution and dosimetry for therapy planning of somatostatin receptor positive tumours: Comparison of (86)Y-DOTATOC and (111)In-DTPA-octreotide. Eur J Nucl Med. 2001;28:1743–1750. doi: 10.1007/s002590100628. [DOI] [PubMed] [Google Scholar]
- 7.Hobbs RF, Wahl RL, Lodge MA, et al. 124I PET-based 3D–RD dosimetry for a pediatric thyroid cancer patient: Real-time treatment planning and methodologic comparison. J Nucl Med. 2009;50:1844–1847. doi: 10.2967/jnumed.109.066738. [DOI] [PMC free article] [PubMed] [Google Scholar]
- 8.Nestle U, Weber W, Hentschel M, et al. Biological imaging in radiation therapy: Role of positron emission tomography. Phys Med Biol. 2009;54:R1–25. doi: 10.1088/0031-9155/54/1/R01. [DOI] [PubMed] [Google Scholar]
- 9.Delbeke D, Schoder H, Martin WH, et al. Hybrid imaging (SPECT/CT and PET/CT): Improving therapeutic decisions. Semin Nucl Med. 2009;39:308–340. doi: 10.1053/j.semnuclmed.2009.03.002. [DOI] [PubMed] [Google Scholar]
- 10.Ford EC, Herman J, Yorke E, et al. 18F-FDG PET/CT for image-guided and intensity-modulated radiotherapy. J Nucl Med. 2009;50:1655–1665. doi: 10.2967/jnumed.108.055780. [DOI] [PMC free article] [PubMed] [Google Scholar]
- 11.Schoder H, Ong SC. Fundamentals of molecular imaging: Rationale and applications with relevance for radiation oncology. Semin Nucl Med. 2008;38:119–128. doi: 10.1053/j.semnuclmed.2007.11.006. [DOI] [PubMed] [Google Scholar]
- 12.Delbeke D, Martin WH. Metabolic imaging with FDG: A primer. Cancer J. 2004;10:201–213. doi: 10.1097/00130404-200407000-00001. [DOI] [PubMed] [Google Scholar]
- 13.Igdem S, Alco G, Ercan T, et al. The application of positron emission tomography/computed tomography in radiation treatment planning: Effect on gross target volume definition and treatment management. Clin Oncol (R Coll Radiol) 2010;22:173–178. doi: 10.1016/j.clon.2010.01.003. [DOI] [PubMed] [Google Scholar]
- 14.Mac Manus MP, Hicks RJ, Ball DL, et al. F-18 fluorodeoxyglucose positron emission tomography staging in radical radiotherapy candidates with nonsmall cell lung carcinoma: Powerful correlation with survival and high impact on treatment. Cancer. 2001;92:886–895. doi: 10.1002/1097-0142(20010815)92:4<886::aid-cncr1397>3.0.co;2-v. [DOI] [PubMed] [Google Scholar]
- 15.Aristei C, Falcinelli L, Palumbo B, et al. PET and PET-CT in radiation treatment planning for lung cancer. Expert Rev Anticancer Ther. 2010;10:571–584. doi: 10.1586/era.09.195. [DOI] [PubMed] [Google Scholar]
- 16.Grosu AL, Nestle U, Weber WA. How to use functional imaging information for radiotherapy planning. Eur J Cancer. 2009;45(suppl 1):461–463. doi: 10.1016/S0959-8049(09)70090-5. [DOI] [PubMed] [Google Scholar]
- 17.van Loon J, Offermann C, Bosmans G, et al. 18FDG-PET based radiation planning of mediastinal lymph nodes in limited disease small cell lung cancer changes radiotherapy fields: A planning study. Radiother Oncol. 2008;87:49–54. doi: 10.1016/j.radonc.2008.02.019. [DOI] [PubMed] [Google Scholar]
- 18.De Ruysscher D, Wanders S, Minken A, et al. Effects of radiotherapy planning with a dedicated combined PET-CT-simulator of patients with non-small cell lung cancer on dose limiting normal tissues and radiation dose-escalation: A planning study. Radiother Oncol. 2005;77:5–10. doi: 10.1016/j.radonc.2005.06.014. [DOI] [PubMed] [Google Scholar]
- 19.Kalff V, Hicks RJ, MacManus MP, et al. Clinical impact of (18)F fluorodeoxyglucose positron emission tomography in patients with non-small-cell lung cancer: A prospective study. J Clin Oncol. 2001;19:111–118. doi: 10.1200/JCO.2001.19.1.111. [DOI] [PubMed] [Google Scholar]
- 20.Macmanus M, D’Costa I, Everitt S, et al. Comparison of CT and positron emission tomography/CT coregistered images in planning radical radiotherapy in patients with non-small-cell lung cancer. Australas Radiol. 2007;51:386–393. doi: 10.1111/j.1440-1673.2007.01755.x. [DOI] [PubMed] [Google Scholar]
- 21.Connell CA, Corry J, Milner AD, et al. Clinical impact of, and prognostic stratification by, F-18 FDG PET/CT in head and neck mucosal squamous cell carcinoma. Head Neck. 2007;29:986–995. doi: 10.1002/hed.20629. [DOI] [PubMed] [Google Scholar]
- 22.Aerts HJ, van Baardwijk AA, Petit SF, et al. Identification of residual metabolic-active areas within individual NSCLC tumours using a pre-radiotherapy, 18fluorodeoxyglucose-PET-CT scan. Radiother Oncol. 2009;91:386–392. doi: 10.1016/j.radonc.2009.03.006. [DOI] [PMC free article] [PubMed] [Google Scholar]
- 23.Corry J, Rischin D, Hicks RJ, et al. The role of PET-CT in the management of patients with advanced cancer of the head and neck. Curr Oncol Rep. 2008;10:149–155. doi: 10.1007/s11912-008-0023-x. [DOI] [PubMed] [Google Scholar]
- 24.Grigsby PW. PET/CT imaging to guide cervical cancer therapy. Futures Oncol. 2009;5:953–958. doi: 10.2217/fon.09.70. [DOI] [PubMed] [Google Scholar]
- 25.Lin LL, Mutic S, Low DA, et al. Adaptive brachytherapy treatment planning for cervical cancer using FDG-PET. Int J Radiat Oncol Biol Phys. 2007;67:91–96. doi: 10.1016/j.ijrobp.2006.08.017. [DOI] [PubMed] [Google Scholar]
- 26.Esthappan J, Chaudhari S, Santanam L, et al. Prospective clinical trial of positron emission tomography/computed tomography image-guided intensity-modulated radiation therapy for cervical carcinoma with positive para-aortic lymph nodes. Int J Radiat Oncol Biol Phys. 2008;72:1134–1139. doi: 10.1016/j.ijrobp.2008.02.063. [DOI] [PubMed] [Google Scholar]
- 27.Schwarz JK, Lin LL, Siegel BA, et al. 18-F-fluorodeoxyglucose-positron emission tomography evaluation of early metabolic response during radiation therapy for cervical cancer. Int J Radiat Oncol Biol Phys. 2008;72:1502–1507. doi: 10.1016/j.ijrobp.2008.03.040. [DOI] [PubMed] [Google Scholar]
- 28.Winton E, Heriot AG, Ng M, et al. The impact of 18-fluorodeoxyglu-cose positron emission tomography on the staging, management and outcome of anal cancer. Br J Cancer. 2009;100:693–700. doi: 10.1038/sj.bjc.6604897. [DOI] [PMC free article] [PubMed] [Google Scholar]
- 29.Kim PJ, Hicks RJ, Wirth A, et al. Impact of 18F-fluorodeoxyglucose positron emission tomography before and after definitive radiation therapy in patients with apparently solitary plasmacytoma. Int J Radiat Oncol Biol Phys. 2009;74:740–746. doi: 10.1016/j.ijrobp.2008.08.037. [DOI] [PubMed] [Google Scholar]
- 30.Lee JW, Mac Manus M, Hogg A, et al. Clinical influence of 18F-fluoro-deoxyglucose positron emission tomography on the management of primary tumours of the thymus. J Med Imaging Radiat Oncol. 2008;52:254–61. doi: 10.1111/j.1440-1673.2008.01955.x. [DOI] [PubMed] [Google Scholar]
- 31.Leong T, Everitt C, Yuen K, et al. A prospective study to evaluate the impact of FDG-PET on CT-based radiotherapy treatment planning for oesophageal cancer. Radiother Oncol. 2006;78:254–261. doi: 10.1016/j.radonc.2006.02.014. [DOI] [PubMed] [Google Scholar]
- 32.Mai SK, Welzel G, Hermann B, et al. Can the radiation dose to CT-enlarged but FDG-PET-negative inguinal lymph nodes in anal cancer be reduced? Strahlenther Onkol. 2009;185:254–259. doi: 10.1007/s00066-009-1944-5. [DOI] [PubMed] [Google Scholar]
- 33.Jerusalem G, Hustinx R, Beguin Y, et al. Positron emission tomography imaging for lymphoma. Curr Opin Oncol. 2005;17:441–445. doi: 10.1097/01.cco.0000174041.29557.5c. [DOI] [PubMed] [Google Scholar]
- 34.Weckesser M, Matheja P, Rickert C, et al. Evaluation of the extension of cerebral gliomas by scintigraphy. Strahlenther Onkol. 2000;176:180–185. doi: 10.1007/s000660050054. [DOI] [PubMed] [Google Scholar]
- 35.Weber DC, Casanova N, Zilli T, et al. Recurrence pattern after [(18)F]fluoroethyltyrosine-positron emission tomography-guided radiotherapy for high-grade glioma: A prospective study. Radiother Oncol. 2009;93:586–592. doi: 10.1016/j.radonc.2009.08.043. [DOI] [PubMed] [Google Scholar]
- 36.Grosu AL, Weber WA, Riedel E, et al. L-(methyl-11C) methionine positron emission tomography for target delineation in resected high-grade gliomas before radiotherapy. Int J Radiat Oncol Biol Phys. 2005;63:64–74. doi: 10.1016/j.ijrobp.2005.01.045. [DOI] [PubMed] [Google Scholar]
- 37.Pinkawa M, Attieh C, Piroth MD, et al. Dose-escalation using intensity-modulated radiotherapy for prostate cancer—Evaluation of the dose distribution with and without 18F-choline PET-CT detected simultaneous integrated boost. Radiother Oncol. 2009;93:213–219. doi: 10.1016/j.radonc.2009.07.014. [DOI] [PubMed] [Google Scholar]
- 38.Niyazi M, Bartenstein P, Belka C, et al. Choline PET based dose-painting in prostate cancer—Modelling of dose effects. Radiol Oncol. 2010;5:23. doi: 10.1186/1748-717X-5-23. [DOI] [PMC free article] [PubMed] [Google Scholar]
- 39.Sun A, Sorensen J, Karlsson M, et al. 1-[11C]-acetate PET imaging in head and neck cancer—A comparison with 18F-FDG-PET: Implications for staging and radiotherapy planning. Eur J Nucl Med Mol Imaging. 2007;34:651–657. doi: 10.1007/s00259-006-0298-9. [DOI] [PubMed] [Google Scholar]
- 40.Troost EG, Vogel WV, Merkx MA, et al. 18F-FLT PET does not discriminate between reactive and metastatic lymph nodes in primary head and neck cancer patients. J Nucl Med. 2007;48:726–735. doi: 10.2967/jnumed.106.037473. [DOI] [PubMed] [Google Scholar]
- 41.Han D, Yu J, Yu Y, et al. Comparison of (18)F-fluorothymidine and (18)F-fluorodeoxyglucose PET/CT in delineating gross tumor volume by optimal threshold in patients with squamous cell carcinoma of thoracic esophagus. Int J Radiat Oncol Biol. 2010;76:1235–1241. doi: 10.1016/j.ijrobp.2009.07.1681. [DOI] [PubMed] [Google Scholar]
- 42.Wang JZ, Li XA. Impact of tumor repopulation on radiotherapy planning. Int J Radiat Oncol Biol Phys. 2005;61:220–227. doi: 10.1016/j.ijrobp.2004.09.043. [DOI] [PubMed] [Google Scholar]
- 43.Chapman JD, Engelhardt EL, Stobbe CC, et al. Measuring hypoxia and predicting tumor radioresistance with nuclear medicine assays. Radiother Oncol. 1998;46:229–237. doi: 10.1016/s0167-8140(97)00186-2. [DOI] [PubMed] [Google Scholar]
- 44.Rajendran JG, Hendrickson KR, Spence AM, et al. Hypoxia imaging-directed radiation treatment planning. Eur J Nucl Med Mol Imaging. 2006;33(suppl 1):44–53. doi: 10.1007/s00259-006-0135-1. [DOI] [PubMed] [Google Scholar]
- 45.Troost EG, Laverman P, Philippens ME, et al. Correlation of [18F]FMISO autoradiography and pimonidazole [corrected] immuno-histochemistry in human head and neck carcinoma xenografts. Eur J Nucl Med Mol Imaging. 2008;35:1803–1811. doi: 10.1007/s00259-008-0772-7. [DOI] [PubMed] [Google Scholar]
- 46.Lin Z, Mechalakos J, Nehmeh S, et al. The influence of changes in tumor hypoxia on dose-painting treatment plans based on 18F-FMISO positron emission tomography. Int J Radiat Oncol Biol Phys. 2008;70:1219–1228. doi: 10.1016/j.ijrobp.2007.09.050. [DOI] [PMC free article] [PubMed] [Google Scholar]
- 47.Thorwarth D, Eschmann SM, Holzner F, et al. Combined uptake of [18F]FDG and [18F]FMISO correlates with radiation therapy outcome in head-and-neck cancer patients. Radiother Oncol. 2006;80:151–156. doi: 10.1016/j.radonc.2006.07.033. [DOI] [PubMed] [Google Scholar]
- 48.Thorwarth D, Eschmann SM, Paulsen F, et al. Hypoxia dose painting by numbers: A planning study. Int J Radiat Oncol Biol Phys. 2007;68:291–300. doi: 10.1016/j.ijrobp.2006.11.061. [DOI] [PubMed] [Google Scholar]
- 49.Lee NY, Mechalakos JG, Nehmeh S, et al. Fluorine-18-labeled fluoromisonidazole positron emission and computed tomography-guided intensity-modulated radiotherapy for head and neck cancer: A feasibility study. Int J Radiol Oncol J Biol Phys. 2008;70:2–13. doi: 10.1016/j.ijrobp.2007.06.039. [DOI] [PMC free article] [PubMed] [Google Scholar]
- 50.Dirix P, Vandecaveye V, De Keyzer F, et al. Dose painting in radiotherapy for head and neck squamous cell carcinoma: Value of repeated functional imaging with (18)F-FDG PET, (18)F-fluoromisonidazole PET, diffusion-weighted MRI, and dynamic contrast-enhanced MRI. J Nucl Med. 2009;50:1020–7. doi: 10.2967/jnumed.109.062638. [DOI] [PubMed] [Google Scholar]
- 51.Grosu AL, Souvatzoglou M, Roper B, et al. Hypoxia imaging with FAZA-PET and theoretical considerations with regard to dose painting for individualization of radiotherapy in patients with head and neck cancer. Int J Radiat Oncol Biol Phys. 2007;69:541–551. doi: 10.1016/j.ijrobp.2007.05.079. [DOI] [PubMed] [Google Scholar]
- 52.Basu S, Alavi A. Molecular imaging (PET) of brain tumors. Neuroimaging Clin N Am. 2009;19:625–646. doi: 10.1016/j.nic.2009.08.012. [DOI] [PubMed] [Google Scholar]
- 53.Wong TZ, Lacy JL, Petry NA, et al. PET of hypoxia and perfusion with 62Cu-ATSM and 62Cu-PTSM using a 62Zn/62Cu generator. AJR Am J Roentgenol. 2008;190:427–432. doi: 10.2214/AJR.07.2876. [DOI] [PMC free article] [PubMed] [Google Scholar]
- 54.Chao KS, Bosch WR, Mutic S, et al. A novel approach to overcome hypoxic tumor resistance: Cu-ATSM-guided intensity-modulated radiation therapy. Int J Radiat Oncol Biol Phys. 2001;49:1171–1182. doi: 10.1016/s0360-3016(00)01433-4. [DOI] [PubMed] [Google Scholar]
- 55.Myerson RJ, Singh AK, Bigott HM, et al. Monitoring the effect of mild hyperthermia on tumour hypoxia by Cu-ATSM PET scanning. Int J Hyperthermia. 2006;22:93–115. doi: 10.1080/02656730600594191. [DOI] [PubMed] [Google Scholar]
- 56.Ellis RJ, Kaminsky DA. Fused radioimmunoscintigraphy for treatment planning. Rev Urol. 2006;8(suppl 1):S11–S19. [PMC free article] [PubMed] [Google Scholar]
- 57.Gehler B, Paulsen F, Oksuz MO, et al. [68Ga]-DOTATOC-PET/CT for meningioma IMRT treatment planning. Radiol Oncol. 2009;4:56. doi: 10.1186/1748-717X-4-56. [DOI] [PMC free article] [PubMed] [Google Scholar]
- 58.McGuire SM, Zhou S, Marks LB, et al. A methodology for using SPECT to reduce intensity-modulated radiation therapy (IMRT) dose to functioning lung. Int J Radiat Oncol Biol Phys. 2006;66:1543–1552. doi: 10.1016/j.ijrobp.2006.07.1377. [DOI] [PubMed] [Google Scholar]
- 59.Zasadny KR, Kison PV, Francis IR, et al. FDG PET determination of metabolically active tumor volume and comparison with CT. Clin Positron Imaging. 1998;1:123–129. doi: 10.1016/s1095-0397(98)00007-7. [DOI] [PubMed] [Google Scholar]
- 60.Biehl KJ, Kong FM, Dehdashti F, et al. 18F-FDG PET definition of gross tumor volume for radiotherapy of non-small cell lung cancer: Is a single standardized uptake value threshold approach appropriate? J Nucl Med. 2006;47:1808–1812. [PubMed] [Google Scholar]
- 61.Bayne M, Hicks RJ, Everitt S, et al. Reproducibility of “intelligent” contouring of gross tumor volume in non-small-cell lung cancer on PET/CT images using a standardized visual method. Int J Radiat Oncol Biol Phys. 2010;77:1151–1157. doi: 10.1016/j.ijrobp.2009.06.032. [DOI] [PubMed] [Google Scholar]
- 62.Gupta T, Beriwal S. PET/CT-guided radiation therapy planning: From present to the future. Indian J Cancer. 2010;47:126–133. doi: 10.4103/0019-509X.63000. [DOI] [PubMed] [Google Scholar]
- 63.Haggstrom I, Johansson L, Larsson A, et al. Semi-automatic tumour segmentation by selective navigation in a three-parameter volume, obtained by voxel-wise kinetic modelling of 11C-acetate. Radiat Protect Dosim. 2010;139:214–218. doi: 10.1093/rpd/ncq075. [DOI] [PubMed] [Google Scholar]
- 64.Nagel CC, Bosmans G, Dekker AL, et al. Phased attenuation correction in respiration correlated computed tomography/positron emitted tomography. Med Phys. 2006;33:1840–1847. doi: 10.1118/1.2198170. [DOI] [PubMed] [Google Scholar]
- 65.Poettgen C, Theegarten D, Eberhardt W, et al. Correlation of PET/CT findings and histopathology after neoadjuvant therapy in non-small cell lung cancer. Oncology. 2007;73:316–323. doi: 10.1159/000134474. [DOI] [PubMed] [Google Scholar]
- 66.Ford EC, Lavely WC, Frassica DA, et al. Comparison of FDG-PET/CT and CT for delineation of lumpectomy cavity for partial breast irradiation. Int J Radiat Oncol Biol Phys. 2008;71:595–602. doi: 10.1016/j.ijrobp.2008.02.004. [DOI] [PubMed] [Google Scholar]
- 67.Schellenberg D, Quon A, Minn AY, et al. 18Fluorodeoxyglucose PET is prognostic of progression-free and overall survival in locally advanced pancreas cancer treated with stereotactic radiotherapy. Int J Radiol Oncol J Biol Phys. 2010;77:1420–1425. doi: 10.1016/j.ijrobp.2009.06.049. [DOI] [PubMed] [Google Scholar]
- 68.Wahl RL, Jacene H, Kasamon Y, et al. From RECIST to PERCIST: Evolving considerations for PET response criteria in solid tumors. J Nucl Med. 2009;50(suppl 1):122S–150S. doi: 10.2967/jnumed.108.057307. [DOI] [PMC free article] [PubMed] [Google Scholar]
- 69.Bussink J, van Herpen CM, Kaanders JH, et al. PET-CT for response assessment and treatment adaptation in head and neck cancer. Lancet Oncol 2010. 2010;11:661–669. doi: 10.1016/S1470-2045(09)70353-5. [DOI] [PubMed] [Google Scholar]
- 70.Duprez F, De Neve W, De Gersem W, et al. Adaptive dose painting by numbers for head-and-neck cancer. Int J Radiat Oncol Biol Phys. 2010 Jul 17; doi: 10.1016/j.ijrobp.2010.03.028. Epub ahead of print. [DOI] [PubMed] [Google Scholar]
- 71.Tomitani T, Pawelke J, Kanazawa M, et al. Washout studies of 11C in rabbit thigh muscle implanted by secondary beams of HIMAC. Phys Med Biol. 2003;48:875–889. doi: 10.1088/0031-9155/48/7/305. [DOI] [PubMed] [Google Scholar]
- 72.Mizuno H, Tomitani T, Kanazawa M, et al. Washout measurement of radioisotope implanted by radioactive beams in the rabbit. Phys Med Biol. 2003;48:2269–2281. doi: 10.1088/0031-9155/48/15/302. [DOI] [PubMed] [Google Scholar]
- 73.Fiedler F, Shakirin G, Skowron J, et al. On the effectiveness of ion range determination from in-beam PET data. Phys Med Biol. 2010;55:1989–1998. doi: 10.1088/0031-9155/55/7/013. [DOI] [PubMed] [Google Scholar]