Abstract
The origins of neural systems remain unresolved. In contrast to other basal metazoans, ctenophores, or comb jellies, have both complex nervous and mesoderm-derived muscular systems. These holoplanktonic predators also have sophisticated ciliated locomotion, behaviour and distinct development. Here, we present the draft genome of Pleurobrachia bachei, Pacific sea gooseberry, together with ten other ctenophore transcriptomes and show that they are remarkably distinct from other animal genomes in their content of neurogenic, immune and developmental genes. Our integrative analyses place Ctenophora as the earliest lineage within Metazoa. This hypothesis is supported by comparative analysis of multiple gene families, including the apparent absence of HOX genes, canonical microRNA machinery, and reduced immune complement in ctenophores. Although two distinct nervous systems are well-recognized in ctenophores, many bilaterian neuron-specific genes and genes of “classical” neurotransmitter pathways either are absent or, if present, are not expressed in neurons. Our metabolomic and physiological data are consistent with the hypothesis that ctenophore neural systems, and possibly muscle specification, evolved independently from those in other animals.
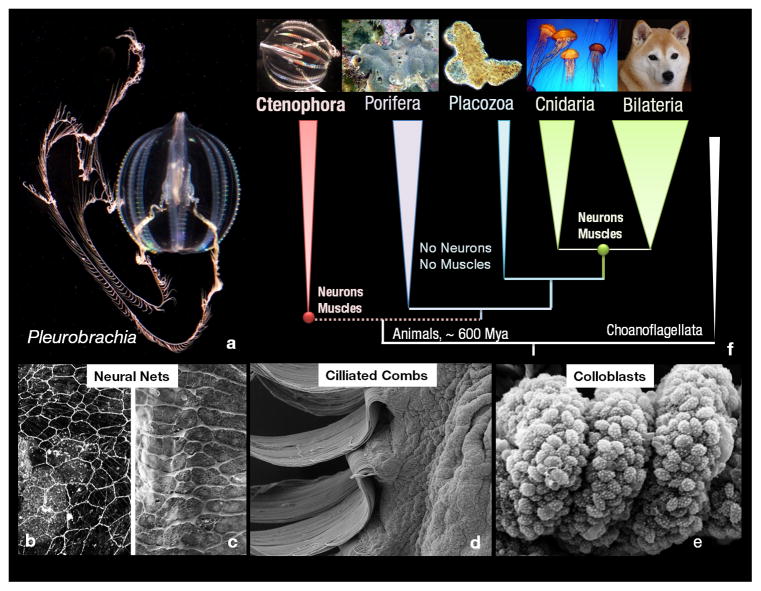
Approximately 150 recognized species of comb jellies form a clade of pre-bilaterian animals1–3(Fig. 1f) with an elusive genealogy, possibly tracing their ancestry to the Ediacaran biota4,5. We selected the Pacific sea gooseberry, Pleurobrachia bachei (A. Agassiz, 1860, Fig. 1a, Extended_Data_Fig. 1, Supplementary_Data_SD1 and videos) as a model ctenophore due to preserved traits thought ancestral for this lineage (e.g. cydippid larva and tentacles). Three next-generation sequencing platforms (454/Illumina/Ion Torrent) were used to obtain >700-fold coverage (Supplementary_Tables_1–2S) of Pleurobrachia’s genome, and about 2,000-fold coverage of the transcriptome representing all major organs and developmental stages (Supplementary_Tables_3–4S). Consequently, the draft assembly was 156,146,497 base pairs (bp) with 19,523 predicted protein-coding genes (Supplementary_Tables_5–7S). About 90% of these predicted genes are expressed in at least one tissue or developmental stage (Supplementary_Methods) and 44% of Pleurobrachia genes have orthologs in other animals (Supplementary_Tables_7–8S). More than 300 families of transposable elements (TEs) constitute at least 8.5% of the genome (Supplementary_Table_9S, Supplementary_Data_SD2) with numerous examples of diversification of some ancient TE classes (e.g. transposases, reverse transcriptases, etc). Approximately 1.0% of the genome is methylated. Pleurobrachia also employs DNA demethylation during development, with both 5-hydroxymethyl cytosine (5hmC) and its synthetic enzyme TET6 (Extended_Data_Fig. 2). The obtained genome and transcriptome data provide rich resources (http://moroz.hpc.ufl.edu/) for investigating both animal phylogeny and evolution of animal innovations including nervous systems2,3,7–9.
Figure 1. Ctenophores and their innovations.
a, The sea gooseberry, Pleurobrachia bachei (Fig. 1S) was selected as a target for genome sequencing due to preservation of traits ancestral for this lineage and since in situ hybridization/immunolabeling is possible. b–d: Major ctenophore innovations. b, Nervous system revealed by tyrosinated α-tubulin immunolabeling; c, Scanning electron microscopy (SEM) imaging of nerve net in a tentacle pocket (scale:15μm). d, Locomotory ciliated combs (SEM, scale:100μm). e, Glue-secreting cells – Colloblasts in tentacles (SEM, scale:50μm). f, Relationships among major animal clades with Choanoflagellates sister to all Metazoa.
Ctenophore Phylogeny
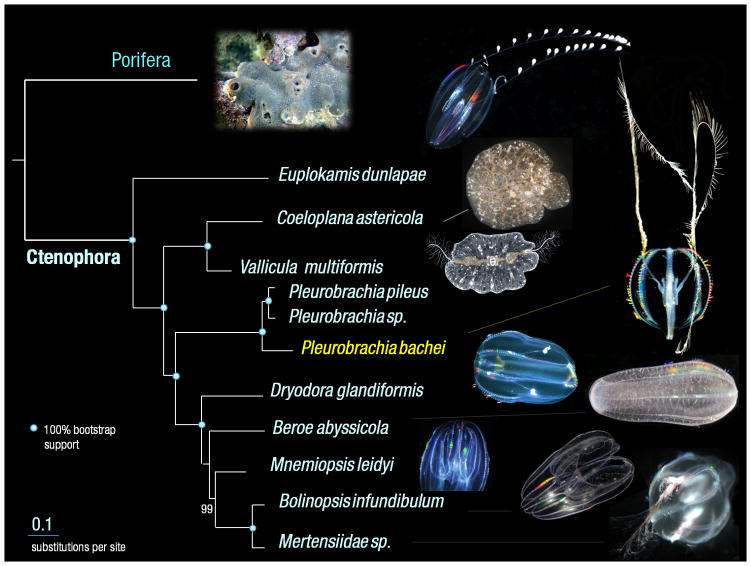
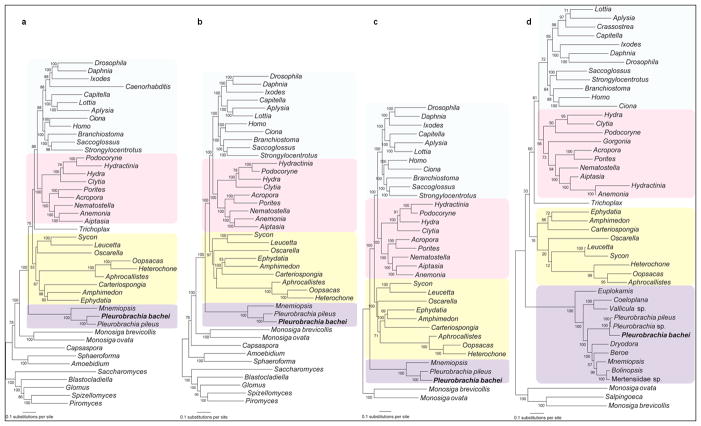
Although, relationships among basal animal lineages are controversial1,10–16, our analyses (Supplementary_Information_SD4) with Ctenophora represented by Pleurobrachia and Mnemiopsis suggest the placement of Ctenophora as the basal animal lineage (Fig. 1, Extended_Data_Fig. 3). Porifera was recovered sister to remaining metazoans (bs=100%) with Cnidaria sister to Bilateria (bs=100%, Fig. 1f). Shimodaira-Hasegawa (SH)-tests17(corresponding to Extended_Data_Fig. 3a, b, c with 586 gene matrix), rejected both Eumetazoa (sponges sister to all other metazoans) and Coelenterata (Cnidaria+Ctenophora). Placement of Ctenophora at the base of Metazoa also provides the most parsimonious explanation of the pattern of global gene gain/loss seen across major animal clades (Fig. 3, Supplementary_Table_14a, bS). Transcriptome data from ten additional ctenophores (Supplementary_Table_13S) with stricter criteria for orthology inference (Supplementary_Methods SM7), also placed ctenophores basal, albeit with less support (Extended_Data_Fig. 3d). When the most conserved set of genes was considered (Supplementary_Information_SM7.5/SD4.3), the topology was unresolved. Weak support is likely due to underrepresentation of comparable transcriptomes from sponges and large protein divergence. Nevertheless, SH-tests based on expanded ctenophore sampling (with a reduced 114 gene matrix due to lack of other ctenophore and sponge genomes – Supplementary_Methods_SD7.2) also rejected Coelenterata but not Eumetazoa. Importantly, relationships within Ctenophora were strongly supported (Fig. 2). Both cydippid and lobate ctenophores, previously viewed as monophyletic clades, were recovered as polyphyletic, suggesting independent loss of both the cydippid larval stage and tentacle apparatus. Interestingly, Platyctenida was the second basal-most branch in the Ctenophore clade, suggesting their benthic and bilaterial nature are secondarily derived.
Figure 3. Gene gain and gene loss in ctenophores.
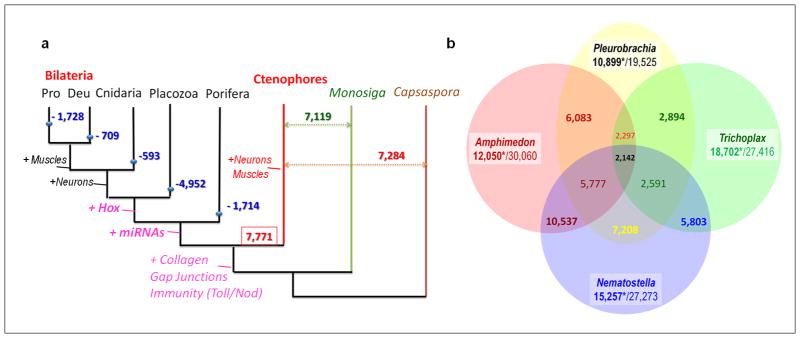
a, Predicted scope of gene loss (blue numbers – e.g.–4,952 in Placozoa) from the common metazoan ancestor. Red and green numbers indicate genes shared between bilaterians and ctenophores (7,771), as well as between ctenophores and other eukaryotic lineages sister to animals, respectively. Text on tree indicates emergence of complex animal traits and gene families. b, Uniquely shared and lineage-specific genes among basal metazoans. Values under species names indicate number of genes (*) without any recognized homologs (e-value is 10−4) vs the total number of predicted gene models in are relevant species (Supplementary Table_14bS).
Figure 2. Phylogenomic reconstruction among major ctenophore lineages.
Cydippid (Euplokamis, Pleurobrachia, Dryodora, and Mertensiidae) and lobate (Beroe, Mnemiopsis and Bolinopsis) ctenophores were polyphyletic, suggesting independent loss of both cydippid larval stage and tentacle apparatus as well as independent development of bilateral symmetry in benthic/aberrant ctenophores, Vallicula and Coeloplana (Supplementary_Data SD4).
A highly reduced complement of animal-specific genes is a feature shared for the entire ctenophore lineage (Fig. 3, Supplementary_Table_15S). HOX genes involved in anterio-posterior patterning of body axes and present in all metazoans are absent in ctenophores and sponges18 (Supplementary Tables_17–18S). Likewise, canonical microRNA machinery (i.e. Drosha/Pasha, Supplementary Table_19S) is lacking in Pleurobrachia and other ctenophores. Using small RNA sequencing from Pleurobrachia, Bolinopsis and Beroe, we were unable to experimentally detect microRNAs (Supplementary_Data_SD5.4). Pleurobrachia also lacks major elements of initiate innate immunity such as pattern recognition receptors (Toll-like, Nod-like, RIG-like, Ig-TIR) and immune mediators, MyD88 and RHD TFs, that are present in bilaterians, cnidarians and, in divergent forms, in sponges19,20 (Supplementary_Table_20S).
Key bilaterian myogenic/mesoderm-specification genes are absent in Pleurobrachia’s genome and transcriptomes of ten other ctenophores (Supplementary_Tables_35S). These data suggest that muscles21 and, possibly, mesoderm evolved independently in Ctenophora to control the hydroskeleton, body shape and food capture. Thus, ctenophores might have independently developed complex phenotypic plasticity and tissue organization, raising questions about the nature of ctenophore-specific traits such as their unique development, combs, tentacles and aboral/apical organs, nervous systems.
Ctenophore Innovations
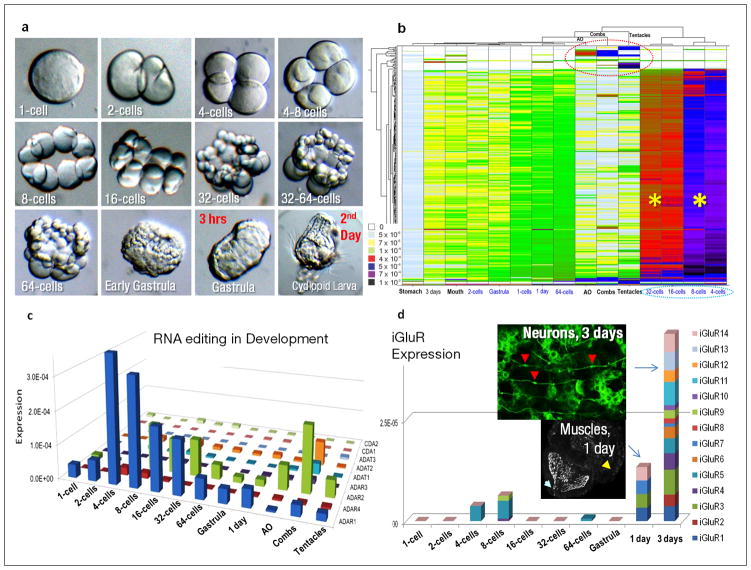
To assess genomic bases of ctenophore-specific innovations, we performed RNA-seq profiling of the major developmental stages (Fig. 4a, b) as well as adult organs and identified genes differentially expressed in these structures. Many Pleurobrachia genes, that have no homologs in other species, are specifically expressed and most abundant during the 4- to 32-cell cleavage stages as well as in tentacles, combs and the aboral organ (Fig. 4b, Extended_Data_Fig. 4). Thus, structures that are known as ctenophore innovations (Fig. 1d, e) have the largest complement of highly expressed Pleurobrachia/ctenophore specific-genes. These data suggest extensive gene gain in cell lineages associated with early segregation of developmental potential leading to ctenophore-specific traits in structures controlling feeding, locomotion and integrative functions; a finding consistent with hypothesized ‘orphan’ genes contributing to variation in early development and evolution of novelties22,23.
Figure 4. Nature of Ctenophore Innovations.
a, Main developmental stages in Pleurobrachia from eggs to the cleavage (2–64 cells), gastrulation (1–3 hrs) and formation of cydippid larvae (~24 hours). b, Hierarchical clustering of approximately 400 ctenophore-specific genes differentially expressed among different development stages and adult structures as revealed by RNA-seq experiments. Color index as follows: black indicates highest level of expression, followed by purple, red then down to white indicating no expression. Most of these ctenophore-specific genes are primarily expressed during 4–32 cell stages (asterisks). The red circle indicates a subset of novel genes uniquely expressed in combs, tentacles and the aboral organ. These genes lack recognized homologs in other organisms. c, Diversity and differential expression of RNA editing genes in Pleurobrachia development and adult tissues (RNA-seq). ADAR1 has highest expression level in early cleavage stages while ADAR2-3 and ADAT1-2 are most abundant in the combs. d, Morphological appearance of neurons during 3rd day of development (the top insert, neuronal cell bodies are stained tyrosinated α-tubulin antibodies, red arrows) correlates with abundant expression of multiple iGluR receptors suggesting that Glutamate plays an important role as an intercellular messenger. Muscles formed well before neuronal differentiation at end of 1st day of development (the bottom insert, phalloidin staining, yellow arrow); white arrow points to the embryonic mouth with hundreds of cilia inside. In c and d expression levels of RNA editing or iGluRs genes shown as a normalized frequency of sequence reads for a given transcript from all RNA-seq data for each developmental stage (Supplementary Methods).
Examples of known metazoan gene families that are considerably expanded in Ctenophora (Supplementary_Data_SD5, Table_16S), include collagens, RNA editing enzymes and RNA-binding proteins (Supplementary_Data_SD5). Pleurobrachia’s genome encodes the most RNA editing enzymes (ADAR1-4/ADAT1-3/CDA1-2) reported among metazoans24,25 (Supplementary_Data_SD5.5), possibly acting as the generalized mechanism generating posttranscriptional diversity and ctenophore-specific traits in locomotory and integrative structures (combs+aboral organ). Matching expansion of RNA regulatory mechanisms, Pleurobrachia has more RNA binding proteins (RBPs, especially RRM/ELAV, KH and NOVAs26,27, Supplementary_Table_21S) than any basal metazoan or choanoflagellate examined. Dozens of RBPs are selectively expressed and abundant during 8–64 cell stages (Supplementary_Table_31S), and might contribute to sequestration of RNAs and segregation in developmental potential leading to early cell-fate specification.
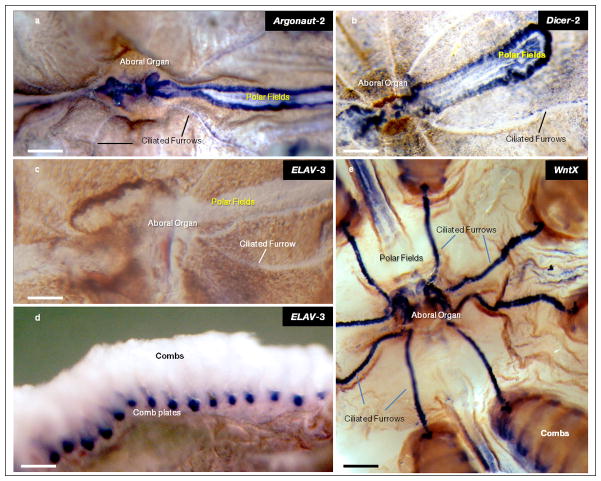
Phenotypic complexity positively correlates with presence and high differential expression of 92 homeodomain Pleurobrachia genes (Supplementary_Data_SD5.2 and Table_17S); 76 genes reported in Mnemiopsis18, whereas the Amphimedon homeodomain complement consists of only 32 genes. In contrast, some developmental pathways are either absent (Hedgehog, JAK/STAT) or have reduced representation in ctenophores (TGF-β, Wnt, Notch). Surprisingly, most Wnts are weakly expressed during Pleurobrachia development, while the ctenophore-specific subtype WntX is primarily restricted to adult neuroid elements such as polar fields, aboral organ and tentacular conductive tracts (Extended_Data_Fig. 5e) suggesting a distinct molecular makeup neural systems.
Parallel Evolution of Neural Organization
Extensive parallel evolution of neural organization in ctenophores is the most evident. Compared to other animals with nervous systems, many genes controlling neuronal fate and patterning (e.g. Neurogenins/NeuroD/Achaete-scute/REST/HOX/otx) are absent in the ctenophores we sampled. Orthologs of pre-and postsynaptic genes also have limited representation (Supplementary_Table_34S), and they lack components (e.g. Neuroligin) critical for synaptic function in other eumetazoans.
Importantly, our combined molecular, ultra-sensitive metabolomic, immunohistochemical and pharmacological data strongly suggest ctenophores do not use serotonin, acetylcholine, dopamine, noradrenaline, adrenaline, octopamine, histamine or glycine as intercellular messengers (Extended_Data_Fig. 6,7g, Supplementary_Data_SD5.8, Tables_22–26S). Lack of ionotropic receptors for these molecules in ctenophores is consistent with this conclusion (Supplementary_Table_26aS). Most synthetic genes for neurotransmitter pathways are absent in non-metazoan opisthokonts Monosiga and Capsaspora suggesting they are cnidarian/bilaterian innovations.
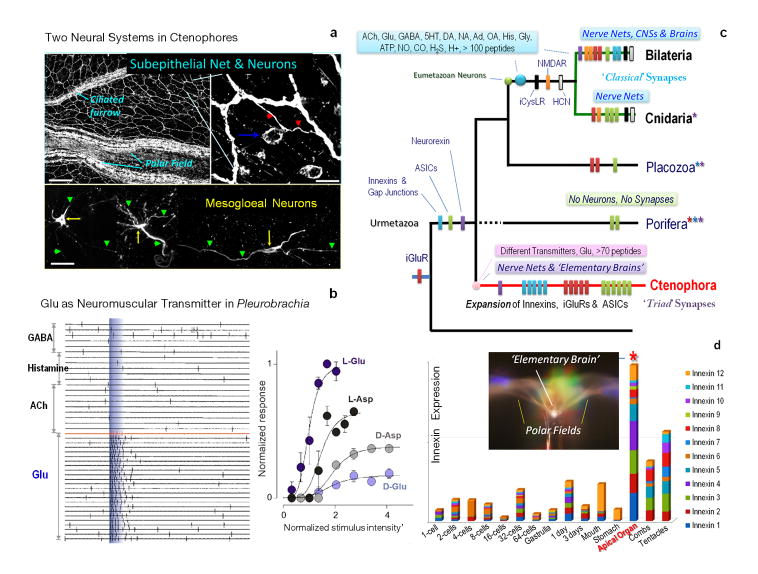
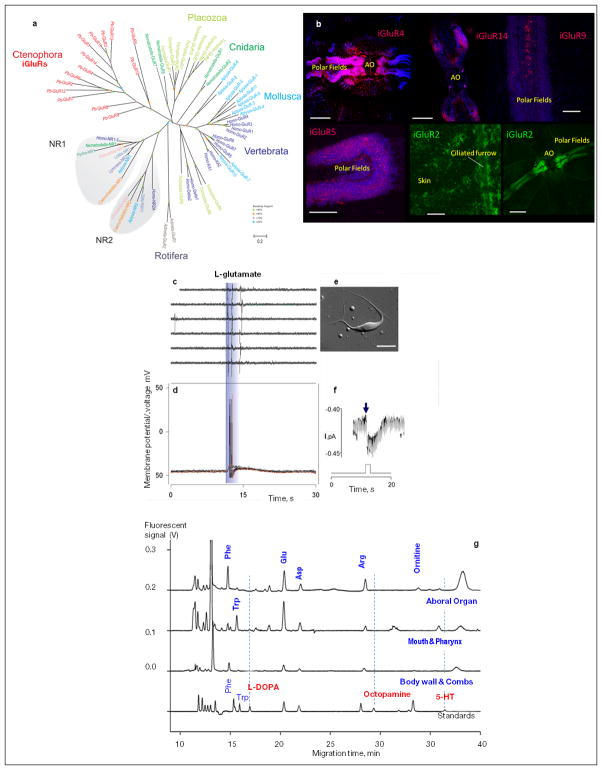
But, what are the ctenophore transmitters? Physiological and pharmacological tests suggest that L-glutamate is a candidate neuromuscular transmitter in Pleurobrachia (Fig. 5b, Extended_Data_Fig. 7), able to induce rapid inward currents and raise intracellular Ca2+ in muscle cells causing muscle contractions at nanomolar concentrations (10−7M). In contrast, all other classical neurotransmitters were ineffective even in concentrations up to 5×10⁻³M while D-glutamate as well as L-/D-aspartate have significantly less affinity in these assays (Fig. 5b).
Figure 5. Emergence of Neural Organization in Pleurobrachia.
a, Two neural nets in Pleurobrachia as revealed by tyrosinated α-tubulin immunostaining. Top image shows subepithelial net with concentrations of neuronal elements in the polar fields and ciliated furrows, known as structures involved in sensory and motor functions respectively (blue arrow in right insert indicates location of a neuronal somata with individual neurites marked by red arrows). The bottom image shows neurons of mesogloeal net (arrows are neuronal somatas; arrowheads are neuronal processes). Note, phalloidin (a muscle marker) did not stain these cells. Scale: 120μm (top); 10μm (bottom images). b, L- glutamate (10−7–10−3 M) induced action potentials in muscle cells whereas other transmitter candidates were ineffective even at concentrations up to 5mM. Typical responses of ctenophore muscle cells to local pulses of a transmitter application were recorded both as individual action potentials (whole-cell current-clamp mode) and video contractions from a single muscle cell. The graph shows normalized responses from the same muscle cell indicating L-glutamate is the most potential excitatory molecule compared to D-glutamate or L-/D-aspartate (Supplementary Methods). c, Key molecular innovations underlying neural organization in ctenophores. Bars indicate presence or relative expansions of selected gene families in all basal metazoan lineages from the inferred urmetazoan ancestor. The data suggests that sponges and placozoan never developed neural systems, or, assuming that pre-neuronal organization in the urmetazoan ancestor, sponges and placozoans lost their nervous systems. Either hypothesis point toward extensive parallel evolution of neural systems in ctenophores vs the Bilateria+Cnidaria clade. d, The aboral organ has the greatest diversity and highest expression levels of 12 gap junction proteins suggesting unmatched expansion of electrical signalling in this complex integrative organ - an analog of an elementary brain in ctenophores. Expression of different innexins shown as a summation of normalized frequencies of respective sequencing reads in RNA-seq data obtained from each developmental stage and adult tissues (Supplementary Methods).
The hypothesized role of glutamate as a signal molecules in ctenophores is supported by an unprecedented diversity of ionotropic glutamate receptors, iGluRs (Extended_Data_Fig. 7a, b, Supplementary_Table27S) – far exceeding the number of genes encoding iGluRs in other basal metazoans28. iGluRs might have undergone a substantial adaptive radiation in Ctenophora as evidenced by unique exon/intron organization for many subtypes and ctenophoran iGluRs form a distinct clade within the gene tree. Interestingly, during development, Pleurobrachia’s neurons are formed two days after the initial muscle formation, and first neurogenesis events correlate with co-expression of all iGlu receptors in hatching larvae (Fig. 4d). All cloned iGluRs also show remarkable cell-type specific distribution with predominant expression in tentacles, followed by combs and the aboral organ, revealing well-developed Glutamate-signalling in adults (Extended_Data_Fig. 7b). Additionally, Pleurobrachia contains more genes for glutamate synthesis (8 glutaminases) and transport (8 sialins) than any other metazoan investigated29,30. Although we detected Gamma-Aminobutyric acid (GABA, Supplementary_Tables 22–24S, and its localization in muscles), lack of pharmacological effects of GABA on Pleurobrachia behavior and major motor systems, such as cilia, muscle and colloblasts, suggest that GABA is a by-product of glutamate metabolism by L-glutamic acid decarboxylase.
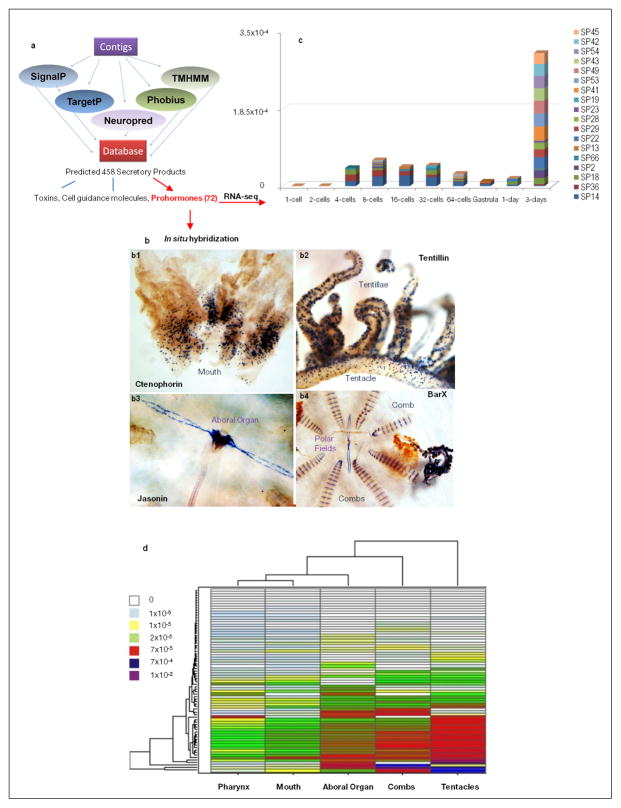
The first nervous systems are suggested to be primarily peptidergic in nature7. Although we did not find any previously identified neuropeptide homolog, secretory peptide prohormone processing genes (Supplementary_Table 31S) are present. We predicted 72 novel putative prohormones in Pleurobrachia and found >50 homologs in other sequenced ctenophores (Extended_Data_Fig. 8, Supplementary Tables_28S, 32S). Functions of these prohormone-derived peptides could include cell to cell signalling, toxins or involvement in innate immunity, or a combination. Several ctenophore-specific precursors are expressed in polarized cells around the mouth, tentacles and polar fields, suggesting a signalling role (Extended_Data Fig. 8b). They may be natural ligands for >100 orphan neuropeptide-like G-protein-coupled receptors31 identified in Pleurobrachia (Supplementary_Table_26b). A second example of neuropeptide receptor candidates is amiloride-sensitive sodium channels (ASIC), which are also known to be regulated by different classes of short peptides and protons32. Pleurobrachia’s genome has 29 genes encoding ASICs -more than any organism sequenced so far, and expression of most correlated with developmental appearance of neurons (Supplementary_Table_31S). ASIC expression is most abundant in tentacles, combs and aboral organs –structures enriched in neural elements and under complex synaptic control.
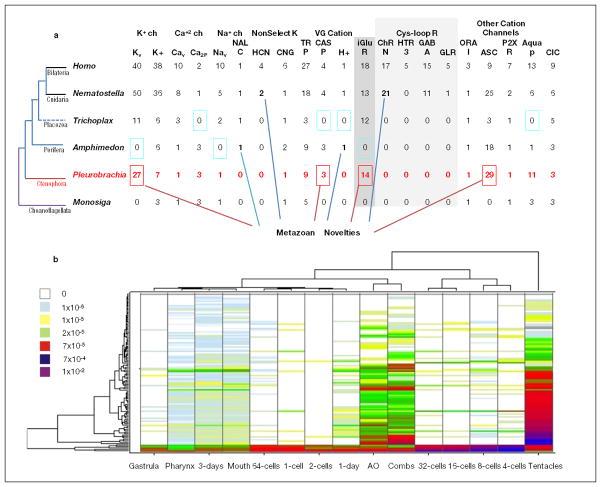
Moreover, ctenophores evolved an enormous diversity of electrical synapses (absent in Nematostella, Amphimedon and Trichoplax) with 12 gap junction proteins (pannexins/innexins33 but not chordate-specific connexins) found in Pleurobrachia. All pannexins/innexins have their highest expression in the aboral organ followed by tentacles and combs (Fig. 5d). The aboral organ, combs and tentacles have a relatively large diversity of ion channels (Extended_Data_Fig. 9b), confirming complex regulation of excitability in these structures. Non-metazoans lack pannexin orthologs suggesting that these are metazoan innovations with profound expansion of this family in ctenophores. However, the overall complement of voltage gated ion channels in ctenophores is reduced compared to other eumetazoans34 (Extended_Data_Fig. 9a).
Our genome-wide survey also indicates that some bilaterian and cnidarian pan-neural markers are present (e.g. 3 elav and musashi genes), but they are not expressed in neurons; a finding consistent with early divergence and extreme parallel evolution of neural systems in this lineage (Extended_Data_Figs.5, 9b).
Discussion
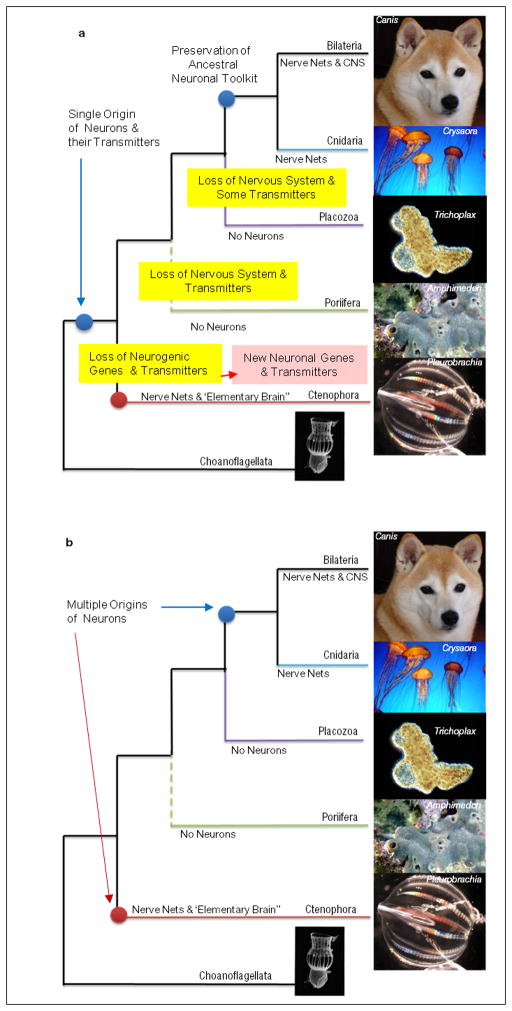
Figure 5c summarizes key molecular innovations underlying neural organization in ctenophores. Evidently, with an astonishing different molecular and genomic makeup, ctenophores have achieved complex phenotypic plasticity and tissue organization. Thus, ctenophores might represent remarkable examples of convergent evolution including the emergence of neuro-muscular organization from the metazoan common ancestor without differentiated nervous system or bona fide neurons (Extended_Data_Fig. 10b, Supplementary_Data_SD15). The alternative “single-origin-hypothesis”, where the common ancestor of all metazoans had a nervous system with complex molecular and transmitter organization including all classical cnidarian/bilaterian transmitters and neurogenic genes (Extended_Data_Fig. 10a), as a less parsimonious scenario. This hypothesis implies that ctenophores, despite being active predators, underwent massive loss of neuronal and signalling toolkits and then replaced them with novel neurogenic and signalling molecules and receptors.
These findings might have implementations for regenerative and synthetic biology in designing novel signaling pathways and systems. In this case, ctenophores (‘aliens of the sea’) and their genomes present matchless examples of “experiments” in nature and the possible preservation of ancient molecular toolkits lost in other animal lineages.
ONLINE METHODS
Source material
Animals (Pleurobrachia bachei, Euplokamis dunlapae, Dryodora glandiformis, Beroe abyssicola, Bolinopsis infundibulum and Mertensiidae sp) were collected at Friday Harbor Laboratories (Pacific North-Western Coast of USA) and maintained in running seawater for up to two weeks. Other species were collected at the Atlantic coast of Florida and around of Woods Hole, Massachusetts (Pleurobrachia pileus, Pleurobrachia sp., Mnemiopsis leidyi) as well as central Pacific (Palau, Hawaii, Coeloplana astericola, Vallicula multiformis). Animals were anesthetized in 60% (volume/body weight) isotonic MgCl2 (337mM). Specific tissues were surgically removed with sterile fine forceps and scissors and processed for DNA/RNA isolations as well as metabolomics or pharmacological/electrophysiological tests. Whole animals were used for all in situ hybridization and immunohistochemical tests as described35. Genomic DNA (gDNA) was isolated using Genomic-tip (QIAGEN, CA) and total RNA was extracted using RNAqueous-Micro (Ambion/Life Technology, TX) or RNAqueous according to manufacturers’ recommendations. Quality and quantity of gDNA was analyzed on a Qubit2.0 Fluorometer (Life Technologies) and for RNA we used a 2100 Bioanalyzer™ (Agilent Technologies, CA). For all details see Supplementary Methods sections S1.1–1.3.
Genome sequencing
All genomic sequence data for de novo assembly were generated on Roche 454 Titanium and Illumina Genome Analyzer IIx, HiSeq2000 and MiSeq instruments using both shotgun pair-end and mate-pair sequencing libraries with 3–9 kb inserts as summarized in Supplementary Tables S1–2. Shotgun sequencing was performed from a single individual. Due to a limited amount of starting gDNA, mate pair libraries were constructed from 10–12 individuals. In total, the genome sequencing is composed of 106, 568, 866, 588 bp or ~106.5 Gb of data, which corresponds to 590-665x physical coverage of the Pleurobrachia genome (the size of the P. bachei genome is estimated to be ~160–180 Mb); see Supplementary Methods sections S1.4–2.1.2.
Genome assemblies
The Pleurobrachia bachei draft genome was assembled using a custom approach designed to leverage the individual strengths of three popular de novo assembly packages and strategies: Velvet36, SOAPdenovo37, and pseudo-454 hybrid assembly with ABySS38. First, using filtered and corrected data, we performed individual assemblies from 454 and Illumina reads by the Newbler (Roche, Inc.) software. Then the merged/hybrid assembly was achieved using three individual assemblies (SOAPdenovo, Velvet, and ABySS/Newbler as described in the Supplementary Methods S2.2). Three gene model predictions were performed by Augustus39 and Fgenesh predictions with the Softberry Inc. Fgenesh++ pipeline40,41 to incorporate information from full-length cDNA alignments and similar proteins from the eukaryotic section of the NCBI NR database42. After initial gene predictions in each of the three sets of genomic scaffolds, we screened each set of gene models for internal redundancy with the BLASTP program from NCBI’s BLAST+ software suite43. A model was considered redundant if it: had 90% identity to other model; the alignment between the two models had a bit score of at least 100 and the model was shorter than the other model.
Scaffolds producing these gene models were pooled and then screened for prokaryotic contamination using UCSC’s BLAT software package44 to produce the draft genome assembly version 1.0 (statistics can be found in Supplemental Table 5S and Supplementary Methods S.2).
Genome annotation
For annotation, gene models were uploaded to the In-VIGO BLAST interface, a blastp alignment of gene models was performed against the entirety of NCBI’s non-redundant protein database and the Swiss-Prot protein database, and subsequently annotated in terms of Gene Ontology and KEGG pathways as well as Pfam domain identification. Transposable elements (TEs) were identified using not only WU-BLAST and its implementation in CENSOR but also databases for all known classes, superfamilies and clades of TEs described in the literature and/or collected in Repbase45. Detected sequences have been clustered based on their pairwise identities by using BLASTclust. All autonomous non-LTR retrotransposons have been classified based on RTclass146. To merge partially predicted, non-redundant gene models with assembled transcriptome data, a custom Java tool was developed. This Java tool extended partial gene model predictions based on using transcriptome sequences to bridge 5′ and 3′ fragments of partially predicted genes. Using this Java tool, analysis of alignments of non-redundant gene models to assembled Pleurobrachia transcriptomes resulted to 19,523 (Supplementary Table 26S) gene models. These gene models were employed to also identify their possible homologs in assembled transcriptomes from 10 other ctenophore species sequenced (Supplementary Tables 10S and 11S). All genomic sequences were submitted to NCBI on SRA accession number Project: SRP001155 (Supplementary Methods S.3.1–3.2.)
Transcriptome sequencing and annotation
Three sequencing technology platforms were used for transcriptome profiling (RNA-seq): Roche 454 Titanium, Illumina HiSeq2000 and Ion Proton/PGM (Ion Torrent, Life Technologies). RNA-seq was performed from all major embryonic and developmental stages (1-cell, 2-cells, 4-cells, 8-cells, 16-cells, 32-cells, 64-cells, early and later gastrula, 1-day, and 3-days larvae), major adult tissues and organs (combs, mouth, tentacles, stomach, the aboral organ, body walls), and whole body of Pleurobrachia bachei. We developed a reduced representation sequencing protocol for the 454 and Ion Torrent sequencing platforms that can detect low abundance transcripts47. The method reduces the amount of sequencing and gives more accurate quantification and additional details of the procedure are reported elsewhere47,48. In summary, we have generated 499,699,347 Reads or ~47.9 Gbp to achieve approximately 2,000x coverage of the Pleurobrachia transcriptome.
In addition, Illumina HiSeq sequencing was also performed with RNA extracted from the following ctenophore species: Euplokamis dunlapae, Coeloplana astericola, Vallicula multiformis, Pleurobrachia pileus, Pleurobrachia sp. (collected from the Middle Atlantic and later identified as a subspecies of P. pileus), Dryodora glandiformis, Beroe abyssicola, Mnemiopsis leidyi, Bolinopsis infundibulum, and an undescribed species which belongs to the family Mertensiidae; Supplementary Table 3S). Each sequencing project was individually assembled using the Trinity de novo assembly package49 and in selected cases using MIRA. Reads from developmental stages were also assembled using the CLCBio Genomics Workbench. Prior to each assembly, reads were quality trimmed and had adapter contamination removed with cutadapt50. Full summaries of the transcriptome assemblies are presented in Supplementary Table 4S and 10S. Each transcriptome was mapped to the Pleurobrachia genome, and aligned to both NCBI’s non-redundant protein database (NR) and the UniProtKB/Swiss-Prot (SP) protein database. Gene Ontology51 and Kyoto Encyclopedia of Genes and Genomes52,53 (KEGG) terms were associated with each transcript. By first translating transcripts in all six reading frames, Pfam/SMART domains54 were assigned to each reference transcriptome.
Each reference transcriptome and its full set of annotation and expression data was uploaded to our transcriptome database http://moroz.hpc.ufl.edu/slimebase2/browse.php for downstream analysis and visualization55,56. The database is integrated with UCSC type genome browser. Via the genome project homepage http://moroz.hpc.ufl.edu/ all datasets have direct download options. Quantification of gene expression profiling was performed on all transcriptional data as described in supplementary methods S4.4). Hierarchical clustering was performed by Spotfire agglomerative algorithm. All primary transcriptome data was submitted to NCBI on SRA accession number Project: SRP000992. (Details see Supplementary Methods S4.1–4.2.3).
Phylogenetic analyses
To reconstruct basal metazoan phylogeny (see controversies in10–15,57), we conducted two sets of phylogenomic analyses using tools described elsewhere58. All analyses included new data from Pleurobrachia bachei and the sponges Sycon (Calcarea) and Aphrocallistes (Hexactinellida). For the first set of analyses, Ctenophora was represented by two species of Pleurobrachia and Mnemiopsis leidyi. Initial analyses included the taxa in Supplementary Table 12S. For a subsequent analysis, sampling within Ctenophora was expanded to include ten additional taxa, each represented by a relatively deeply sequenced Illumina transcriptome (Supplementary Table 13S). In order to reduce noise in the phylogenetic signal, we employed strict criteria to exclude paralogs, highly derived sequences, mistranslated sequence regions, and ambiguously aligned positions in sequence alignments. Analyses were conducted in RAxML 7.2.759,88 using maximum likelihood (ML) with the CAT +WAG + F model. Topological robustness (i.e., nodal support) for all ML analyses was assessed with 100 replicates of nonparametric bootstrapping. Details of phylogenomic analyses are presented in Supplementary Methods S7. SH-test89 as implemented in RAxML with the PROTGAMMAWAGF model17.
In order to examine evolution of single genes or gene families, alignments were performed with either ClustalX2 60–62 or Muscle63 then, if appropriate, either trimmed manually or trimmed using GBlocks64 to exclude ambiguously aligned positions. Once alignments were obtained, gene trees were reconstructed in MEGA 565 using ML with the Whelan and Goldman (WAG) model. The bootstrap consensus tree was inferred from 100 replicates. All positions containing gaps and missing data were eliminated. Pfam composition54, Gene Ontology51, and KEGG52,53 were used to further validate P. bachei orthologs. Analyses of gene gain and gene loss were performed using custom scripts as described elsewhere66 and in Supplementary Methods S7.
Analysis of DNA methylation
ELIZA based colorimetric assays (Epigenteck, NY) were performed to quantify both global 5-mC and 5-hmC methylation in the P. bachei genome. A total of 6 individual P. bachei and three Rat (positive control) were used (Supplementary Methods S1.2). Three biological and technical replicates were performed for every sample. Absolute quantification of 5-mC and 2hmC were determined and date is reported as an mean ± S.E.M (Supplementary Methods S8).
Molecular cloning, in situ hybridization and immunohistochemistry
Methods were similar as reported elsewhere35,47,48,67 with some modifications (Supplementary Methods S9–S11).
Scanning electron microscopy
Animals were fixed in 2.5% glutaraldehyde in 0.2 M phosphate-buffered saline (pH=7.6) for 3–4 hours at room temperature, and washed. For secondary fixation, we used 2% osmium tetroxide in 1.25% Sodium Bicarbonate for 2–3 hours at room temperature. After dehydration in ethanol samples were was placed for drying in Samdri-790 Critical Point Drying. After drying the samples were coated on Sputter Coater. SEM observations and recordings were done on NeuScope JCM-5000 microscope (Supplementary Methods S12).
Electrophysiological methods, calcium imaging and pharmacological assays
Patch electrodes for extracellular and whole-cell recordings were pulled from borosilicate capillary (P-87, Sutter Instruments). All currents were recorded using an Axopatch or 200B amplifier controlled by a Digidata 1322A and pClamp 9.2. Action potentials (APs, spikes) were recorded in track mode using cell-attached loose-patch configuration. Whole-cell currents were recorded in voltage clamp mode at a holding potential of −70 mV. Neurotransmitter candidate (see Supplementary Method S15) application for both extracellular AP and whole cell recordings were performed with a rapid solution changer, RSC-160 (Bio-Logic-Science Instruments, France). Data were analyzed with Clampfit 9.0 (Molecular Devices) in combination with SigmaPlot 10.0. Videomicroscopy and time-lapse series were acquired with QImaging EXi CCD camera using DIC mode of Nikon Eclipse 2000 inverted microscope. Calcium imaging was performed on isolated ctenophore muscle cells using Olympus IX-71inverted microscope equipped with a cooled CCD camera (ORCA R2, Hamamatsu). Cells were injected with calcium sensitive probe (Fluo-4, ~5μM) through patch pipette. Fluorescence imaging was performed under the control of Imaging Workbench 6 software. Stored time series image stacks were analyzed off-line using Imaging Workbench 6, Clampfit 10.3, SigmaPlot 10/11 or exported as TIFF files into ImageJ 1.42. Pharmacological tests and behavioral assays with video recording were performed on intact animals in 5–40 L aquaria or on semi-intact preparations in a Sylgard-coated Petri dish with free cilia beating and muscle contractions. To monitor and quantify cilia movements we used glass microelectrodes filled with 2M potassium acetate with resistances of 5–20 MΩ with electrical signals recorded by A-M System amplifiers (Neuroprobe 1600) and Gould Recorder (WindoGraf 980).
Determination of the presence of classical neurotransmitters by capillary electrophoresis (CE)
Two CE separation techniques were employed to analyze tissue extracts for the presence of a number of neurotransmitters (Supplementary Table 18S). While both methods used CE separations, complimentary detection methods, laser-induced native fluorescence (LINF)68 and electrospray ionization mass spectrometry (ESI-MS)69,70, were used to ensure broad coverage and low detection limits for the specific analytes of interest. Whole body of small animals as well as individual organs and tissues were removed, rinsed with ultrapure water and analytes were extracted using 49.5/49.5/1, methanol (LC-MS grade)/water/glacial acetic acid (99%) by volume, homogenized, centrifuged and supernatant was removed and frozen at −80°C until analysis. The CE-LINF instrument employed ultraviolet excitation at 264 nm and the native fluorescence emission collected and recorded using a UV-enhanced CCD array (Spec-10; 2KBUV/LN; Princeton Instruments; Trenton, NJ, USA). CE separations were performed by hydrodynamic injection of 10 nL of sample and using 25 mM citric acid (pH 2.5, applied voltage +30 kV) or 50 mM borate (pH 9.5, applied voltage +21 kV). Analytes were identified based on comparison of both the migration time and fluorescence spectrum to that of standard mixtures of analytes. CE-ESI-MS analysis was performed using a Bruker Microtof or a Maxis (Bruker Daltonics; MA) mass spectrometer for detection. All separations were performed using 1% formic acid in water as the electrolyte and applied voltage of +30 kV. Sheath liquid was 0.1% formic acid in 50/50 methanol/water. Samples were hydrodynamically injected for a total volume of ~ 6 nL. Mass spectra were collected and recorded at a rate of 2 Hz with calibration was performed using sodium formate clusters. Analytes were identified based on comparison of both the CE migration time and mass match to that of standard mixtures of analytes.
Extended Data
Extended Data Figure 1.
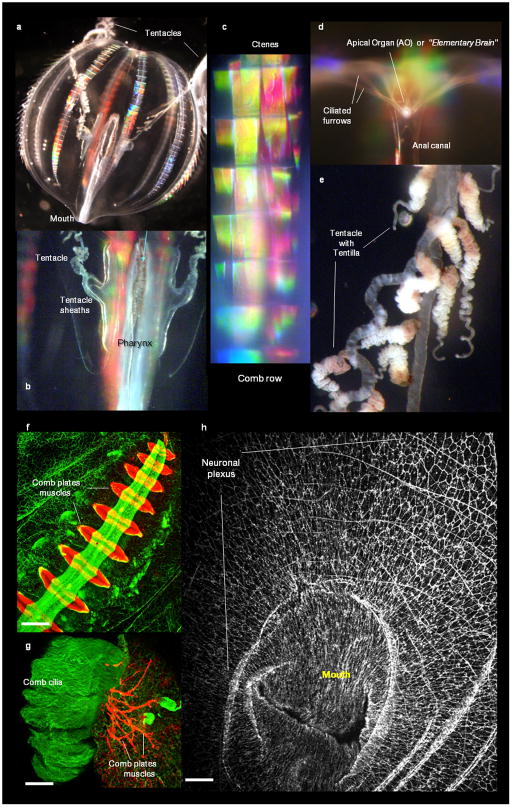
a–e, Anatomy of the ctenophore, Pleurobrachia bachei A. Agassiz, 1860. Natural coloration of the major organs in live animal are shown. a, Details of the transparent Pleurobrachia body are shown including, b, the pharynx and tentacle sheaths (pockets). Eight rows of comb plates, called ctenes, are made of giant compound cilia that diffract light – creating iridescence. c, Combs rows in Pleurobrachia are constantly beating. The mouth and the aboral organ (AO) are located at the opposite poles of the animal (a, c). The AO controls complex coordinated behaviors of the animal; d, Ciliated furrows connect the AO and the ctenes to mediate behavior. e, Tentacles have numerous contractile tentillae used to capture food with specialized glue cells or colloblasts (See also Fig. 1e of the main text).
f–h, Pleurobrachia neural nets and muscles. f, Comb plate muscles (red) were revealed using in situ hybridization for β-tubulin and subepithelial neural net (green) revealed by tyrosinated α-tubulin immunostaining. g, In this image comb cilia (green) were stained using tyrosinated α-tubulin antibodies (green) where as underlying comb plate muscles were visualized by phalloidin (a muscle marker) that did not stain neurons. h, Organization of the subepithelial neural net around the Mouth as revealed by tyrosinated α-tubulin antibodies (whole mount preparation). Scale: 120 μm (f); 100 μm (g); 200 μm (h). See Supplementary Methods SM10 and SM11.
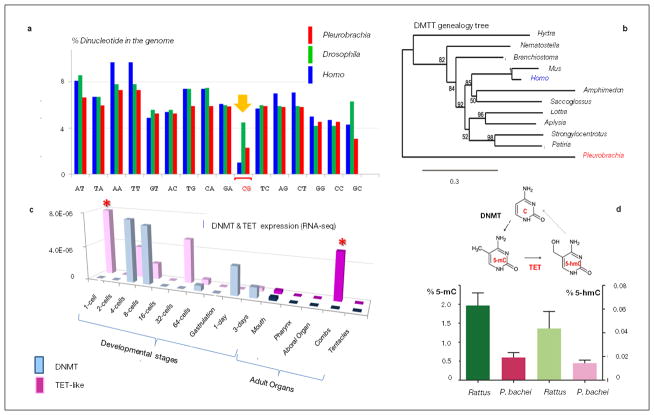
Extended Data Figure 2. DNA methylation and active DNA demethylation in Pleurobrachia bachei.
CpG DNA methylation facilitates the elimination of CpG dinucleotides over evolutionary time66 a, Histogram shows relative occurrences of different dinucleotides in genomes of P. bachei (red bars), Drosophila melanogaster (green bars, no DNA methylation) and Homo sapiens (blue bars). The P. bachei genome contains 2.3 % CpG dinucleotides, which is much lower than the expected random frequency and, therefore, indicative of a genome that undergoes methylation compared to humans66. b, DNMT genealogy tree. The enzyme DNA methyltransferase (DNMT), which catalyzes transfer of a methyl group to DNA to form 5- methyl cytosine (5-mC)147, is present in Pleurobrachia. c, TET family of enzymes catalyzes active DNA demethylation via formation of 5-hydroxymethyl cytosine (5-hmC, the 6th DNA base). RNA-seq profiling reveals differential expression for DNMT and TET-like genes during development and in adult P. bachei. Both DNMT and TET-like genes are predominantly expressed during cleavage starting from the 1st division. However, the TET-like gene is also highly expressed in adult combs (asterisk). Y-axis shows a normalized expression level for each transcript. d, ELIZA based colorimetric assays validate the presence of both 5-mC and 5-hmC in the P. bachei genome (the rat brain is used as a positive control; n=6 for Pleurobrachia and n=3 for rat; data shown as mean ± s.e.m, see the Supplementary Methods SM8 and Supplementary Data section SD3 for details).
Extended Data Figure 3.
a, Phylogeny of Metazoa based on 586 genes. Topology inferred using RAxML 7.2.7 and maximum likelihood (ML) with the CAT +WAG + F model with all taxa from the Supplementary Table 12S. Bootstrap support values are listed at each node. Color coding: purple –Ctenophora yellow – Porifera, pink – Cnidaria, light blue – Bilateria. b, Removal of fast-evolving taxa Trichoplax and Caenorhabditis improves topological robustness. Topology inferred using RAxML 7.2.7 and maximum likelihood (ML) with the CAT +WAG + F model with all taxa from Supplementary Table 12S except Trichoplax and Caenorhabditis. Bootstrap support values are listed at each node. c, Removal of distant out-groups such as Fungi and Filasterea further improves topological robustness. Topology inferred using RAxML 7.2.7 using maximum likelihood (ML) with the CAT +WAG + F model with all taxa from Supplementary Table 12S except Trichoplax, Caenorhabditis, and non-choanoflagellate outgroups. Bootstrap support values are listed at each node. d, Analysis with improved ctenophore taxon sampling based on 114 genes. Topology inferred using RAxML 7.2.7 using maximum likelihood (ML) with the CAT +WAG + F model with all taxa from Supplementary Table 13S. Bootstrap support values are listed at each node.
Extended Data Figure 4.
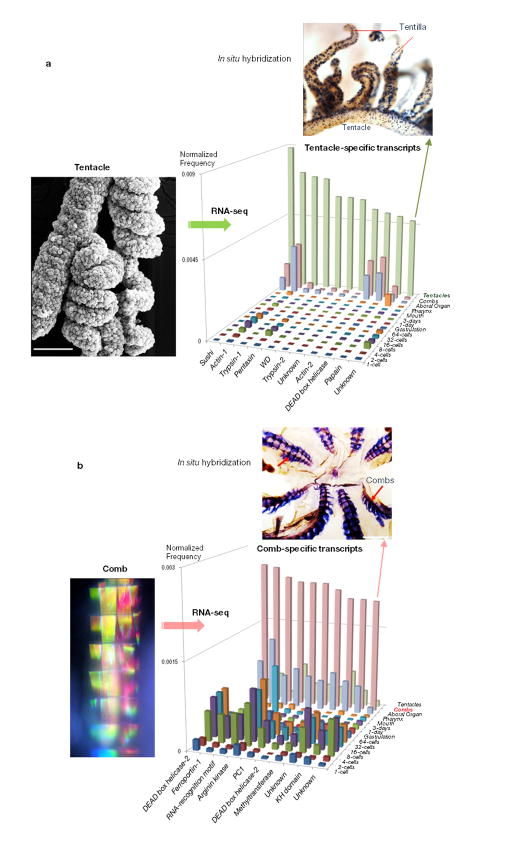
a, Identification of tentacle-specific transcripts. The left photo shows scanning electron micrograph of a Pleurobrachia tentacle with two branching tentillae densely covered with hundreds of colloblasts or glue cells. Comparative transcriptome (RNA-seq) profiling among major organs allowed us to identify several dozen genes differentially or uniquely expressed in tentacles. The histogram shows illustrative examples of some of these genes with a normalized expression level (Y-axis) for each represented transcript. One of these Pleurobrachia-specific genes we named Tentillin (green arrow). In situ hybridization experiments (n=9) revealed a remarkable cell-specificity expression patterns for Tentillin in all main tentacle branches and tentillae, possible labeling colloblasts or associated secretory cells. b, Identification of comb-specific transcripts. The left photo shows a microscopic image of one comb row from an intact animal. The natural coloration is a reflection of the beautiful iridescence patterns produced from large cilia forming combs. Comparative transcriptome (RNA-seq) profiling among major organs allowed us to identify several hundreds of genes differentially or uniquely expressed in combs. The histogram shows illustrative examples of some of these genes with a normalized expression level (Y-axis) for each represented transcript (see Supplementary Methods S4.2.3.6, S4.2.3.7 and SM10, all sequences used in the analysis can be found in Supplementary Tables 29S, 30S and 32S).
Extended Data Figure 5.
a, b, Dicer and Argonaut, are predominatly expressed in structures associated to sensory and integrative functions. These include the aboral organ, polar fields and combs. Note, a relatively weak staining of other cell types in the skin and following ciliated furrows in Dicer and Argonaut preparations (top two images). c, d, Pleurobrachia ELAV is Expressed in Combs and not in neurons. ELAVs are RNA binding proteins and they are considered as pan-neuronal markers (see Supplementary Data SD5.6.1). However, in Pleurobrachia ELAVs’ expression has not been detected in neural tissues or cells with recognizable neuronal like appearances. In situ hybridization for Pleurobrachia ELAV3 (c–d) shows the highest levels of expression in the adult comb plate but not in any of the neural tissues or organs enriched with neurons such as the aboral organ and polar fields. e, WntX is selectively expressed in the aboral organ (AO) and major conductive pathways of Pleurobrachia suggesting its involvements in integrative and neural-like functions (in situ hybridization on a whole-mount preparation). A. One of the highest WntX expressions is found in AO and ciliated furrows whereas the polar fields showed a moderate expression level associated to their central regions. In situ hybridization was performed on whole mounts using DIG labeled probes (see details in the Supplementary Methods, all in situ hybridization were performed at least on 4–5 different animals and these are representative photos for these experiments). Scales: 500 μm (a–d). 800 μm (e).
Extended Data Figure 6.
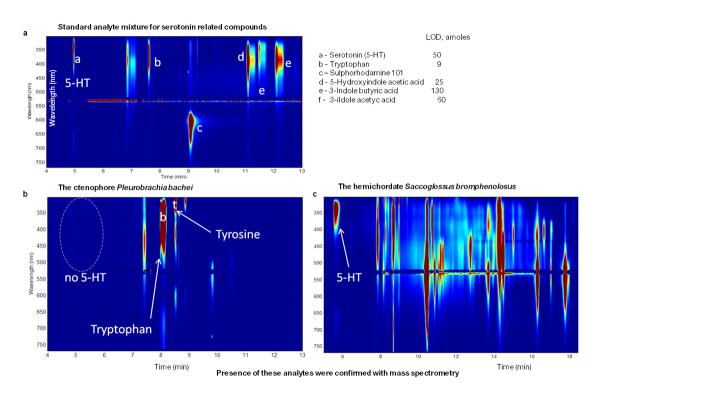
a–c, Absence of Serotonin in ctenophores. Here, we used nanoliter volume sampling, capillary electrophoresis separation, and wavelength-resolved native fluorescence detection as described for ultra-sensitive assay of 5-hydroxytryptamine (serotonin or 5-HT) and related metabolites (a, the top electropherogram and the table with standards used). Limits of detection (LODs) range from the low attomole to the femtomole range, with 5-HT LODs being approximately 20–50 attomoles. b, Using this assay we failed to detect 5-HT in Pleurobrachia (bottom left, n=6) but c, 5-HT was reliable detected in the hemichordate Saccoglossus (bottom right) and molluscs62. See details in the Supplementary Methods SM17 and Supplementary Table 22S for quantification.
Extended Data Figure 7.
a, The Ionotropic glutamate receptors (iGluRs) are diverse and underwent substantial adaptive radiation within the Ctenophora lineage. Phylogenetic analysis shows Pleurobrachia iGluRs share highest identity to each other forming a distinct branch on the tree topology (Supplementary Data SD5.9). b, Differential expressed of iGluR subtypes in Pleurobrachia bachei (red and green labeling with fluorescent in situ hybridization protocols). Dark blue fluorescence is DAPI nuclear staining. Aboral organ –AO. Scale 100 μm (b1-2), 60 μm (b3), 50 μm (b4), 30 μm (b5), 200 μm (b6). c–f, Glutamate induced action potentials and currents in muscle cells. c, Typical responses of ctenophore muscle cells to glutamate pulses recorded extracellulary (as individual action potentials/contractions from a single muscle cell in response to local application of Glutamate, 1mM), and d, from the same cell in whole-cell current clamp mode with clear action potentials. e, Isolated muscle cell. Scale 25μm. f, Glutamate activated whole-cell currents recorded from the same cell (as in c). Time course of application is depicted by the diagram below the voltage signal. Two responses (inward current) are shown. The holding potential was −70mV (Supplementary Methods SM13-16). g, Representative electropherograms show capillary electrophoresis separation with laser induced fluorescence detection from different organs in Pleurobrachia bachei (n=5) for transmitter candidate identification. The bottom electropherograms are standards (Supplementary Methods SM17 and Supplementary Tables 23–25S for quantification).
Extended Data Figure 8.
a, Computational pipeline for prediction of secretory products in Pleurobrachia and the overview of secretory products predicted from the Pleurobrachia gene models (Supplementary Method and Data sections SM4.2.3.7 and SD5.11, respectively). b, Expression of novel secretory molecules in Ctenophores (DIG-labeled in situ hybridization, Supplementary Data SD5.11 and Methods SM 10). Each of predicted secretory prohormone was selected based upon its unique and/or highly differential expression pattern as revealed by RNA-seq profiling. Ctenophorin is uniquely expressed in polarized cells around the mouth of Pleurobrachia and we found its homologs in all ctenophore species we sequenced- here is its name. Tentillin is a Plerobrachia-specific gene, which is uniquely expressed in polarized secretory-like cells in tentillae and tentacles. Jansonin’s expression is primarily restricted to polarized cells located in the aboral organ and polar fields. b4, For comparison, we showed different but also cell-specific expression pattern of BarX Transcription Factor in cells of unknown identify localized in polar fields, comb plates and tentacles. c–d, Majority of predicted secretory products are expressed later in development and in adult organs of Pleurobrachia (RNA-seq). c, Expression patterns of 72 predicted prohormones in P. bachei indicates that 20 of them are present and differentially expressed in development (Supplementary Table 32S for all Pleurobrachia precursor sequences). Surprisingly 5 of these precursor mRNAs were found starting from the 2nd cleavage stage whereas the rest are predominantly expressed on day 3 of development. This correlates to the first appearance of neurons in Pleurobrachia cydippid larva (see Supplementary Data SD5.11 and Supplementary Method section S4.2.3.6 for the RNA-seq analysis).
Extended Data Figure 9.
a, Metazoan Ion Channel Complement. The 112 ion channels identified in the Pleurobrachia genome are classified as voltage gated (v) or other gating such as second messengers. Receptors channels (R) are ligand-gated or ionotropic (iGluR, ChRN, HTR3, GABA and CLR) and indicated in the grey. Metazoan novelties indicate type of ion channels absent in the choanoflagellates, the sister group to all animals. Colored squares show channels: (i) primarily absent in Ctenophores (pink), (ii) secondarily lost in sponges or placozoans (dark yellow), (iii) eumetazoan (Cnidaria+Bilareria) innovations (blue), or (iv) examples of expansion of certain class of channels in some animal lineages (red). All Pleurobrachia sequences used in the analysis can be found in Supplementary Table 31S. b, Ion Channels are Predominantly Expressed in Tentacles, Combs and Aboral Organ. Hierarchical Clustering of 112 identified ion channels in developmental stages and adult tissues of Pleurobrachia. Adult organs involved in food capture and ciliated locomotion and integrative functions show significantly higher diversity and overall higher level of expression levels for most of ion channel types. Mobile tentacles had the highest expression of voltage gated channels, in particular Cav and Nav. The legend shows relative expression levels based on RNA-seq data (see Supplementary Methods S4.2.3.6).
Extended Data Figure 10. Two alternative scenario of neuronal evolution.
a, Single origin of the neural system (Monophyly) with possible loss of some neural molecular components in Ctenophores as well as the possible secondarily loss of the entire nervous systems in sponges and placozoans;
b, Multiple origins of neurons in animals as introduced and supported by this manuscript (see main text discussion section for details).
Supplementary Material
Acknowledgments
FHL for facilities during animal collection and Marine Genomics apprenticeships (L.L.M., B.J.S.); E. Dabe, G. Winters, J. Netherton, Caleb Bostwick for help with animal/tissue/RNA/DNA assays; Drs X-X Tan/F. Lu (SeqWright, Inc) and T. Tyazelova for sequencing. F. Nivens for videos. Supported by NSF (NSF-0744649/ NSF CNS-0821622 to L.L.M., NSF CHE-1111705 to J.V.S.), NIH (1R01GM097502,/R01MH097062, R21RR025699/ 5R21DA030118 to L.L.M., P30 DA018310 to J.V.S., R01 AG029360 to E.I.R.), NASA NNX13AJ31G (to K.M.H./L.L.M,/ K.M.K.), NSERC458115/211598 (/J.P.R.), University of Florida Opportunity Funds/McKnight Brain Research and Florida Biodiversity Institute (L.L.M.), Rostock Inc/A.V. Chikunov (E.I. R.); Grant from RF Government No 14.B25.31.0033 and NIH R01 AG029360 (E.I.R.). F.A.K./I.S.P/ R.D. were supported by HHMI (55007424), EMBO and MINECO (BFU2012-31329 and Sev-2012-0208). Contributions of AU Marine Biology Program_#117 and Molette Lab_#22.
Footnotes
Supplementary information is available in the online version of the paper.
Author Contribution: L.L.M. conceived the project, designed the experiments and wrote the manuscript. A.B.K., A.P.G., D.R., E.K., T.T., R.S.,T.P.M., E.I.R. and L.L.M. prepared gDNA, RNA samples and performed sequencing; I.S.P, F.A.K., V.V.S., F.Y., M.R.C., A.B.K., L.L.M. did assemblies, gene model prediction and annotations; K.M.K., K.M.H. performed phylogenomic analysis; A.P., A.B.K. and L.L.M. worked on gene family gain/loss analysis; F.A.K. and R.D. characterized protein divergence; S.D., C.D., J.V.S. and L.L.M. performed capillary electrophoresis/ microchemical metabolomic assays; A.P.G., A.B.K., E.B., E.I.R. did small RNA sequencing and analysis; K.B. and J.R. characterized immune gene complement; V.K. and J.J. characterized transposons, T.P.N and L.L.M. performed immunolabeling, electron microscopy and pharmacological assays; Y.B. and L.L.M. performed pharmacological, electrophysiological and imaging assays on muscles; D.O.G., M.R.C., A.B.K. and L.L.M. performed secretory peptide prediction; A.B.K. and L.L.M. analyzed RNA-seq data; A.B.K. performed methylation analysis; B.J.S., A.B.K. and L.L.M. analyzed developmental data; J.J.S., D.O.G., R.B., A.F., A.B.K. and L.L.M. performed in situ hybridization experiments; C.E.M. identified species and wrote their description and biology; all authors contributed to preparation the manuscript and the text.
References
- 1.Nielsen C. Animal Evolution: Interrelationships of the living phyla. Oxford University Press; 2012. p. 402. [Google Scholar]
- 2.Hernandez-Nicaise M-L. In: Microscopic Anatomy of Invertebrates: Placozoa, Porifera, Cnidaria, and Ctenophora. Harrison FW, Westfall JA, editors. Vol. 2. Wiley; 1991. pp. 359–418. [Google Scholar]
- 3.Tamm SL. Electrical conduction and behavior in “simple” invertebrates. Clarendon Press; 1982. pp. 266–358. [Google Scholar]
- 4.Tang F, Bengtson S, Wang Y, Wang XL, Yin CY. Eoandromeda and the origin of Ctenophora. Evol Dev. 2011;13:408–414. doi: 10.1111/j.1525-142X.2011.00499.x. [DOI] [PubMed] [Google Scholar]
- 5.Dzik J. Possible ctenophoran affinities of the Precambrian “sea-pen” Rangea. J Morphol. 2002;252:315–334. doi: 10.1002/jmor.1108. [pii] [DOI] [PubMed] [Google Scholar]
- 6.Pastor WA, Aravind L, Rao A. TETonic shift: biological roles of TET proteins in DNA demethylation and transcription. Nat Rev Mol Cell Biol. 2013;14:341–356. doi: 10.1038/nrm3589. nrm3589 [pii] [DOI] [PMC free article] [PubMed] [Google Scholar]
- 7.Moroz LL. On the independent origins of complex brains and neurons. Brain, behavior and evolution. 2009;74:177–190. doi: 10.1159/000258665. [DOI] [PMC free article] [PubMed] [Google Scholar]
- 8.Moroz LL. Phylogenomics meets neuroscience: how many times might complex brains have evolved? Acta Biol Hung. 2012;63(Suppl 2):3–19. doi: 10.1556/ABiol.63.2012.Suppl.2.1. 1362L96286258350 [pii] [DOI] [PMC free article] [PubMed] [Google Scholar]
- 9.Pennisi E. Nervous system may have evolved twice. Science. 2013:339, 391. doi: 10.1126/science.339.6118.391-a. 339/6118/391-a [pii] [DOI] [PubMed] [Google Scholar]
- 10.Nosenko T, et al. Deep metazoan phylogeny: When different genes tell different stories. Mol Phylogenet Evol. 2013;67:223–233. doi: 10.1016/j.ympev.2013.01.010. S1055-7903(13)00029-8 [pii] [DOI] [PubMed] [Google Scholar]
- 11.Dunn CW, et al. Broad phylogenomic sampling improves resolution of the animal tree of life. Nature. 2008;452:745–749. doi: 10.1038/nature06614. nature06614 [pii] [DOI] [PubMed] [Google Scholar]
- 12.Hejnol A, et al. Assessing the root of bilaterian animals with scalable phylogenomic methods. Proceedings. Biological sciences / The Royal Society. 2009;276:4261–4270. doi: 10.1098/rspb.2009.0896. [DOI] [PMC free article] [PubMed] [Google Scholar]
- 13.Philippe H, et al. Phylogenomics revives traditional views on deep animal relationships. Curr Biol. 2009;19:706–712. doi: 10.1016/j.cub.2009.02.052. S0960-9822(09)00805-7 [pii] [DOI] [PubMed] [Google Scholar]
- 14.Pick KS, et al. Improved phylogenomic taxon sampling noticeably affects nonbilaterian relationships. Mol Biol Evol. 2010;27:1983–1987. doi: 10.1093/molbev/msq089. msq089 [pii] [DOI] [PMC free article] [PubMed] [Google Scholar]
- 15.Schierwater B, et al. Concatenated analysis sheds light on early metazoan evolution and fuels a modern “Urmetazoon” hypothesis. PLoS Biol. 2009;7:e1000020. doi: 10.1371/journal.pbio.1000020. [DOI] [PMC free article] [PubMed] [Google Scholar]
- 16.Kohn AB, et al. Rapid evolution of the compact and unusual mitochondrial genome in the ctenophorePleurobrachia bachei. Mol Phylogenet Evol. 2012;63:203–207. doi: 10.1016/j.ympev.2011.12.009. S1055-7903(11)00522-7 [pii] [DOI] [PMC free article] [PubMed] [Google Scholar]
- 17.Shimodaira H, Hasegawa M. Multiple comparisons of log-likelihoods with applications to phylogenetic inference. Molecular Biology and Evolution. 1999;16:1114–1116. [Google Scholar]
- 18.Ryan JF, Pang K, Mullikin JC, Martindale MQ, Baxevanis AD. The homeodomain complement of the ctenophore Mnemiopsis leidyi suggests that Ctenophora and Porifera diverged prior to the ParaHoxozoa. [2041-9139-1-9 [pii] 10.1186/2041-9139-1-9];Evodevo. 2010 1:9. doi: 10.1186/2041-9139-1-9. [DOI] [PMC free article] [PubMed] [Google Scholar]
- 19.Lange C, et al. Defining the origins of the NOD-like receptor system at the base of animal evolution. Mol Biol Evol. 2011;28:1687–1702. doi: 10.1093/molbev/msq349. [DOI] [PubMed] [Google Scholar]
- 20.Leulier F, Lemaitre B. Toll-like receptors--taking an evolutionary approach. Nat Rev Genet. 2008;9:165–178. doi: 10.1038/nrg2303. nrg2303 [pii] [DOI] [PubMed] [Google Scholar]
- 21.Steinmetz PR, et al. Independent evolution of striated muscles in cnidarians and bilaterians. Nature. 2012;487:231–234. doi: 10.1038/nature11180. nature11180 [pii] [DOI] [PMC free article] [PubMed] [Google Scholar]
- 22.Chen S, Krinsky BH, Long M. New genes as drivers of phenotypic evolution. Nat Rev Genet. 2013;14:645–660. doi: 10.1038/nrg3521. [pii] [DOI] [PMC free article] [PubMed] [Google Scholar]
- 23.Tautz D, Domazet-Loso T. The evolutionary origin of orphan genes. Nat Rev Genet. 2011;12:692–702. doi: 10.1038/nrg3053. nrg3053 [pii] [DOI] [PubMed] [Google Scholar]
- 24.Nishikura K. Functions and regulation of RNA editing by ADAR deaminases. Annu Rev Biochem. 2010;79:321–349. doi: 10.1146/annurev-biochem-060208-105251. [DOI] [PMC free article] [PubMed] [Google Scholar]
- 25.Savva YA, Rieder LE, Reenan RA. The ADAR protein family. Genome Biol. 2012;13:252. doi: 10.1186/gb-2012-13-12-252. gb-2012-13-12-252 [pii] [DOI] [PMC free article] [PubMed] [Google Scholar]
- 26.Yano M, Hayakawa-Yano Y, Mele A, Darnell RB. Nova2 regulates neuronal migration through an RNA switch in disabled-1 signaling. Neuron. 2010;66:848–858. doi: 10.1016/j.neuron.2010.05.007. S0896-6273(10)00375-2 [pii] [DOI] [PMC free article] [PubMed] [Google Scholar]
- 27.Zhang C, et al. Integrative modeling defines the Nova splicing-regulatory network and its combinatorial controls. Science. 2010;329:439–443. doi: 10.1126/science.1191150. science.1191150 [pii] [DOI] [PMC free article] [PubMed] [Google Scholar]
- 28.Traynelis SF, et al. Glutamate receptor ion channels: structure, regulation, and function. Pharmacol Rev. 2010;62:405–496. doi: 10.1124/pr.109.002451. 62/3/405 [pii] [DOI] [PMC free article] [PubMed] [Google Scholar]
- 29.Omote H, Miyaji T, Juge N, Moriyama Y. Vesicular neurotransmitter transporter: bioenergetics and regulation of glutamate transport. Biochemistry. 2011;50:5558–5565. doi: 10.1021/bi200567k. [DOI] [PubMed] [Google Scholar]
- 30.El Mestikawy S, Wallen-Mackenzie A, Fortin GM, Descarries L, Trudeau LE. From glutamate co-release to vesicular synergy: vesicular glutamate transporters. Nat Rev Neurosci. 2011;12:204–216. doi: 10.1038/nrn2969. nrn2969 [pii] [DOI] [PubMed] [Google Scholar]
- 31.Palczewski K, Orban T. From atomic structures to neuronal functions of G protein-coupled receptors. Annu Rev Neurosci. 2013;36:139–164. doi: 10.1146/annurev-neuro-062012-170313. [DOI] [PMC free article] [PubMed] [Google Scholar]
- 32.Krishtal O. The ASICs: signaling molecules? Modulators? Trends in neurosciences. 2003;26:477–483. doi: 10.1016/S0166-2236(03)00210-8. S0166-2236(03)00210-8 [pii] [DOI] [PubMed] [Google Scholar]
- 33.Panchin YV. Evolution of gap junction proteins--the pannexin alternative. J Exp Biol. 2005;208:1415–1419. doi: 10.1242/jeb.01547. 208/8/1415 [pii] [DOI] [PubMed] [Google Scholar]
- 34.Liebeskind BJ, Hillis DM, Zakon HH. Evolution of sodium channels predates the origin of nervous systems in animals. Proc Natl Acad Sci U S A. 2011;108:9154–9159. doi: 10.1073/pnas.1106363108. 1106363108 [pii] [DOI] [PMC free article] [PubMed] [Google Scholar]
- 35.Moroz LL, Kohn AB. Analysis of gene expression in neurons and synapses by multi-color in situ hybridization. Methods in Molecular Biology. 2014 in press. [Google Scholar]
- 36.Zerbino DR, Birney E. Velvet: algorithms for de novo short read assembly using de Bruijn graphs. Genome Res. 2008;18:821–829. doi: 10.1101/gr.074492.107. gr.074492.107 [pii] [DOI] [PMC free article] [PubMed] [Google Scholar]
- 37.Luo R, et al. SOAPdenovo2: an empirically improved memory-efficient short-read de novo assembler. GigaScience. 2012;1:18, 1–6. doi: 10.1186/2047-217X-1-18. [DOI] [PMC free article] [PubMed] [Google Scholar]
- 38.Simpson JT, et al. ABySS: a parallel assembler for short read sequence data. Genome Res. 2009;19:1117–1123. doi: 10.1101/gr.089532.108. gr.089532.108 [pii] [DOI] [PMC free article] [PubMed] [Google Scholar]
- 39.Stanke M, Diekhans M, Baertsch R, Haussler D. Using native and syntenically mapped cDNA alignments to improve de novo gene finding. Bioinformatics. 2008;24:637–644. doi: 10.1093/bioinformatics/btn013. btn013 [pii] [DOI] [PubMed] [Google Scholar]
- 40.Salamov AA, Solovyev VV. Ab initio gene finding in Drosophila genomic DNA. Genome Res. 2000;10:516–522. doi: 10.1101/gr.10.4.516. [DOI] [PMC free article] [PubMed] [Google Scholar]
- 41.Solovyev V. In: Handbook of Statistical Genetics. Balding David J, Bishop Martin, Cannings Chris., editors. John Wiley & Sons; 2007. pp. 97–159. [Google Scholar]
- 42.Sayers EW, et al. Database resources of the National Center for Biotechnology Information. Nucleic Acids Res. 2009;37:D5–15. doi: 10.1093/nar/gkn741. gkn741 [pii] [DOI] [PMC free article] [PubMed] [Google Scholar]
- 43.Altschul SF, et al. Gapped BLAST and PSI-BLAST: a new generation of protein database search programs. Nucleic Acids Res. 1997;25:3389–3402. doi: 10.1093/nar/25.17.3389. gka562 [pii] [DOI] [PMC free article] [PubMed] [Google Scholar]
- 44.Kent WJ. BLAT--the BLAST-like alignment tool. Genome Res. 2002;12:656–664. doi: 10.1101/gr.229202. Article published online before March 2002. [DOI] [PMC free article] [PubMed] [Google Scholar]
- 45.Jurka J, et al. Repbase Update, a database of eukaryotic repetitive elements. Cytogenet Genome Res. 2005;110:462–467. doi: 10.1159/000084979. CGR20051101_4462 [pii] [DOI] [PubMed] [Google Scholar]
- 46.Kapitonov VV, Tempel S, Jurka J. Simple and fast classification of non-LTR retrotransposons based on phylogeny of their RT domain protein sequences. Gene. 2009;448:207–213. doi: 10.1016/j.gene.2009.07.019. S0378-1119(09)00416-8 [pii] [DOI] [PMC free article] [PubMed] [Google Scholar]
- 47.Kohn AB, Moroz TP, Barnes JP, Netherton M, Moroz LL. Single-cell semiconductor sequencing. Methods Mol Biol. 2013;1048:247–284. doi: 10.1007/978-1-62703-556-9_18. [DOI] [PMC free article] [PubMed] [Google Scholar]
- 48.Moroz LL, Kohn AB. Single-neuron transcriptome and methylome sequencing for epigenomic analysis of aging. Methods Mol Biol. 2013;1048:323–352. doi: 10.1007/978-1-62703-556-9_21. [DOI] [PMC free article] [PubMed] [Google Scholar]
- 49.Grabherr MG, et al. Full-length transcriptome assembly from RNA-Seq data without a reference genome. Nat Biotechnol. 2011;29:644–652. doi: 10.1038/nbt.1883. nbt.1883 [pii] [DOI] [PMC free article] [PubMed] [Google Scholar]
- 50.Martin M. Cutadapt removes adapter sequences from high-throughput sequencing reads. EMBnet. 2011;17:10–12. [Google Scholar]
- 51.Ashburner M, et al. Gene ontology: tool for the unification of biology. The Gene Ontology Consortium. Nat Genet. 2000;25:25–29. doi: 10.1038/75556. [DOI] [PMC free article] [PubMed] [Google Scholar]
- 52.Kanehisa M, Goto S. KEGG: kyoto encyclopedia of genes and genomes. Nucleic Acids Res. 2000;28:27–30. doi: 10.1093/nar/28.1.27. gkd027 [pii] [DOI] [PMC free article] [PubMed] [Google Scholar]
- 53.Kanehisa M, Goto S, Sato Y, Furumichi M, Tanabe M. KEGG for integration and interpretation of large-scale molecular data sets. [gkr988 [pii] 10.1093/nar/gkr988];Nucleic Acids Res. 2012 40:D109–114. doi: 10.1093/nar/gkr988. [DOI] [PMC free article] [PubMed] [Google Scholar]
- 54.Bateman A, et al. The Pfam protein families database. Nucleic Acids Res. 2004;32:D138–141. doi: 10.1093/nar/gkh12132/suppl_1/D138. [pii] [DOI] [PMC free article] [PubMed] [Google Scholar]
- 55.Girardo DO, Citarella MR, Kohn AB, Moroz LL. Automatic Transcriptome Analysis and Quest for Signaling Molecules In Basal Metazoans. Integrative and Comparative Biology Abstact meeting; 2012. p. P1.136. [Google Scholar]
- 56.Girardo DO, Citarella M, Kohn AB, Moroz LL. Zero-click, automatic assembly, annotation and visualization workflow for comparative analysis of transcriptomes: The quest for novel signaling pathways. Integrative and Comparative Biology. 2013:11.6. Abstract. [Google Scholar]
- 57.Ryan JF, et al. The genome of the ctenophore Mnemiopsis leidyi and its implications for cell type evolution. Science. 2013;342:1242592. doi: 10.1126/science.1242592. 342/6164/1242592 [pii] [DOI] [PMC free article] [PubMed] [Google Scholar]
- 58.Kocot KM, et al. Phylogenomics reveals deep molluscan relationships. Nature. 2011;477:452–456. doi: 10.1038/nature10382. nature10382 [pii] [DOI] [PMC free article] [PubMed] [Google Scholar]
- 59.Stamatakis A. RAxML-VI-HPC: maximum likelihood-based phylogenetic analyses with thousands of taxa and mixed models. Bioinformatics. 2006;22:2688–2690. doi: 10.1093/bioinformatics/btl446. btl446 [pii] [DOI] [PubMed] [Google Scholar]
- 60.Larkin MA, et al. Clustal W and Clustal X version 2.0. Bioinformatics. 2007;23:2947–2948. doi: 10.1093/bioinformatics/btm404. btm404 [pii] [DOI] [PubMed] [Google Scholar]
- 61.Chenna R, et al. Multiple sequence alignment with the Clustal series of programs. Nucleic Acids Res. 2003;31:3497–3500. doi: 10.1093/nar/gkg500. [DOI] [PMC free article] [PubMed] [Google Scholar]
- 62.Jeanmougin F, Thompson JD, Gouy M, Higgins DG, Gibson TJ. Multiple sequence alignment with Clustal X. Trends Biochem Sci. 1998;23:403–405. doi: 10.1016/s0968-0004(98)01285-7. [DOI] [PubMed] [Google Scholar]
- 63.Edgar RC. MUSCLE: a multiple sequence alignment method with reduced time and space complexity. BMC Bioinformatics. 2004;5:113. doi: 10.1186/1471-2105-5-113. 1471-2105-5-113 [pii] [DOI] [PMC free article] [PubMed] [Google Scholar]
- 64.Castresana J. Selection of conserved blocks from multiple alignments for their use in phylogenetic analysis. Mol Biol Evol. 2000;17:540–552. doi: 10.1093/oxfordjournals.molbev.a026334. [DOI] [PubMed] [Google Scholar]
- 65.Tamura K, et al. MEGA5: molecular evolutionary genetics analysis using maximum likelihood, evolutionary distance, and maximum parsimony methods. Mol Biol Evol. 2011;28:2731–2739. doi: 10.1093/molbev/msr121. msr121 [pii] [DOI] [PMC free article] [PubMed] [Google Scholar]
- 66.Ptitsyn A, Moroz LL. Computational workflow for analysis of gain and loss of genes in distantly related genomes. BMC Bioinformatics. 2012;13(Suppl 15) doi: 10.1186/1471-2105-13-S15-S5. [DOI] [PMC free article] [PubMed] [Google Scholar]
- 67.Moroz LL, et al. Neuronal transcriptome of Aplysia: Neuronal compartments and circuitry. Cell. 2006;127:1453–1467. doi: 10.1016/j.cell.2006.09.052. [DOI] [PMC free article] [PubMed] [Google Scholar]
- 68.Fuller RR, Moroz LL, Gillette R, Sweedler JV. Single neuron analysis by capillary electrophoresis with fluorescence spectroscopy. Neuron. 1998;20:173–181. doi: 10.1016/s0896-6273(00)80446-8. S0896-6273(00)80446-8 [pii] [DOI] [PubMed] [Google Scholar]
- 69.Lapainis T, Rubakhin SS, Sweedler JV. Capillary electrophoresis with electrospray ionization mass spectrometric detection for single-cell metabolomics. Anal Chem. 2009;81:5858–5864. doi: 10.1021/ac900936g. [DOI] [PMC free article] [PubMed] [Google Scholar]
- 70.Nemes P, Knolhoff AM, Rubakhin SS, Sweedler JV. Metabolic differentiation of neuronal phenotypes by single-cell capillary electrophoresis-electrospray ionization-mass spectrometry. Anal Chem. 2011;83:6810–6817. doi: 10.1021/ac2015855. [DOI] [PMC free article] [PubMed] [Google Scholar]
Associated Data
This section collects any data citations, data availability statements, or supplementary materials included in this article.


