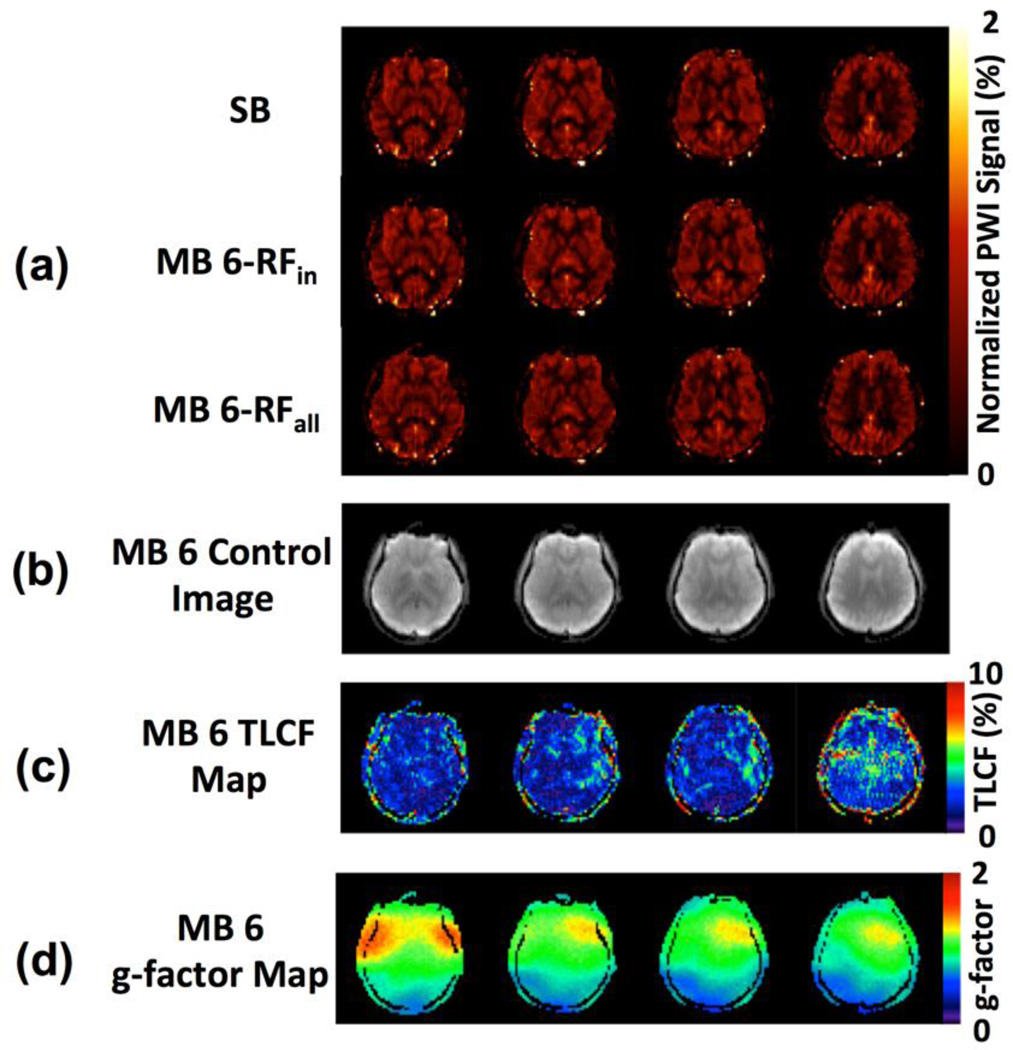
Figure 2.
Images from a representative subject in comparison study 1 using SB- and MB-EPI with an acceleration factor 6: (a) normalized perfusion-weighed images (PWI) in the middle superior brain region by SB-EPI (top), MB-RFin (middle) and MB-RFall (bottom); (b) control images acquired in the MB-RFall acquisition; (c) total leakage factor (TLF) map, and (d) g-factor map. MB-RFin refers to acquisition when only turning on the RF pulse component exciting slices which match the SB-EPI acquisition, and MB-RFall refers to standard without turning off any MB-EPI excitation RF pulse components. The presented PWIs were normalized PWIs by using mean control images as the reference.

