

Abstract
Ovarian cancer is the deadliest gynecological cancer, which may arise in part due to the concurrent invasion and metastasis of high grade tumors. It is thus crucial to gain insight into the adhesion and migration mechanisms in vivo, as this may ultimately lead to new treatment/detection options. To explore this possibility, we have used multiphoton excited photochemistry (MPE) to synthesize models of the ovarian basal lamina consisting of crosslinked laminin nanofibers to quantify the adhesion/migration dynamics. The nanostructured laminin patterns permit the systematic comparison of total migration, directed migration, adhesion, and morphology of “normal” immortalized human ovarian epithelial cells (IOSE) and three lines of varying metastatic potential (OVCA433, SKOV-3.ip1, and HEY-1 cells). We find that the migration of all the cell lines is directed by the crosslinked fibers, and that the contact guidance enhances the total migration rates relative to monolayers. These rates increase with increasing metastatic potential, and the more invasive cells are less rigid and more weakly adhered to the nanofibers. The extent of directed migration also depends on the cell polarity and focal adhesion expression. For the invasive cells, these findings are similar to the integrin-independent ameboid-like migration seen for polar cells in collagen gels. Collectively, the results suggest that contact mediated migration as well as decreased adhesion may be operative in metastasis of ovarian cancer in vivo.
1. Introduction
Cancers of the ovary are the deadliest of the gynecologic cancers, with a five-year survival rate from 1989–1996 in the United States of 30% or less.1 The current paradigm suggests that invasion/metastasis may be synchronous in high grade disease. Metastasis is believed to occur by cancer cells exfoliating from the epithelium and subsequently re-adhering in the intra-peritoneal cavity and/or by invasion across the basal lamina into the stroma, and subsequent entrance into the lymphatic or vascular systems. Thus it is important to gain a detailed understanding of the adhesion and migration dynamics and how these may be a function of the metastatic potential of the tumor, as such insights into the underlying cell–matrix interactions may ultimately lead to new treatments based on controlling these dynamic processes.
Most previous migration assays have been performed either on tissue culture coatings (e.g. Matrigel) or in Boyden (transwell) chambers,2–4 where migration was quantified by comparing the number of motile cells per field. Although collagen coatings present some of the relevant biochemical cues, these substrates are not biomimetic models of the native ECM where the constituent proteins are covalently crosslinked into nanostructured fibrils/fibers. This is a crucial issue, as in general both 3D nano/microtopography and biochemistry of the ECM are important for cell adhesion, shape, migration, and proliferation.5 In terms of epithelial cancers, these cell–matrix interactions may affect invasion and metastasis. For example, haptotaxis (i.e. migration towards attractive surfaces) is believed to be important in metastasis.6–8 Similarly, contact guidance along collagen fibers has also been observed in models of breast cancer.9,10 Thus, there remains a need for in vitro models that better represent the native ovarian ECM to study adhesion/migration dynamics.
To address these shortcomings, we have developed fabrication methods to better mimic the crosslinked nano/microstructure of the ovarian basal lamina. Our approach uses multiphoton excited (MPE) photochemistry, where analogous to two-photon excited fluorescence microscopy, the excitation and fabrication are confined to the focal volume, resulting in intrinsic 3D capabilities and affording sub-micron feature sizes.11–15 Our previous efforts using this technology have been directed at fabricating scaffolds from ECM proteins (e.g. collagen, fibronectin, fibrinogen).14,16,17 Through detailed analysis of morphology and cytoskeletal architecture, we have shown how topography and ECM cues, together and separately, affect the adhesion dynamics of dermal fibroblasts on micropatterned crosslinked fibronectin, fibrinogen and collagen fibers.17 These findings suggested the importance of careful reconstruction of the ECM in vitro to reproduce the in vivo structure, which are not replicated in either coated cultures or transwell chambers.
We now use this approach to study migration/adhesion dynamics in ovarian cancer because metastasis occurs in almost 90% of these cancers and understanding this process is critical to improving patient outcome. Using nanopatterned crosslinked laminin fibers, we have quantitatively compared “normal” immortalized epithelial cells (IOSE) as well as three ovarian cancer lines of differing metastatic potential (OVCA433, SKOV-3.ip1, HEY-1) through measurements of total migration speed, migration directionality, relative adhesion strength, and cell polarity. We found increased total migration rates and decreased adhesion are associated with the more invasive cells, suggesting these characteristics are important for metastasis in vivo. Moreover, we find that the cells migrate more rapidly and with well-defined directionality on the laminin nanofibers, demonstrating how haptotactic and contact guidance processes are operative in the adhesion/migration dynamics.
2. Materials and methods
2.1 Fabrication design and chamber
The primary components of the ovarian basal lamina in vivo are laminin and type IV collagen.18,19 For simplicity we utilize models comprised solely of crosslinked laminin fibers. To perform cell migration measurements, it is desirable to fabricate large patterns to allow imaging enough cells for statistical analysis and yet maintain sparse seeding because our goal is to isolate cell–ECM interactions from cell–cell interactions. To achieve this, the magnification power of the microscope objective needs to be as low as possible. At the same time, multiphoton excited crosslinking requires high peak power and thus a small focal volume (i.e. an objective with high numerical aperture and concomitant high magnification).11 As a compromise, we used a 10× 0.5 NA objective, which yields laminin fibers 800 microns long (lens field of view), 600 nm in diameter and 2 microns in height, where the latter two are governed by the point spread function of the lens. These fibers are then separated by 10 microns. We have used similar sized fibers and spacing previously to study fibroblast adhesion and spreading.17
The patterns are fabricated on a microscope slide, where a self assembled organosilane monolayer is coated with a monolayer of BSA (1 mg ml−1) to form the base for the laminin fibers. The BSA is used as a non-specific surface to compare the adhesion dynamics of the cells on and off the crosslinked laminin. The fabrication solution consisted of 1 mg ml−1 laminin (Millipore, 08–125, purified from mouse) and 1 mM modified benzophenone dimer as the photoactivator (see below),15 and was confined in a small circular rubber chamber (Grace Bio Labs, SA8R-0.5) seated on top of the BSA monolayer. After fabrication, the structures were washed with deionized water, rinsed with PBS pH 7.4 (GIBCO) containing 400 μg ml−1 penicillin and 400 μg ml−1 streptomycin under sterile conditions, and kept hydrated for cell plating.
2.2 Fabrication instrument and photochemistry
The multiphoton fabrication instrument has been described in detail previously.12 Briefly, the photochemistry is induced by a femtosecond titanium sapphire laser (Coherent Mira) operating at 780 nm. The purpose-built laser scanning microscope system is mounted on an upright stand (Zeiss Axioskop2). The photactivator is a modified benzophenone dimer where the two monomers are linked by a flexible tether.15 Upon excitation of the π→π* transition, each benzophenone moiety forms a ketyl diradical which then inserts into a protein molecule to create a new C–N or C–C bond.14 Structures were fabricated by a combination of one-dimensional laser galvoscanning and motorized translation stage scanning. The average power at the focus (100 mW) and exposure time were kept constant to ensure constant crosslink density (i.e. laminin concentration) for all migration studies. The resulting fibers were immunostained by incubation with a primary laminin antibody (1 : 200, Abcam) for 1 h, and then a secondary antibody rabbit IgG conjugated with rhodamine (1 : 100, Immunoresearch) for 45 min. Two-photon excited fluorescence of the immunostained laminin was imaged with the same laser scanning microscopy setup used for fabrication.
2.3 Cell culture and time-lapse microscopy
IOSE,20 OVCA433,20 SKOV-3.ip1 and HEY-1 (from Dr Susan Huang, MD Anderson Cancer Center)21 cells were cultured on the 24-plate multiwell plate to confluence with 1 : 1 Dulbecco’s Modified Eagle’s medium and F12 (GIBCO) supplemented with 10% fetal bovine serum in a humidified incubator at 37 °1C in which the CO2 level was maintained at 5%. We used 10% FBS in these studies (both culture and migration measurements) as our prior work showed that IOSE cells do not grow well in lower serum levels.20 The cells were trypsinized and fabricated structures were seeded with ~24 000 cells ml−1 in culture medium (DMEM/F12) and incubated. The cells were allowed to adhere and spread for approximately 5 h and mineral oil was then added on top of the culture medium to keep the cells sterile as well as to prevent evaporation.
Migration rates were measured on an inverted microscope (Nikon ECLIPSE TE300) equipped with a CCD camera (Watec WAT-902B) and an automatic temperature controller (Warner Instruments TC-324B). The samples were maintained at 37 °C and phase contrast images were acquired with a 4× objective (Nikon CFI Plan Fluor DL) at 10 min intervals for a total period of ~14 h. ImageJ software ((http://rsb.info.nih.gov/ij) was used to manually trace the trajectory of individual cells and the cell average migration speed was obtained according to the following equation:
where n is the total frame number, t is the total migration time and (xi, yi) are the coordinates of the cell under study on the ith image frame. All measurements were performed in triplicate.
2.4 Dual staining for focal adhesions and F-actin
For focal adhesion and actin staining, the cells were incubated overnight and fixed for 15 min with 4% formaldehyde. The cells were permeabilized with 0.2% triton X-100 and treated with 1% BSA in PBS to block non-specific sites. For the focal adhesion staining, the cells were first incubated with anti-vinculin (1 : 200, Abcam ab1119) for 1 h, followed by a secondary fluorescent antibody (goat-anti-mouse F(ab’)2 IgG conjugated with AlexaFluor, Invitrogen Corporation) for 45 min. To stain for F-actin, the cells were incubated with Texas Red conjugated phalloidin for 45 min (simultaneously with the IgG secondary fluorescent antibody). Fluorescence images of both the AlexaFluor and the Texas Red channels were recorded with a highly sensitive CCD camera (Andor Technology DV887ECS-BV) using a 40× 0.65 NA objective. The corresponding phase contrast images were recorded sequentially. The numbers of focal adhesion points per cell were counted using ImageJ by finding the local intensity maxima. This software was further used to determine the area of the cells by tracing the cell contour.
2.5 Statistical analysis of migration speed and number of focal adhesions
Migration, focal adhesion, and spread area data are reported as the mean value with the corresponding standard error for the four cell types. Pairwise t-tests (Origin 7.0; OriginLab Corporation) were used to compare the three different cancer cell lines to the IOSE cells (our normal control), as well as to each other. A standard significance level of p <5% was used for all the analyses.
3. Results
3.1 Migration measurements
(a) Imaging structures and seeded cells
We begin by showing images of the patterns and adhered cells. Fig. 1a shows an immunofluorescence image of a small portion of one of the patterns, where the selective binding of the antibody suggests the laminin is not significantly denatured during the fabrication process. Fig. 1b (10×) and 1c (4×) are representative phase contrast images at different magnification showing the adhesion of OVCA433 cells to the crosslinked laminin 5 h after plating. The laminin is visible in phase contrast as the refractive index of the crosslinked protein is higher than the background BSA monolayer. Fig. 1b (10×) shows that the cells tend to align and elongate along the laminin fibers, demonstrating the contact guidance provided by the morphology. To further demonstrate the preferential adhesion of the cells, we show the lower magnification image in Fig. 1c (4×) where the region outside the dashed rectangle is the BSA monolayer background with no laminin. In contrast to the cells on the patterns, those on the non-specific BSA monolayer background largely remain unspread. Analogous results were observed for the four cell lines. Collectively these results indicate that the crosslinked laminin retains its biological activity following MPE photocrosslinking and that this is a biomimetic approach that can be used to study adhesion/migration dynamics.
Fig. 1.
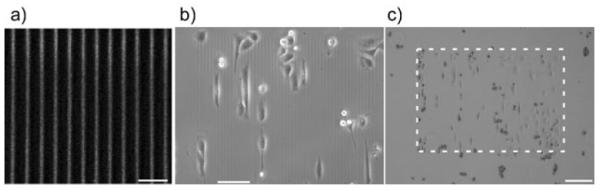
maging of the crosslinked laminin structures used for the migration and cytoskeletal studies. (a) Immunofluorescence imaging of the crosslinked laminin fibers, scale bar = 20 microns; (b) 10× phase contrast showing OVCA433 cells on the laminin fibers, scale bar = 100 microns; (c) 4× phase contrast showing cells on the pattern (delineated by the dashed box) and those located on the background BSA monolayer, scale bar = 200 microns.
(b) Migration dynamics of ovarian cancer cells on laminin nanofibers
We investigated if there was a correlation between migration properties and metastatic potential on the crosslinked laminin fibers. To this end, we measured the migration rates and directionality of OVCA433, SKOV-3.ip1, and HEY-1 ovarian cancer cell lines, which are characterized by mild, moderate, and high levels of metastasis and invasiveness, respectively. Immortalized IOSE cells are used to represent normal cells because primary cell cultures of ovarian epithelial cells are difficult to grow and propagate. Representative 10 h trajectories for several IOSE and HEY-1 cells are shown in Fig. 2a and b, respectively, where we define the y axis as the direction of the fiber axes.
Fig. 2.

epresentative migration trajectories for the IOSE (a) and HEY-1 cells (b) over 10 h, where each step size is 10 min. (c) Bar graph of the average migration speeds for the IOSE, OVCA433, SKOV-3.ip1, and HEY-1 cells where the error bars are standard error. The resulting p values are given in Table 1.
A bar graph of the resulting total migration speeds as calculated by eqn (1) for the four cell lines is shown in Fig. 2c, where the averages arise from the average of triplicate runs in each case. The number of analyzed cells was 78, 50, 72 and 130 for the IOSE, OVCA433, SKOV-3.ip1 and HEY-1, respectively, where the differences result from variability in the probability of cells landing on and/or migrating to the patterns. There is a positive correlation between increased migration and increasing metastatic potential from the IOSE (28 μm h−1) through the HEY-1 cells (48 μm h−1). The resulting p values from t-tests comparing each cell type pairwise are given in Table 1. At the 5% significance level, the three cancer cell types have migration speeds significantly different from that of the “normal” IOSE cell. Additionally, the migration speeds of the cancer cells are statistically different from each other and increase with invasiveness. These results suggest that migration is an operative mechanism in the metastasis of ovarian cancer.
Table 1.
p values from pairwise two-sample t-tests of migration speed
| IOSE n = 78 |
OVCA433 n = 50 |
SKOV-3.ip1 n = 72 |
HEY-1 n = 130 |
|
|---|---|---|---|---|
| IOSE | 8.12E-03 | 1.23E-11 | 7.23E-39 | |
| OVCA433 | 1.47E-04 | 1.06E-21 | ||
| SKOV-3.ip1 | 8.28E-12 |
Next we examined the directionality of the migration for these cell lines, as this will result from biochemical cues from the laminin as well as the contact guidance that allows cells to migrate in response to the morphology. The trajectories for IOSE (2a) and HEY-1 (2b) cells show that the migration for the former is predominantly along the laminin fiber axes, whereas the HEY-1 cells take larger step sizes and sample more of the fibers. To quantify the directionality we define the directional ratio as the y displacement (direction of the fiber) over the x displacement (from eqn (1)). The data are summarized in Fig. 3, and the resulting p values from pairwise t-tests comparing each cell type are given in Table 2. All the cells show a statistical preference (y/x >1) for the laminin fibers, ranging from the highly aggressive HEY-1 cells (1.2 ± 0.03) to the SKOV-3.ip1 (2.03 ± 0.11). Thus contact guidance is operative for all the cell lines.
Fig. 3.

irectional migration data for the four cell lines, plotted in terms of y/x displacement where y corresponds to the laminin fiber axis. All cell lines have ratios greater than one, indicating the importance of contact guidance. The corresponding p values from pairwise t-tests are given in Table 2.
Table 2.
p values from pairwise two-sample t-tests of directed migration (y/x)
| IOSE n = 41 |
OVCA433 n = 55 |
SKOV-3.ip1 n = 72 |
HEY-1 n = 109 |
|
|---|---|---|---|---|
| IOSE | 0.52 | 7.28E-5 | 0.02 | |
| OVCA433 | 1.68E-4 | 1.52E-3 | ||
| SKOV-3.ip1 | 1.50E-14 |
To isolate the contribution of contact guidance on the patterned laminin, we compared the total and directed migration for SKOV-3.ip1 cells on the laminin fibers vs. on a self assembled monolayer of laminin, where several representative cell trajectories are shown in Fig. 4a and b, respectively. Based on these data, the cells on the monolayer migrate with no preferential direction, and have little net displacement. In addition, the total migration rates for the SKOV-3.ip1 cells on the fibers were greater (37.8 ± 1.2 vs. 30.7 ± 1.1 μm h−1; p = 4 × 10⁻⁵). This also was borne out for the HEY-1 cells (48.3 ± 0.9 vs. 42.0 ± 1.7 μm h−1; p = 0.002), further delineating the role of contact guidance in enhancing migration speed. These results suggest that preferential migration along fibers may facilitate the metastasis of ovarian cancer, similar to that reported in breast cancer.9,22
Fig. 4.

rajectories of SKOV-3.ip1 cells on (a) fibers, where the box delineates the region of fabricated laminin fibers from the background BSA; and on a self assembled monolayer (b). In addition to the difference in directionality, cells on the fibers have increased total migration (37.8 ± 1.2 vs. 30.7 ± 1.1 μm h−1).
3.2 Cytoskeleton properties
We next examined the cytoskeletal and morphological properties of the four cell types on the crosslinked laminin fibers to determine if the cellular organization is biologically consistent with the migration data shown in Fig. 2. Representative composite images (phase contrast, focal adhesions (red), f-actin (green) and two color overlap) for the four cell types are shown in Fig. 5a.
Fig. 5.

(a) Cytoskeletal staining for IOSE, OVCA433, SKOV-3.ip1 and HEY-1 cells, where the columns from left to right are phase contrast, focal adhesions (red, anti-vinculin), F-actin (green, phalloidin), and the two color overlap. Field size = 200 microns for all frames. (b) Enlarged version for IOSE cells showing overlap of the focal adhesions with the laminin fibers, where the latter are drawn in based on the phase contrast image.
(a) Migration and focal adhesion expression
We first investigated if the nanopatterns are driving the adhesion by determining if the focal adhesions are spatially associated with the laminin fibers. This was performed by counting the number of focal adhesions on the crosslinked fibers vs. those in the inter-fiber space and taking their ratios. This results in ratios for the IOSE and SKOV-3.ip1 cells of 1.41 ± 0.09 (p = 3.3 × 10⁻⁵) and 1.34 ± 0.08 (p = 6.89 × 10⁻⁵), respectively, showing the focal adhesions are located on the laminin fibers in a statistically significant distribution for both cell types. Due to the much lower numbers of punctuate focal adhesions in the HEY-1 cells, this measurement was not possible for this cell line. To help visualize the preferential overlap, Fig. 5b shows an enlarged image of the IOSE cells (from Fig. 5a), where for better visibility the fibers are drawn in (dashed lines) based on their location from the phase contrast image.
Having demonstrated that the laminin fibers direct the adhesion, we compared the average number of focal adhesions and spatial distribution for the four cell types. The data are given in Fig. 6 and the resulting p values from t-tests of pairwise comparisons are given in Table 3. At the 5% significance level, the focal adhesion expression for all the cancer cell lines was significantly different from the IOSE cells. The number of distinct focal adhesions for the highly invasive HEY-1 cells was significantly different from those of the SKOV-3.ip1 and OVCA433 cells, but the latter two were not different from each other. However, the distribution of focal adhesions was more symmetric around the cell periphery of the SKOV-3.ip1 cells compared to the less aggressive OVCA433 cells which further indicates the larger role of contact guidance in the former.
Fig. 6.

ar graph of the average numbers of focal adhesions for the IOSE, OVCA433, SKOV-3.ip1, and HEY-1 cells where the error bars represent the standard error. The resulting p values are given in Table 3.
Table 3.
p values from pairwise two-sample t-tests for focal adhesions per cell
| IOSE n = 44 |
OVCA433 n = 24 |
SKOV-3.ip1 n = 53 |
HEY-1 n = 24 |
|
|---|---|---|---|---|
| IOSE | 0.0016 | 4.04E-7 | 5.92E-16 | |
| OVCA433 | 0.23 | 1.27E-17 | ||
| SKOV-3.ip1 | 2.01E-16 |
If we interpret the density of focal adhesions as a measure of relative adhesion strength of the different cell lines, then these results indicate that there is a relationship between decreasing adhesion strength and increasing metastatic potential, where the most rapidly migrating HEY-1 cells are the most weakly adhered. We recognize that the physical size of the adhesions as well as their density will determine the absolute adhesion strength but the dimensions of single complexes are below optical resolution. Thus we present these results for qualitative comparative purposes which indicate that weaker adhesion is also associated with more rapid migration when comparing these cell lines.
(b) Migration and cell shape
We can further relate the migration and adhesion properties to the respective cell shape and spread area of the four cell lines. Due to the large differences in the typical morphology of each line, the area was calculated from the traced perimeter rather than from the aspect ratio if the cell shape was modeled by an ellipse. The results are plotted in Fig. 7, and the resulting p values are given in Table 4. These results reveal the trend that the spread area decreases significantly with increasing cell metastatic potential. We further point out that the HEY-1 cells are highly branched and do not display clear stress fibers, but only smaller filopodia. This is indicative of high flexibility of the cell, where this morphology may enhance migration and further enable invasion into the stroma. In the other limit, the IOSE cells display well-defined stress fibers typical of well-adhered and spread cells that terminate at the position of punctate focal adhesions, which are predominantly located on the leading edge (Fig. 5b). While the SKOV-3.ip1 and OVCA433 have spread areas that are not statistically different, the former have a phenotype that is characterized by smaller, nascent focal adhesions (Fig. 5a), and a non-polar lamellipod (i.e., uniform around the cell). In contrast, the OVCA433s have a more polar morphology and display less directed migration. Thus the observed migration properties result from a combination of factors including the metastatic potential and cell polarity.
Fig. 7.

reas of spread IOSE, OVCA433, SKOV-3.ip1, and HEY-1 cells, where the error bars represent the standard error. The resulting p values are given in Table 4.
Table 4.
p values from pairwise two-sample t-tests for spread area
| IOSE n = 46 |
OVCA433 n = 58 |
SKOV-3.ip1 n = 49 |
HEY-1 n = 24 |
|
|---|---|---|---|---|
| IOSE | 3.72E-10 | 6.71E-9 | 3.69E-15 | |
| OVCA433 | 0.55 | 2.24E-8 | ||
| SKOV-3.ip1 | 4.89E-5 |
4. Discussion
4.1 Need for biomimetic in vitro models of the ECM
The cell–ECM interactions that are operative in epithelial cancers are not well understood in general, and have not been studied in detail for ovarian cancer. Most previous reports studying migration of ovarian cancer cells have utilized coated surfaces and assayed migration by counting the number of migratory cells per field.2,3,23 However, cell migration and cytoskeletal dynamics are often different on such planar surfaces than in the presence of the nanostructured topography found in vivo. Thus we suggest that more mimetic approaches are needed to better replicate this fibrillar environment. This is an important consideration for cancer as in vivo cells may migrate preferentially along fibers via contact guidance to facilitate invasion and/or metastasis, which has been reported by Condeelis9 and Keely10 for epithelial breast cancer cells. Based on these observations, we fabricated nanostructured models of the basement membrane to better address the relationships between cell morphology, migration and adhesion dynamics in ovarian cancer. We have shown that these properties are different on the laminin fibers as compared to monolayers.
4.2 Migration, adhesion and metastatic potential
The “normal” (IOSE), weakly metastatic (OVCA433), moderately metastatic (SKOV-3.ip1), and highly metastatic (HEY-1) cells were chosen for their different aggressiveness to better understand differences in their adhesion/migration dynamics using fibrillar models to determine if there was a correlation between these dynamics and their ability to metastasize. We have found a positive correlation between total migration speed and metastatic potential where the results for all the cells are statistically distinct from each other. We note that these are relative measurements, as the absolute rates would depend on the specific environment in terms of serum levels and growth factors. Specifically, it has been shown previously that cells migrate more slowly in the absence of serum or low serum content in a dose dependent response.24,25 Still these results suggest that migration is an important mechanism in the metastasis of high grade ovarian cancer. Moreover, through analysis of the migration direction, we find that contact guidance enhances the migration rates. However, unlike total migration speeds, there is no simple correlation between metastatic potential and the directionality and we found that other factors such as polarity affect this migration mechanism. For example, the non-polar SKOV-3.ip1 cells had the most directed migration, where the cell shape exhibited “flattening” when migrating between the fibers. Thus it is important to understand all the factors that affect the migration as this may be important in developing strategies to impede cell motility.
We also found a trend toward increased migration speeds for the more invasive cells despite the trend of decreasing focal adhesion density. Based on behavior on planar surfaces from other cell studies, it might be expected that the lack of focal adhesions would result in limited migration ability as insufficient traction exists to begin movement.26 However, the highly invasive HEY-1 cells had very few focal adhesions, yet migrated with the highest rate, which was further enhanced on the fibers relative to that on a monolayer. This suggests that HEY-1 cells migrate in an integrin-independent mechanism. The rapid migration may arise from the combination of the flexible cytoskeletal properties (i.e. no stress fibers and branched morphology) and the contact guidance provided by the laminin fibers. Similar integrin-independent ameboidlike migration was observed by Friedl for t-lymphocytes in 3D collagen gels.27,28 An additional consequence of the low density of focal adhesions may be that cancer cells exfoliate from the surface of the ovary as a mechanism for metastasis. Indeed, cell detachment has been observed in high grade ovarian cancer in vivo by confocal imaging.29
5. Conclusions
We have presented our initial results correlating total migration rates, directed migration, and relative adhesion strength with the observed metastatic potential of three human ovarian cancer cell lines, OVCA433, SKOV-3.ip1, and HEY-1 cells, as well as compared to the control IOSE cells. We find that total migration of these cells is increased relative to the laminin monolayers and that the nanostructured fibers provide cues for directed migration, and that migration rates increase with metastatic potential. Collectively these results suggest that both haptotactic mediated migration and contact mediated migration as well as decreased adhesion may be operative in the metastasis of ovarian cancer in vivo. Both migration processes have in vivo relevance as remodeling by proteases can alter both the composition and structure of the underlying laminin. Our future efforts will build more complete models of the ECM with a stromal layer to study invasion mechanisms.
Insight, innovation, integration.
Because invasion and metastasis of human ovarian cancer are thought to be synchronous, it is crucial to understand the cell adhesion and migration dynamics. As these measurements cannot be performed in vivo, there is a strong need for biomimetic models that simulate the 3D nanoarchitecture and biochemistry of the native ovarian extracellular matrix. To simulate the basal lamina, multiphoton excited photochemistry was used to fabricate crosslinked laminin nanofibers onto a 2D background. We show that contact guidance enhances migration, suggesting this is operative in vivo during metastasis. We further find that directed migration depends on the interplay of relative adhesion strength and cell polarity. This integrated approach of nanofabrication and standard cell biological analyses provides insight into in vivo migration/adhesion dynamics.
Acknowledgements
PJC gratefully acknowledges support from NIH 1U54-RR022232. MAB gratefully acknowledges support from the Neag Cancer Center at the University of Connecticut Health Center. We thank Prof. Patricia Keely for helpful conversations. We also thank Prof. Vladimir Rodionov for the use of the imaging system for the migration studies.
References
- 1.Hoskins WJ. J. Cell. Biochem. 1995:189–199. doi: 10.1002/jcb.240590926. [DOI] [PubMed] [Google Scholar]
- 2.Sood AK, Coffin JE, Schneider GB, Fletcher MS, DeYoung BR, Gruman LM, Gershenson DM, Schaller MD, Hendrix MJ. Am. J. Pathol. 2004;165:1087–1095. doi: 10.1016/S0002-9440(10)63370-6. [DOI] [PMC free article] [PubMed] [Google Scholar]
- 3.Casey RC, Skubitz AP. Clin. Exp. Metastasis. 2000;18:67–75. doi: 10.1023/a:1026519016213. [DOI] [PubMed] [Google Scholar]
- 4.Sodek KL, Ringuette MJ, Brown TJ. Br. J. Cancer. 2007;97:358–367. doi: 10.1038/sj.bjc.6603863. [DOI] [PMC free article] [PubMed] [Google Scholar]
- 5.Sniadecki NJ, Desai RA, Ruiz SA, Chen CS. Ann. Biomed. Eng. 2006;34:59–74. doi: 10.1007/s10439-005-9006-3. [DOI] [PubMed] [Google Scholar]
- 6.Brandley BK, Schnaar RL. Dev. Biol. 1989;135:74–86. doi: 10.1016/0012-1606(89)90159-0. [DOI] [PubMed] [Google Scholar]
- 7.McCarthy JB, Furcht LT. J. Cell Biol. 1984;98:1474–1480. doi: 10.1083/jcb.98.4.1474. [DOI] [PMC free article] [PubMed] [Google Scholar]
- 8.Basara ML, McCarthy JB, Barnes DW, Furcht LT. Cancer Res. 1985;45:2487–2494. [PubMed] [Google Scholar]
- 9.Sahai E, Wyckoff J, Philippar U, Segall JE, Gertler F, Condeelis J. BMC Biotechnol. 2005;5:14. doi: 10.1186/1472-6750-5-14. [DOI] [PMC free article] [PubMed] [Google Scholar]
- 10.Provenzano PP, Inman DR, Eliceiri KW, Trier SM, Keely PJ. Biophys. J. 2008;95:5374–5384. doi: 10.1529/biophysj.108.133116. [DOI] [PMC free article] [PubMed] [Google Scholar]
- 11.Pitts JD, Campagnola PJ, Epling GA, Goodman SL. Macromolecules. 2000;33:1514–1523. [Google Scholar]
- 12.Sridhar M, Basu S, Scranton VL, Campagnola PJ. Rev. Sci. Instrum. 2003;74:3474–3477. [Google Scholar]
- 13.Cunningham LP, Veilleux MP, Campagnola PJ. Opt. Express. 2006;14:8613–8621. doi: 10.1364/oe.14.008613. [DOI] [PubMed] [Google Scholar]
- 14.Basu S, Cunningham LP, Pins G, Bush K, Toboada R, Howell AR, Wang J, Campagnola PJ. Biomacromolecules. 2005;6:1465–1474. doi: 10.1021/bm049258y. [DOI] [PubMed] [Google Scholar]
- 15.Pitts JD, Howell AR, Taboada R, Banerjee I, Wang J, Goodman SL, Campagnola PJ. Photochem. Photobiol. 2002;76:135–144. doi: 10.1562/0031-8655(2002)076<0135:npfmet>2.0.co;2. [DOI] [PubMed] [Google Scholar]
- 16.Basu S, Campagnola PJ. J. Biomed. Mater. Res. 2004;71A:359–368. doi: 10.1002/jbm.a.30175. [DOI] [PubMed] [Google Scholar]
- 17.Pins GD, Bush KA, Cunningham LP, Campagnola PJ. J. Biomed. Mater. Res. 2006;78A:194–204. doi: 10.1002/jbm.a.30680. [DOI] [PubMed] [Google Scholar]
- 18.Sasaki T, Fassler R, Hohenester E. J. Cell Biol. 2004;164:959–963. doi: 10.1083/jcb.200401058. [DOI] [PMC free article] [PubMed] [Google Scholar]
- 19.Yurchenco PD, Cheng YS, Colognato H. J. Cell Biol. 1992;117:1119–1133. doi: 10.1083/jcb.117.5.1119. [DOI] [PMC free article] [PubMed] [Google Scholar]
- 20.Brewer M, Wharton JT, Wang J, McWatters A, Auersperg N, Gershenson D, Bast R, Zou C. Gynecol. Oncol. 2005;98:182–192. doi: 10.1016/j.ygyno.2005.01.051. [DOI] [PubMed] [Google Scholar]
- 21.Huang S, Robinson JB, Deguzman A, Bucana CD, Fidler IJ. Cancer Res. 2000;60:5334–5339. [PubMed] [Google Scholar]
- 22.Provenzano PP, Inman DR, Eliceiri KW, Knittel JG, Yan L, Rueden CT, White JG, Keely PJ. BMC Med. 2008;6:11. doi: 10.1186/1741-7015-6-11. [DOI] [PMC free article] [PubMed] [Google Scholar]
- 23.Henic E, Sixt M, Hansson S, Hoyer-Hansen G, Casslen B. Gynecol. Oncol. 2006;101:28–39. doi: 10.1016/j.ygyno.2005.09.038. [DOI] [PubMed] [Google Scholar]
- 24.Brink HE, Stalling SS, Nicoll SB. In vitro Cell. Dev. Biol. 2005;41:252–257. doi: 10.1290/0503023R.1. [DOI] [PubMed] [Google Scholar]
- 25.Halfter W, Diamantis I, Monard D. Dev. Biol. 1988;130:259–275. doi: 10.1016/0012-1606(88)90432-0. [DOI] [PubMed] [Google Scholar]
- 26.Palecek SP, Loftus JC, Ginsberg MH, Lauffenburger DA, Horwitz AF. Nature. 1997;385:537–540. doi: 10.1038/385537a0. [DOI] [PubMed] [Google Scholar]
- 27.Wolf K, Muller R, Borgmann S, Brocker EB, Friedl P. Blood. 2003;102:3262–3269. doi: 10.1182/blood-2002-12-3791. [DOI] [PubMed] [Google Scholar]
- 28.Wolf K, Friedl P. Br. J. Dermatol. 2006;154(Suppl. 1):11–15. doi: 10.1111/j.1365-2133.2006.07231.x. [DOI] [PubMed] [Google Scholar]
- 29.Brewer MA, Utzinger U, Barton JK, Hoying JB, Kirkpatrick ND, Brands WR, Davis JR, Hunt K, Stevens SJ, Gmitro AF. Technol. Cancer Res. Treat. 2004;3:617–627. doi: 10.1177/153303460400300612. [DOI] [PubMed] [Google Scholar]