Abstract
Second-harmonic generation (SHG) microscopy has emerged as a powerful modality for imaging fibrillar collagen in a diverse range of tissues. Because of its underlying physical origin, it is highly sensitive to the collagen fibril/fiber structure, and, importantly, to changes that occur in diseases such as cancer, fibrosis and connective tissue disorders. We discuss how SHG can be used to obtain more structural information on the assembly of collagen in tissues than is possible by other microscopy techniques. We first provide an overview of the state of the art and the physical background of SHG microscopy, and then describe the optical modifications that need to be made to a laser-scanning microscope to enable the measurements. Crucial aspects for biomedical applications are the capabilities and limitations of the different experimental configurations. We estimate that the setup and calibration of the SHG instrument from its component parts will require 2–4 weeks, depending on the level of the user’s experience.
INTRODUCTION
Over the past decade, the nonlinear optical method of SHG microscopy has emerged as a powerful tool for visualizing the supramolecular assembly of collagen in tissues at an unprecedented level of detail1–5. This development has enabled and enhanced basic research in biology and medicine, and it has provided quantitative metrics for diagnosing a wide range of diseases6–25. Concurrently, several theoretical analyses have been developed to physically interpret the contrast mechanisms observed in SHG microscopy26–28. Although it is not meant to be comprehensive, an overview of current applications with representative references is given in Table 1.
Table 1.
Representative example applications of SHG.
| Application | Subspecialty | Representative refs. | Key conclusions/observations |
|---|---|---|---|
| Cancer | Breast | 6 | SHG can delineate cancers of different stages |
| 7 | |||
| 8 | |||
| Ovary | 9 | SHG shows an increase in collagen fibril/fiber organization | |
| 10 | |||
| Skin | 21 | SHG can delineate tumor boundaries in different types of skin cancer | |
| 22 | |||
| 23 | |||
| 24 | |||
| Fibrosis | Liver | 14 | SHG results agree with standard pathology |
| Kidney | 13 | SHG results agree with standard pathology | |
| Connective tissues and disorders | Osteogenesis imperfecta | 11 | SHG delineates normal and diseased states in several tissue types |
| Sjogren’s syndrome | 12 | SHG shows disorganized collagen in this disease | |
| Cornea | 18 | SHG can delineate the stroma from other corneal components | |
| 20 | |||
| Skin damage | 17 | SHG uniquely shows changes in collagen assembly upon thermal damage | |
| Atherosclerosis | 15 | SHG shows that collagen plaques intermingle with elastin | |
| 16 | |||
| Model tissues | 19 | Self-assembled fibrillar gels can be imaged by SHG | |
| 25 | |||
| Theory | 26 | Theoretical treatments have been developed to understand the SHG emission properties in tissues | |
| 27 | |||
| 28 |
In this article, we focus on the instrumentation and methods used for obtaining collagen structural information in the SHG microscope. To this end, we describe in detail the techniques developed in our laboratory, which we have previously used in our investigations of ovarian cancer10, connective tissue disorders11 and the mechanism of optical clearing29. It is our intent that graduate students working in this field should be able to implement this protocol. Depending on a user’s level of experience, we estimate that 2–4 weeks would be required to implement our setup from the component parts and perform the required calibrations. The reader is directed to references 1–3 for current reviews of SHG imaging, refs. 4 and 5 for earlier descriptions of the most salient aspects of the technique and to Box 1 for a glossary of terms.
Box 1 | Glossary.
Acousto-optic modulator, or AOM: an AOM or Bragg cell uses sound waves to create a grating and diffract light. In a microscope, these can be used for power control and spectral selection.
Birefringent tissues: such tissues display birefringence (or double refraction) and decompose light into two distinct rays of differing velocities.
Coherence: for SHG, this pertains to the phase (temporal and spatial) relationship between the laser excitation and the SH signal, where the coherence length, Lc, is given by 2π/Δk, where Δk = k2ω − 2kω, where k2ω and kω are the wave vectors for the SHG and incident photons, respectively.
Electro-optic modulator, or EOM: a device using the electro-optic effect (i.e., the linear rotation of light in response to an electric field). In a microscope, these are used for polarization and power control.
F/B of SHG: we define this quantity as the measured ratio of forward and backward SHG components in the microscope. It is a convolution of the emitted ratio, which we denote as FSHG/BSHG, and the resulting scattering in the tissue.
FSHG/BSHG: we define this as the SHG creation ratio (i.e., the initially emitted directionality of the SHG before scattering).
First hyperpolarizability, β: the molecular property that governs the macroscopic SHG response.
Glan-laser polarizer (GLP): This type of polarizer is constructed from two back-to-back birefringent prisms with an air space in between. The polarizer is rotated to select the transmission of a desired linear polarization.
Group velocity dispersion (GVD): GVD is the dispersion in velocities of the frequency components of a short laser pulse. It results in temporal broadening of the pulse in an optical material, which arises because the red and blue components have different refractive indices.
Half-wave plate, or λ/2 plate: this optic retards the polarization of light by a half-wavelength, or 180°, and thereby changes the linear polarization direction.
Nondescanned detection: in this optical geometry, the signal in the epidirection is isolated with a dichroic mirror in the infinity space and directed onto the detector. Unlike confocal detection, the desired signal does not pass back through the galvo scanning mirrors and a pinhole.
Second-order nonlinear susceptibility, χ(2): this is the bulk or macroscopic property measured in an experiment and is the orientational average of the first hyperpolarizability, β. It is a measure of the SHG efficiency, and the 27-matrix-element tensor also contains structural information on the structure of the harmonophore.
Nyquist criterion: this principle states that to properly identify a signal, it must be digitally sampled at least twice its frequency. In a microscope, this corresponds to a pixel size of half the diffraction limit.
Optical isolator: this device functions as an optical diode in which light is only transmitted in one direction, and light of all polarizations from the opposite direction is rejected with polarizers.
Pockels cell: an electro-optic modulator in combination with a Glan-laser polarizer; it is used to control power and/or repetition rate. Polarizing beamsplitting cube: this optic is related to a Glan-type polarizer, and it transmits and reflects orthogonal polarizations and can be used to verify polarization states.
Primary filter effect: the loss of laser excitation in the sample as a result of scattering and/or absorption.
Quarter-wave plate, or λ/4 plate: this optic retards the polarization of light by a quarter wavelength and thereby converts light from linear to circular polarization.
Secondary filter effect: the loss of signal in the sample as a result of scattering and/or absorption.
Physical and chemical background
Nonlinear optical response
The total polarization for a material interacting with light can generally be expressed as
| (1) |
where P is the induced polarization, χ(n) is the nth order nonlinear susceptibility tensor and E is the electric field vector30. The first term describes linear absorption, scattering and reflection of light; the second term describes SHG, sum and difference frequency generation; and the third term describes two- and three-photon absorption, third harmonic generation (THG) and stimulated Raman processes and coherent anti-Stokes Raman scattering (CARS). The second-order symmetry of SHG imposes severe restrictions on the harmonophores and their assembly that can be imaged, as the environment must be noncentrosymmetric on the size scale of λSHG; otherwise, the signal will vanish. The susceptibility tensor, χ(2), is a bulk property and is the quantity measured in an experiment. However, the molecular-level property of the nonlinearity, i.e., the first hyperpolarizability, β, forms the basis of the contrast mechanism. This parameter is defined in terms of the permanent dipole moment
| (2) |
The molecular and bulk properties are then related by the following formula:
| (3) |
where Ns is the density of molecules and the brackets denote their orientational average. Thus, harmonophores must have a permanent dipole moment, and, further, for efficient SHG, these must be aligned within the focal volume of the microscope so that χ(2) is nonzero. The primary proteins that meet these requirements are type I and II collagen3 (both form aligned fibers) and myosin within acto-myosin complexes5,31. In contrast, type IV collagen, which is a primary component of the basement membrane (separating the epithelium from the underlying stroma), is not fibrillar in vivo and does not produce sufficient SHG signals for imaging32. Similarly, type III collagen also does not produce imageable SHG contrast33.
SHG emission directionality
SHG is coherent (or quasi-coherent in tissue; see below), meaning that there is a specific emission pattern comprising forward and backward propagating components (with respect to the direction of laser propagation). The nature of these directional components has received important attention in the literature in recent years, and there remains some controversy on the subject. For example, treatments based on fibril size have successfully described the SHG emission pattern from regular tissues such as tendon34, but they have failed to account for the results observed in cornea and sclera20.
To help resolve some of the seemingly disparate results, we presented a more general model of SHG from tissues by considering relaxed phase-matching conditions and showed how these relate to SHG intensity and directionality27. For the limiting case of perfect phase matching, i.e., Δk = k2ω − 2kω = 0, where Δk is the phase mismatch, and k2ω and kω are the wave vectors (2π/λ) for the SHG and incident photons, respectively, the SHG emission is 100% forward directed and co-propagates with the laser. This situation holds for SHG from uniaxial crystals (e.g., potassium dihydrogen phosphate (KDP) and β-barium borate (BBO)) and from interfaces. Although collagen has been described as a nematic liquid crystal35, the inherent randomness and dispersion in real biological tissues results in a distribution of nonzero Δk values. This imperfect phase matching gives rise to a corresponding distribution of forward- and backward-emitted components, and as a result SHG in tissues is best described as quasi-coherent. The phase mismatch also affects the relative SHG intensity, which scales as sin(mΔkL/2), where L is the coherence length and m is an integer. By this relation, we see that the SHG becomes less efficient for larger values of Δk.
We have denoted the emission directionality FSHG/BSHG, wherein this ratio depends on the regularity of the fibril/fiber assembly, and, by using our model, we have described how larger Δk values are associated with direct backward SHG emission. Specifically, structures that are ordered on the size of λSHG in the axial direction will give rise to predominantly forward SHG, whereas the emission from smaller and/or more random structures with larger Δk values will be relatively less forward directed (although FSHG/BSHG ≥1)27. For regular tissues, such as tendon, our theory agrees with previous treatments that were based on fibril size4,34, but we also showed that the alignment must also be considered to properly predict FSHG/BSHG in less-organized tissues11. We stress that this is not the quantity measured in an experiment, which we define as F/B, which consists of the emitted directionality and components arising from forward and backward scattering of the initially emitted photons. The degree of phase mismatch can be exploited to differentiate normal and diseased tissues. For example, we showed that osteogenesis imperfecta tissues were characterized by greater Δk values than the corresponding normal tissues, and by correspondingly lower SHG intensity27. Accordingly, as confirmed by electron microscopy, the diseased tissues have smaller, more randomly organized fibrils and fibers36.
In a tissue imaging experiment, the measured directionality of the SHG signal (F/B) will comprise a convolution of the initially emitted directionality (FSHG/BSHG) and the subsequent scattering of these photons at λSHG. The scattering behavior is governed by the scattering coefficient, μs, and scattering anisotropy, g. The former is a measure of density, where it is the inverse of the distance a photon will propagate before undergoing a scattering collision and change direction, and the latter is the directionality of scattering and is related to tissue organization11. As the measured F/B contains information on FSHG/BSHG and the scattering properties, and because both of these arise from the fibril/fiber assembly, to fully exploit this information the complete SHG microscope needs both forward and backward detection. However, for simple visualization and measurement of fiber lengths and comparison of relative intensities, SHG imaging via the backward channel will often suffice.
Collagen assembly and size scales
The majority of SHG microscopy has been performed on tissues primarily or partially comprising type I collagen (or Col I), which is the most abundant protein in the body. Collagen is a triple-helical molecule (~300 kD) in which the three α-chains are hydrogen-bonded to each other. The individual molecules then are self-assembled covalently into fibrils of diameters of approximately 20–250 nm, which then assemble into fibers having diameters of ~500 nm to several micrometers37. There have been recent efforts to elucidate the molecular source of the SHG from collagen. For example, Schanne-Klein used hyper-Rayleigh scattering measurements to show that the hyperpolarizability, β, arose from coherent amplification of peptide bonds along the length of the molecule38. This finding was consistent with our previous analysis using polarization-resolved measurements, which showed that the nonvanishing matrix elements governing χ(2) are related to the pitch angle (~50 degrees) of the individual α-helices in the collagen molecule39. Other polarization-resolved measurements have now delineated both achiral and chiral components that contribute to the overall signal40,41 and have also begun to show how normal and diseased tissues can be discriminated on the basis of differing matrix elements42.
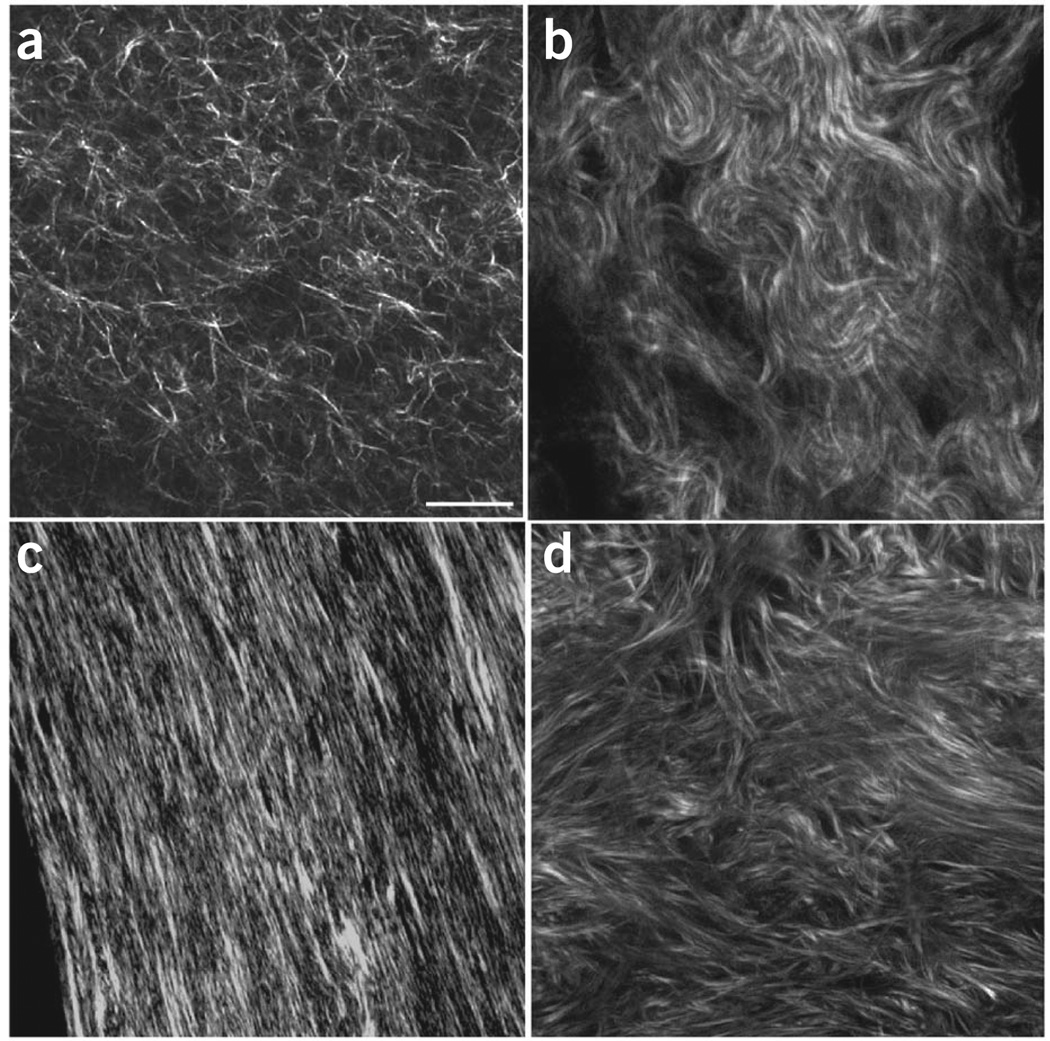
Type I fibrillar collagen has now been imaged by SHG in internal organs (e.g., ovary, liver, kidney and lung), connective tissues (e.g., skin, bone, tendon), blood vessels and cornea (for reviews, see refs. 1–3). A montage of representative tissues is given in Figure 1. Other isoforms such as type II collagen, found predominantly in cartilage, also efficiently produce SHG43–45.
Figure 1.
Montage of SHG imaging of collagen tissues. (a–d) The single optical sections show representative images of self-assembled collagen gel (a); mouse dermis (b); mouse bone (c); and human ovary (d). Scale bar, 30 µm.
Comparison with other methods
Here we provide a comparison of the salient features of SHG with several linear and nonlinear optical microscopy methods, especially with regard to microscope design and detection schemes and information capabilities with respect to collagen organization. The most important points are tabulated in Table 2.
Table 2.
Comparison of nonlinear optical microscopy modalities.
| Method | Primary information | Lasers | Emission direction | Applicability to collagen |
Collagen specificity |
|---|---|---|---|---|---|
| SHG | Structural/assembly | fs Ti:sapphire | F/B tissue dependent | Bulk tissues | Excellent |
| THG | Structural/assembly | oPO, Cr:Forsterite | F/B tissue dependent | Interfaces tissue | Limited |
| CARS | Chemical, mostly C-H lipids | ps + OPO | Primarily forward | Bulk tissues | Limited |
| SRS | Chemical, mostly C-H lipids | ps/fs + OPO | Forward (laser detection) | Bulk tissues | Limited |
| Two-photon | Protein localization | fs Ti:sapphire | 4π | Bulk tissues | Limited |
| OCT | Structural | Broadband | Reflected, interferometric | Bulk tissues | Good |
fs, femtosecond; ps, picosecond; OPO, optical parametric oscillator.
In general, the primary strength of SHG over the more common two-photon excitation fluorescence (TPEF) is the ability to directly visualize protein assemblies without relying on inferences from using exogenous labels, and, further, to extract more structural information through polarization and directional resolved methods27. Although two-photon excited autofluorescence of cross-linked collagen has been observed, this emission spectrum is broad (~450–550 nm) and fairly weak in intensity46. We note that backward SHG and TPEF imaging can be easily implemented in the same laser scanning setup without any additional modifications, except for the addition of appropriate filters46.
THG shares some of the same coherence properties as SHG, wherein the majority of the emission is in the forward direction but it also contains a backward component in the tissue because of imperfect phase matching47. However, THG is restricted to regions in which a large change in refractive index occurs, such as tissue surfaces or interfaces between tissue layers48. We note that longer excitation wavelengths are needed for THG detection, as the red edge of ~1,000 nm of Ti:sapphire excitation results in THG emission (~333 nm) that is difficult to detect with conventional glass optics.
CARS and stimulated Raman scattering (SRS) probe chemically specific bonds and have largely been used for imaging C-H stretches in lipids. These are coherent processes with ideal phase matching in thin specimens and are thus detected in the forward direction49,50. To the best of our knowledge, these Raman processes have not been successful for imaging amides in collagen (and other proteins) because of the low density of these bonds relative to abundant C-H stretches. However, they can be powerful tools for imaging lipids around collagen15.
Finally, we mention that linear techniques of reflectance confocal microscopy and optical coherence tomography (OCT) have also been used to examine collagen assembly. Reflectance confocal microscopy has no molecular specificity but is sensitive to changes in refractive index either on the surface of specimens (e.g., gels or tissues) or at very shallow depths51. OCT is similarly nonspecific to collagen and also arises from changes in refractive index and/or tissue density. In analogy to SHG, OCT polarization–resolved approaches have been used to extract more detailed assembly information52,53. Unlike microscopy techniques, the axial resolution of OCT detection is limited by the bandwidth of the light source and is typically about 10–20 µm.
Limitations
Perhaps the largest limitation of SHG microscopy is its limited applicability to a small number of structural proteins. The landscape of harmonophores that can be imaged by SHG has been established and consists of fibrillar collagen (e.g., types I and II) and acto-myosin complexes within skeletal muscle (not discussed here)39. Microtubule assemblies in live cells, such as centrosomes and mitotic spindles, yield imageable contrast, but at much lower levels5,54. We stress that in this list we are not considering fluorescent probe–based SHG, which uses membrane-staining dyes for contrast; this approach has been used to image membrane potential by several laboratories55–57.
Other limitations of SHG microscopy (which are shared by the other nonlinear optical modalities) are related to the ability to penetrate and image highly scattering tissues. Similar to other nonlinear optical techniques using near-IR excitation (700–1,000 nm), the achievable penetration depths are limited to ~5–10 scattering lengths, or about a few hundred micrometers of thickness (depending on the scattering coefficient of the specific tissue). By using longer wavelength excitation (~1,200 nm), an ~1.5- to 2-fold increase over Ti:sapphire wavelengths can be achieved. We note that the actual limits are different for forward and backward detection schemes. For forward detection, through a combination of experimental and simulation approaches, we have documented that the square of the primary filter effect (i.e., loss of laser intensity) governs the measured intensity response, whereas the secondary filter effect (i.e., loss of the SHG signal) contributes to a lesser extent10,11,29. For the case of detection of backward SHG within highly scattering tissues, the secondary filter can be the limiting factor in signal acquisition. In this geometry, signal photons that are created deep in tissues and then undergo multiple scattering in the backward direction can miss the collection radius of the objective or elsewhere within the microscope. We observed this effect when imaging thick skeletal muscle tissue (several hundred micrometers) in which backward-propagating photons were not detected, whereas the forward signal was still well above the noise floor29. This has relevance for the achievable depth for true in vivo applications, which by necessity will use this collection scheme.
Finally, the polarization analyses used to extract detailed information are limited to fairly superficial regions. Specifically, we have shown that one or two scattering lengths (~20–50 µm) is sufficient to scramble the polarization state of both the excitation laser and the SHG signal in birefringent tissues58,59. To overcome this limit, we have used optical clearing to greatly reduce the scattering coefficient29, and we have demonstrated the retention of polarization signatures through several hundred micrometers of tissue thickness58. Although optical clearing in vivo is not practical at present, this approach affords great insight into tissue structure ex vivo.
Experimental design
Laser and optical layout
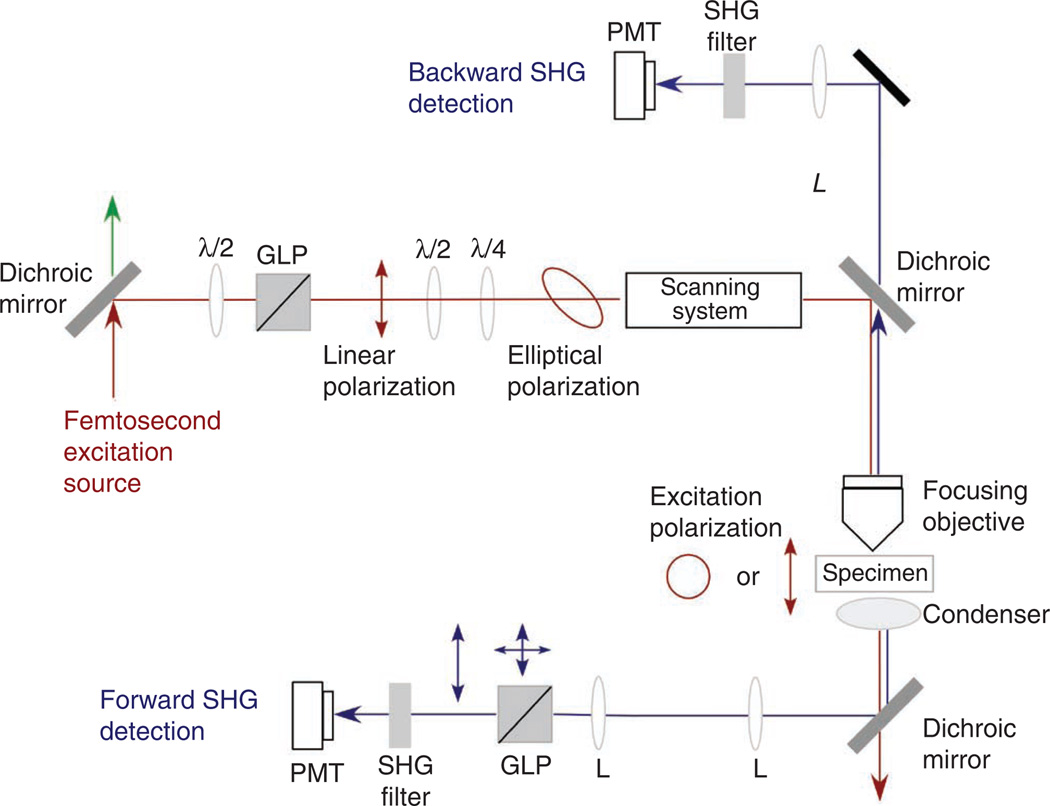
A schematic of the optical layout of the SHG microscope is given in Figure 2. We and others have provided previous descriptions of the overall design5,60. The most commonly used laser for SHG imaging is the Nd:YVO4 (532 nm; 5–18 W) pumped Ti:sapphire oscillator, that has tuning ranges of ~700–1,000 nm, repetition rates of ~80 MHz, average powers of 1–2 W and pulse widths of ~100 fs, which correspond to a bandwidth of about 10 nm full width at half-maximum (FWHM).
Figure 2.
Schematic of the optical layout of the SHG microscope, showing the optical components before the scan head and the detection pathways. L, lens; λ/2 and λ/4 are half- and quarter-wave plates, respectively.
In the simplest interpretation, SHG is not a resonant process, and the choice of excitation wavelength in terms of signal intensity is thus not crucial. More rigorously, β decreases at longer wavelengths30 but large changes are not expected across the Ti:sapphire tuning range. We stress that this holds only for the intensity of the SHG creation process, and not for the measured dependence in thick tissues, which will be convolved with scattering. The spectral dependence of the scattering coefficient arises from the tissue architecture, where a general theory was presented by Backman and co-workers61. We also note that the signal can be resonance enhanced if the SHG excitation wavelength overlaps the twophoton excited autofluorescence band of cross-linked collagen (~720 nm maximum)62. Conversely, longer wavelengths will yield greater penetration depths because of decreased scattering and also avoid autofluorescent absorption bands in tissues. In addition, longer wavelengths result in better cell/tissue viability. On the other hand, lower power is attainable at longer wavelengths (approximately >900 nm), and the range of ~940–970 nm also requires purging the laser cavity with nitrogen. Finally, there is little group velocity dispersion for 100-fs pulses traversing the microscope in this wavelength range, and the resulting width will only increase by ~10–20%. Thus, no external pulse compression is required. For comparison, pulses of comparable temporal width at 800 nm will broaden by ~30–40%. On the basis of these factors, we find that 900-nm excitation is a good compromise between imaging depth, viability and Ti:sapphire performance.
We have found that a short wave pass (SWP) dichroic mirror following the laser is necessary for background-free SHG detection, as residual pump (532 nm) can co-propagate with Ti:sapphire through the entire microscope path to the detectors. An optical isolator (using a Faraday rotator; not shown in Fig. 2) is also required to prevent reflections from upstream optical surfaces, especially from the microscope plane of focus, from entering the laser and annihilating the mode locking. These devices typically provide ~40 dB of isolation, rejecting light of all polarization states. Unfortunately, the working bandwidths are typically ~100 nm, and a single device will not cover the entire Ti:sapphire tuning range of 300 nm. These devices will broaden 100-fs pulses at 700 nm, but do not markedly affect the pulse width at the 900-nm excitation typically used in our measurements.
Finally, because of the relatively long optical path from the laser to the entrance of the microscope (typically ~2–3 m), collimation is needed to correct for the ~1 mrad divergence of the laser. Given a typical laser initial spot size of ~1 mm, the diameter will increase to about 3 mm at the microscope entrance, and it may become clipped on the 3- to 4-mm-diameter galvo mirrors. This collimation is achievable with a 1- to 2-m focal length lens. The properly recollimated beam, upon traversing the pupil transfer lens and tube lens, will then appropriately fill the back aperture of medium- and high-numerical-aperture (NA) objectives to yield the best possible resolution.
Power and polarization control
Owing to the nonlinear dependence of the SHG intensity on laser power, neutral density (ND) filters offer limited dynamic range for power control. An acoustooptic modulator (AOM) can be used by varying the radio frequency (RF) drive power, but these devices are difficult to initially align; it is also difficult to retain the proper alignment from the laser through the microscope. Polarization methods for power control do not deflect the laser beam and present a superior choice for alignment purposes. Moreover, a greater (and continuously variable) dynamic range is achievable relative to either ND filters or AOMs. Polarization-based power adjustment can be achieved through either optical or electro-optical control. In the former, we use a combination of a λ/2 (half-wave) plate and a Glan-laser polarizer (GLP; first set of polarization optics shown in Fig. 2). By fixing the output of the GLP to the desired linear polarization and rotating the angle of the λ/2 plate (either manually or through motion control) relative to the GLP polarization, you are allowed a factor of ~100 in power control, corresponding to a range of 104 in dynamic range of SHG intensity, which is more than sufficient. Zero-order wave plates provide accurate rotation over a bandwidth of ~100 nm. Commercially available electro-optic Pockels cells provide similar performance and can be computer interfaced, but they are considerably more expensive.
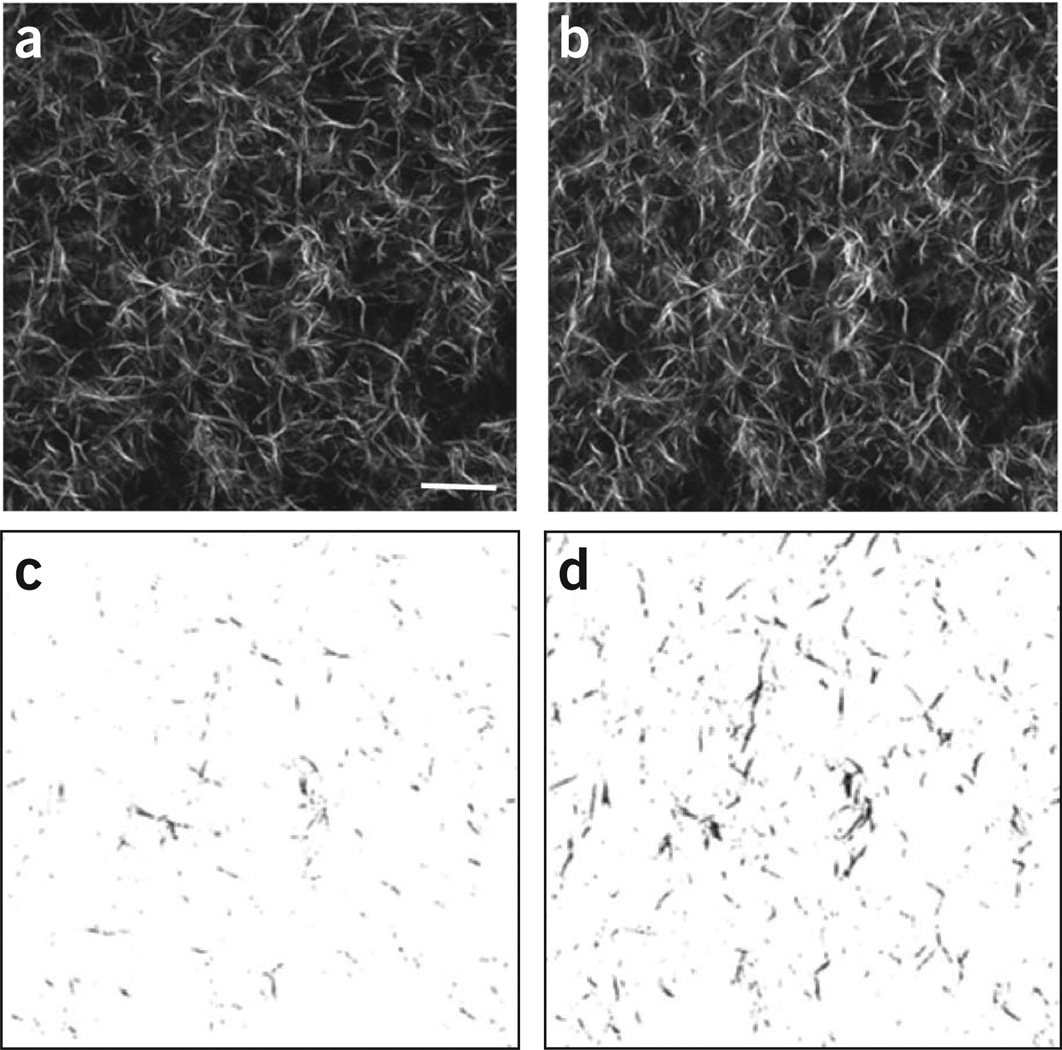
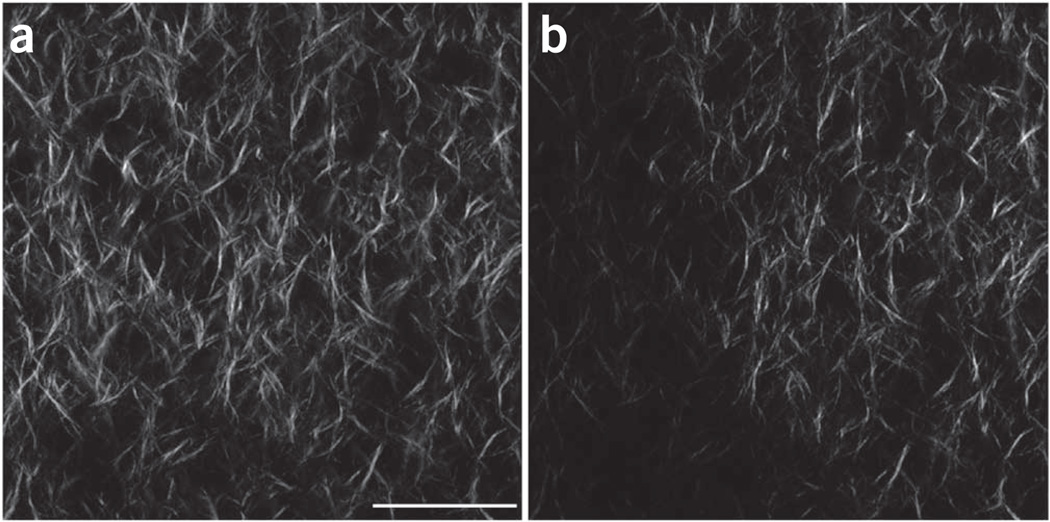
The use of polarization analysis (both excitation and emission) in SHG imaging affords the extraction of tissue structural data, specifically on the fiber packing10. For example, the SHG intensity is highly dependent on the overlap of laser polarization and fiber alignment, and this can be exploited to determine the SHG anisotropy (see ‘SHG polarization microscopy’ for more details; see also Step 36 of the PROCEDURE). On the contrary, it also will discriminate against visualizing orthogonally oriented fibers. We note that these conditions hold in the transverse plane rather than along the axial propagation direction, where little signal is produced because of the electric dipole interaction rules. For non-polarization-resolved SHG imaging, circularly polarized light is preferred as it will excite all orientations equally. To show the effect of using linear versus circular excitation, we imaged self-assembled type I fibrillar collagen gels. Representative images are shown in Figure 3, wherein uniform excitation is achieved in all fiber directions for circular polarization (Fig. 3a). Linear polarization (Fig. 3b) fibers that are parallel to the direction of polarization (vertical here) appear with greater intensity. This is shown more clearly when the images are thresholded (Fig. 3, bottom).
Figure 3.
Comparison of SHG images of self-assembled collagen gels using linear and circular excitation polarization. (a–d) Single optical sections acquired using circular (a) and linear polarization (b), and the resulting respective thresholded images (c and d) show a different distribution of fiber alignment and intensity. We note that these images were acquired with the same excitation power, and the intensities are directly comparable. Scale bar, 20 µm.
We use a combination of two wave plates to achieve circular polarization at the microscope focus, where these are the second set of polarization optics after the laser in Figure 2. Here a zero-order λ/4 (quarter-wave) plate first converts the linear polarization of the laser to circular polarization. However, owing to non-45° reflections in the scanning system, and birefringence and strain in dichroics and other optics, the resulting polarization at the focus will become elliptical. To compensate for this scrambling, a λ/2 plate is placed before the λ/4 plate and functions as a variable retarder by introducing a fixed ellipticity in the opposite direction. This intentional polarization distortion is then corrected upon traversing the optical path of the microscope, resulting in the desired circular polarization at the focus. This condition is found by imaging a specimen with cylindrical symmetry and achieving a ‘ring stain’ (see PROCEDURE Step 21).
Microscope/scanning system
Although many options are available, we use the Olympus Fluoview 300 laser scanning system mounted on an Olympus BX61 upright microscope stand. This scanning/acquisition microscope has a simple optical path and, in our experience, has a higher optical throughput (excitation and emission) than more complex commercial instruments with multiple channels (e.g., four or more). Although the Fluoview has only two channels, this is all that is required for forward-backward SHG imaging. Moreover, it has inputs that allow the use of external, user-defined detectors. Our SHG microscopes are mounted on fixed-stage upright platforms, as this configuration is more convenient for detection of the forward SHG signal. Moreover, this allows the use of long-working-distance water-immersion objectives. Most of the microscope companies now offer dipping lenses over a range of ×20 to ×60, with reasonable NA (~0.5–0.9) with long working distances (e.g., 3 mm for ×40, 0.8 NA), and are optimized for transmission of the near-IR laser excitation. These lenses are ideal for imaging tissues of several hundreds of micrometers in thickness at good spatial resolution. For example, by using subresolution fluorescent beads and TPEF, we have measured the lateral and axial point spread functions at 800 nm of the 0.8-NA lens to be about 700 nm and 2.5 µm laterally and axially, respectively. These values are somewhat higher (~30%) than the theoretical limit, which can be approximated by the Abbe limit over √2 (ref. 63). We stress that because of the coherence, SHG does not have a corresponding point spread function, but we use fluorescence at the same excitation wavelength as an approximation.
SHG forward-backward excitation/collection/detection
To exploit the coherence of SHG and thus extract subresolution feature information, the complete SHG microscope requires both forward and backward collection channels. For quantitative measurements, the relative collection efficiencies need to be calibrated for every objective/condenser combination. Typically, for excitation we use a ×40, 0.8 NA water-immersion objective. Such medium-NA water-immersion lenses have long working distances (1–3 mm) and are ideal for deep tissue imaging. In contrast, many higher-NA lenses have insufficient working distances (~100–200 µm). In addition, at NA > 1, the polarization of the excitation becomes scrambled because of the large angle for the distal rays in the cone, where, for example, at 1.4 NA this is a 30% effect64. Lower NAs can be used, but we find a practical lower limit to be ~0.5 NA. This is because of both the reduced peak power and concomitant reduced SHG intensity and also lower resolution, especially in the axial direction. Thus, for larger fields of view, we prefer to image at a higher NA and then tile frames together. We must also take the SHG emission pattern into account in our design. The forward SHG is emitted in a dual-lobed pattern65, where the angle between these becomes larger at a higher NA. Thus, it is advantageous to use a condenser with somewhat higher NA than the excitation objective, where, for example, for 0.8-NA excitation we use a 0.9-NA air condenser. For highly scattering tissues, oil- or water-immersion condensers may offer increased light-gathering abilities, but this will come at the cost of working distance.
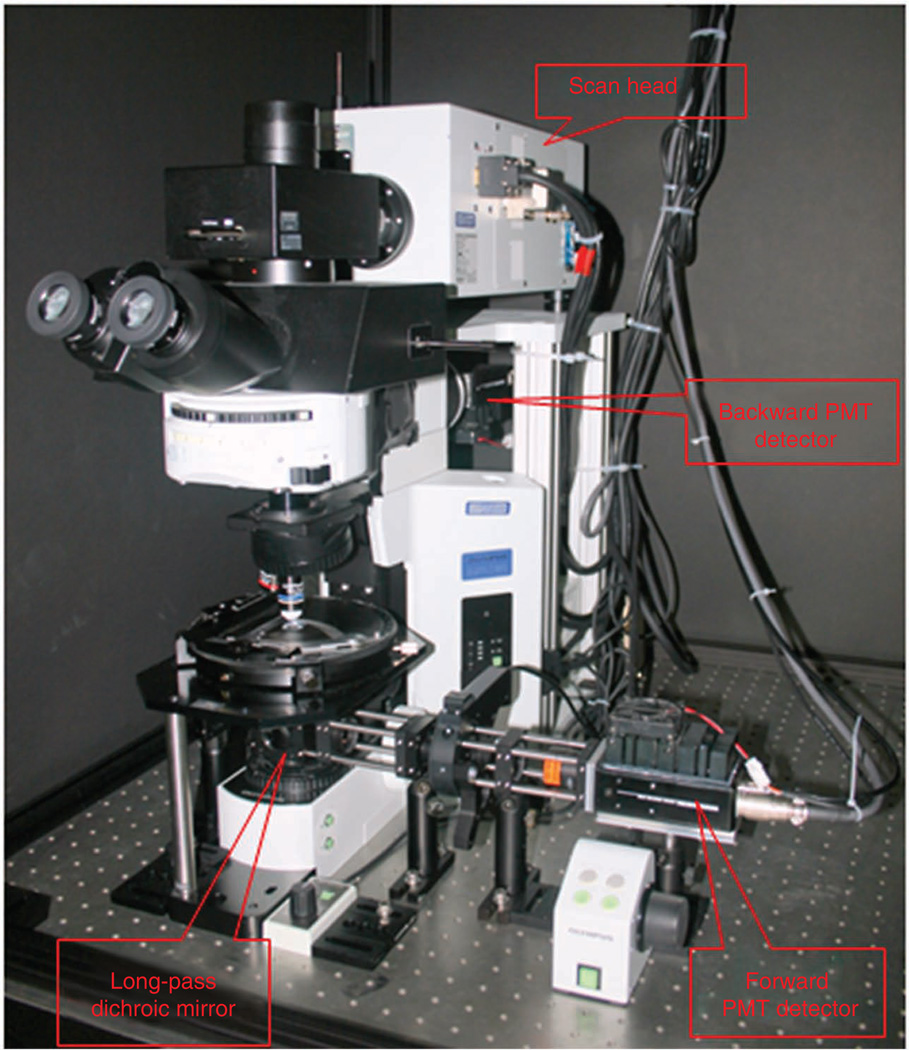
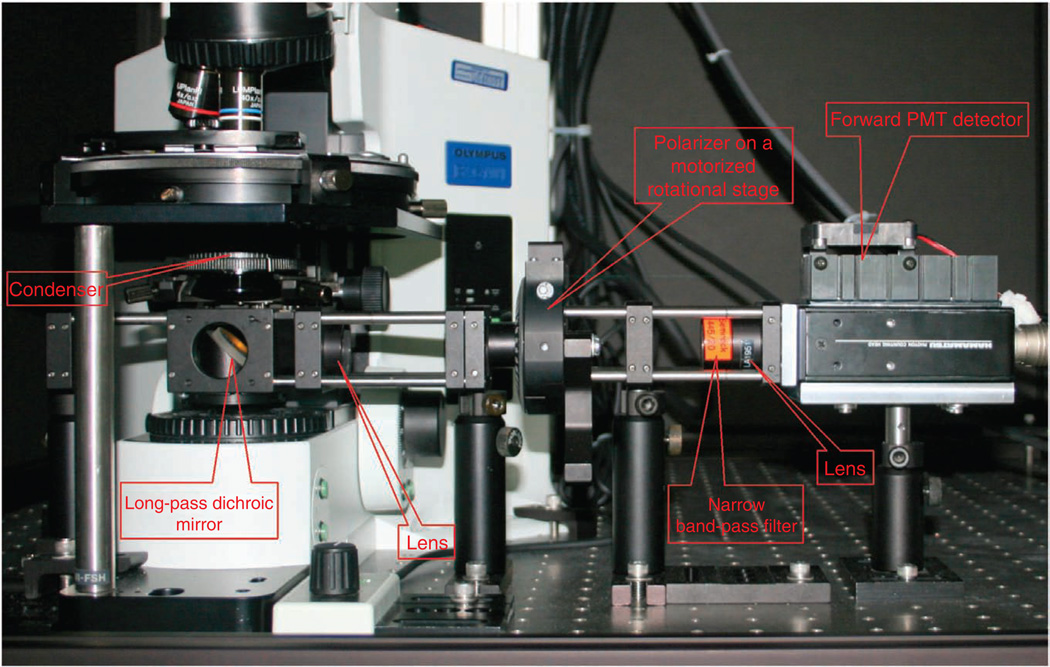
We stress that forward SHG detection is not Kohler illumination, and the height of the condenser is optimized for maximum SHG intensity. A challenge of SHG detection in the forward direction is efficient separation of the signal from the co-propagating laser, which will be several orders of magnitude higher in intensity. For initial separation from the laser, we use a 45° long wave pass (LWP) dichroic mirror (with bandwidth of ~100 nm) that directs the SHG onto the photomultiplier assembly (located as close as possible). The photograph in Figure 4 is annotated to show these components (although the design in this photograph has additional components for the polarization analysis described below). As an alternative, a hard reflector (dielectric or silver) and short-pass filter can be used, but we have found the dichroic approach to provide better separation with higher throughput. The dichroic is mounted on a sliding rail system such that bright-field can be used for focusing the objective. A band-pass filter for the desired SHG wavelength (20 nm FWHM) then provides an additional 4 or 5 optical density (OD) for rejection of the laser. We have found that Semrock filters have the best transmission (~60%).
Figure 4.
Annotated photograph of the upright microscope, detectors and light-tight box.
We use single-photon counting detection in our SHG microscopes, as this provides higher sensitivity than the more conventional analog detection. A possible drawback is the lower dynamic range of digital detection; however, we have not found this to be limiting for SHG imaging. For counting, photomultiplier tubes (PMTs) are run in saturation mode, and individual pulses are preamplified, discriminated and converted into a digital signal. Our microscopes use photon-counting PMT modules (Hamamatsu, 7421), where the GaAsP photocathodes have quantum efficiencies of ~40% for blue wavelengths (400–500 nm) and are ideal for SHG detection. These devices have fixed gain, amplification and discrimination, and output transistor-transistor logic (TTL) pulses (logic level, 0–5 V) that can be plugged directly into the Fluoview inputs used normally for regular PMTs (internal or external). The linearity of this approach needs to be validated for every microscope. We emphasize that, in this scheme, the PMT voltage, gain and offset controls in the Fluoview software are not used, as these parameters are internal to the module. Other high-gain PMTs can also be used in either photon-counting or analog mode but will have somewhat lower sensitivity.
Backward SHG detection requires fewer modifications to a laser scanning microscope. This is most commonly implemented in a nondescanned epigeometry. This setup differs from confocal detection as the desired light does not return along the excitation path, nor is it passed through a pinhole before hitting the PMT. This is because the optical sectioning is intrinsic to the nonlinear excitation, and thus the confocal geometry is not needed. Instead, the SHG signal is isolated before returning to the scan mirrors. This has the key advantage of greatly increased sensitivity over confocal detection in imaging tissue because of two factors. First, scattered photons would miss the confocal pinhole, where nondescanned detection allows the whole area of the PMT to be used. Second, the signal is reflected off fewer surfaces, especially the galvo scanning mirrors, which can have large losses (~20–30% each).
To implement this detection scheme, first the appropriate LWP dichroic for SHG is placed in the infinity space as for conventional fluorescence detection. Next, the arc lamp is replaced with the PMT and band-pass filter, where these are identical to those used for the forward detection. To minimize stray light, we enclose the microscope stand and detectors in light-tight boxes. Weakly focusing lenses are placed before the detectors in both collection channels in order to minimize signal-beam spot size so that it does not exceed the detector input window. See the photographs in Figures 4 and 5 for details on the placement of these components.
Figure 5.
Annotated photograph of the optical setup for the forward polarization-resolved detection.
For quantitative F/B ratio measurements, the relative efficiencies of the two detection pathways, including the detectors, need to be calibrated. This must be done with isotropic emitters and is readily achieved using fluorescent beads or a dye slide. We choose to use two-photon excitation of beads (e.g., 15 µm) labeled with a fluorophore that emits near the SHG wavelengths, as this accounts for any differences in spectral throughput of the two pathways (e.g., different dichroics or filters). If analog detection is used, the same voltage, gain and offset must be used for the actual experiment as was used for calibration. For the case of single-photon counting, the voltage is never changed and the gain and offset in the software control should not be used.
SHG polarization microscopy
Polarization-resolved SHG can be used to extract structural assembly information beyond simple visualization of fiber lengths or by image intensity. This can be in the form of measuring the intensity as a function of laser polarization or analyzing the signal anisotropy for constant linear polarization excitation, where these yield data on the protein helical pitch angle and the dipole alignment angle, respectively5,39,66. In the first measurement, the laser polarization is aligned with the long axis of a collagen fiber(s), and then rotated through 180°, where the intensity of these successive images is recorded. This can be implemented by two methods, which are, in principle, physically equivalent. In the first, the specimen is fixed and the polarization is rotated in the beam path with a λ/2 plate. However, this can lead to errors unless precompensation is used (in analogy to obtaining circular polarization); errors are also more significant at larger scan angles (i.e., lower zoom). The second and more precise method is to place a polarization beamsplitting (PBS) cube in the infinity space to select one linear polarization, and then rotate the specimen with respect to this excitation. This is achieved by replacing the standard stage with a circularly centered stage, as is often used for polarization microscopy.
The second polarization measurement determines the SHG anisotropy, β, which is given as follows:
| (4) |
where Ipar and Iperp correspond to the SHG intensity detected after a GLP oriented parallel and perpendicularly to the laser polarization, respectively. Here the linear polarization of the laser is fixed at 45° relative to the predominant fiber axis (or on a fiber by fiber basis), and then in successive images the SHG parallel and perpendicular components are measured relative to this excitation polarization. This angle is chosen as it corresponds to the largest SHG response39. Note that film polarizers can be used, although the attained polarization purity will be significantly less than that attained by Glan polarizers.
Figure 5 shows a photograph of the optical setup for the forward polarization–resolved detection. Here more space is needed between the isolating dichroic mirror and the PMT than in the nonpolarization-resolved setup described above. As the forward detection scheme is not a Kohler geometry, the light from the condenser is not parallel and rapidly diverges. Thus, a telescope is required for collimation and reduction of the spot size to pass the 10-mm clear aperture of the GLP and be incident on the 6-mm PMT photocathode. By using a 0.8- and 0.9-NA objective and condenser, we use the combination of 200- and 50-mm focal length singlet lenses mounted on a sliding rail system. The PMT assembly is positioned on a translation stage to optimize the detection. The angle of the GLP (also mounted on the rail) relative to the laser can be rotated either manually between the orthogonal polarization states or by mounting it in a motor drive rotation stage under computer control. For backward SHG anisotropy, we use two GLPs oriented in orthogonal directions and place these before the detector; we then collect the images in a manner analogous to that of the forward detection.
Data acquisition
Typical data acquisition parameters for SHG imaging of tissues are given in Table 3. Because of working distance considerations, as well as the double-lobe spatial emission pattern of SHG, medium NA (approximately 0.6–0.8) and magnification (×20 to ×40) are most commonly used for imaging tissues. To satisfy the Nyquist criterion, a minimum of zoom 2 is necessary, which for 0.8-NA ×40 magnification results in a field of view of about 200 × 200 µm, with pixel size of ~0.4 µm for a 512 × 512 field. Correspondingly, for proper axial sampling with this lens, minimum step sizes of ~1 µm are required. Thus, for tissues of ~200 µm in thickness, at 4 µs per pixel, a minimum of ~15 min of acquisition time is required, where this increases with averaging if this is needed for weak and/or noisy signals. We typically use 2–5 averages to achieve good image quality. For polarization-resolved measurements, images are typically acquired at least every 10° of laser polarization, through 180° of rotation. Mechanical stability of the setup is absolutely required for accurate polarization measurements, as a series of images must be acquired from the same optical slice without any axial drift.
Table 3.
Typical acquisition parameters.
| Parameter | Range of values |
|---|---|
| Magnification | ×20 or ×40 |
| NA | 0.5–0.8 |
| Zoom | 2–6 |
| Z-step size | 1–2 µm |
| Field size | 512 × 512 pixels |
| Pixel dwell time | 4–20 µs |
| Number of images | 10–200 |
Specimens
Specimens can be in the form of fixed slides (e.g., sliced with a microtome), or fixed or live tissues cut with a vibratome. For most tissues, with Ti:sapphire excitation (700–1,000 nm), highly scattering tissues of ~200–400 µm in thickness can be imaged throughout their axial extent in both the forward and backward directions. We note that backward detection can be used for morphological assessments in whole-animal imaging, in which the attainable imaging depths will be somewhat smaller because of the lower backward signal intensity. SHG and other nonlinear optical modalities have now been used for imaging of human skin in vivo23,24.
Data analysis
Although commercial laser scanning microscopes have some rudimentary data analysis capabilities, for flexibility we mainly use external software packages. For analysis of the SHG data, we use image math functions such as measuring intensities, thresholding for measuring fiber lengths and division for forward-backward analysis. These can run in ImageJ or Fiji or be automated in MATLAB or LabVIEW. 3D renderings can be performed with commercial packages including Improvision and Imaris. We note that these processes are not specific to SHG but are integral to measuring fiber lengths and their distributions.
MATERIALS
REAGENTS
Fixed samples known to produce SHG
Pollen grain slides for fluorescence and SHG alignment (Carolina Scientific)
Starch granules: homemade
Materials necessary for calibration
Lipid for making vesicles (l-a-phosphatidylcholine, Avanti Polar Lipids) for polarization calibration (these are prepared by a standard procedure67)
Di-8-ANEPPS voltage-sensitive dye (Invitrogen, cat. no. 3167) for staining lipids
-
Fluorescent beads (15 µm) absorbing and emitting at 430 and 465 nm, respectively (FluoSpheres, Invitrogen), for forward-backward calibration.
Note that smaller or larger beads can be used
EQUIPMENT
Newport vibration isolation optical table of dimensions 48 inches × 96 inches. A different vibration isolation table can be used but should be at least 48 inches × 72 inches.
Olympus FluoView 300 laser scanning microscope, or similar
Olympus BX61 fixed-stage upright microscope. A different microscope stand can be used, although a fixed-stage upright platform is preferred for tissue imaging.
Water-immersion objectives (Olympus LUMPlanFL ×40, 0.8 NA and Olympus UmPlanFL ×20, 0.5 NA; Olympus)
 Other objectives can be used, but the NA should be at least 0.5 and the working distance at least 100–200 µm for tissue imaging.
Coherent Verdi 10 Watt Nd:YVO4 laser to pump the Ti:sapphire laser. A different pump laser can be used if compatible with Ti:sapphire.
 Use appropriate eye protection when working with visible lasers.
Coherent MIRA 900-F Ti:sapphire laser, or similar
 Use appropriate eye protection when working with near-infrared lasers.
Electro-optic Technology optical isolator, or similar
Excitation dichroic mirror (Chroma Technologies, DM800/500). A different dichroic mirror can be used, if chosen to match the excitation range
Detection dichroic mirror (CVI LWP T-900-R-400). A different dichroic mirror can be used, if chosen so as to match the excitation range.
Dichroic mirror for separating the Ti:sapphire from residual pump laser (CVI SWP T-00-R-900). A different dichroic mirror can be used, if chosen so as to match the excitation range.
Band-pass filters (Semrock Brightline, 445/20 nm)
 A different band-pass filter chosen to match the laser excitation range can be used but it needs to have the appropriate bandwidth, i.e., 10–20 nm for 100-fs laser pulses.
PBS cube for polarization measurements (CVI PBSH-670-980-100) and polarization calibration. A different PBS cube can be used if it transmits the same wavelengths.
Two zero-order λ/2 wave plates, centered at 870 nm (CVI QWPO-870-10-2) for power and polarization control. A different wave plate can be used, chosen to match the laser excitation range.
Zero-order λ/4 wave plate centered at 870 nm (CVI QWPO-870-10-4). A different band-pass filter can be used, chosen to match the laser excitation range.
Three GLPs for SHG anisotropy, one and two for the forward and backward channels, respectively (CVI PTY-10.0-425-675). A different polarizer can be used, as described in Experimental design.
GLP for laser power control (CVI PTY-10.0-670-1064). A different polarizer can be used, as described in Experimental design.
Pockels Cell (Con-optics, 350; a different Pockels cell can be used or power can be controlled manually as described in Experimental design)
Photomultiplier module (Hamamatsu, 7421)
 A different PMT can be used as described in Experimental design, but GaAsP photocathodes have the best quantum efficiency in this spectral range.
ImageJ or FIJI software (open access, US National Institutes of Health)
MATLAB or LabVIEW software (or similar) for automated analysis
Imaris rendering software, or similar (Bitplane)
Laser power meter (Molectron Powermax, 500AD, or similar)
IR viewer (Electrophysics Electroviewer, cat. no. 7215, or similar)
PROCEDURE
 1–8 describe the initial setup of the microscope. Day-to-day operations are described in Steps 9–36.
General preliminary alignment
 2–4 d
2–4 d
-
1|
Insert the ND filter (>2 OD) at the output of the Ti:sapphire laser for initial alignment purposes. This affords alignment of the laser at safe power.
 Use appropriate eye protection when working with all lasers.
 -
2|
Align the laser through the optical isolator with paper or an IR sensing card or IR viewer.
-
3|
Align the laser into the entrance of the scan head.
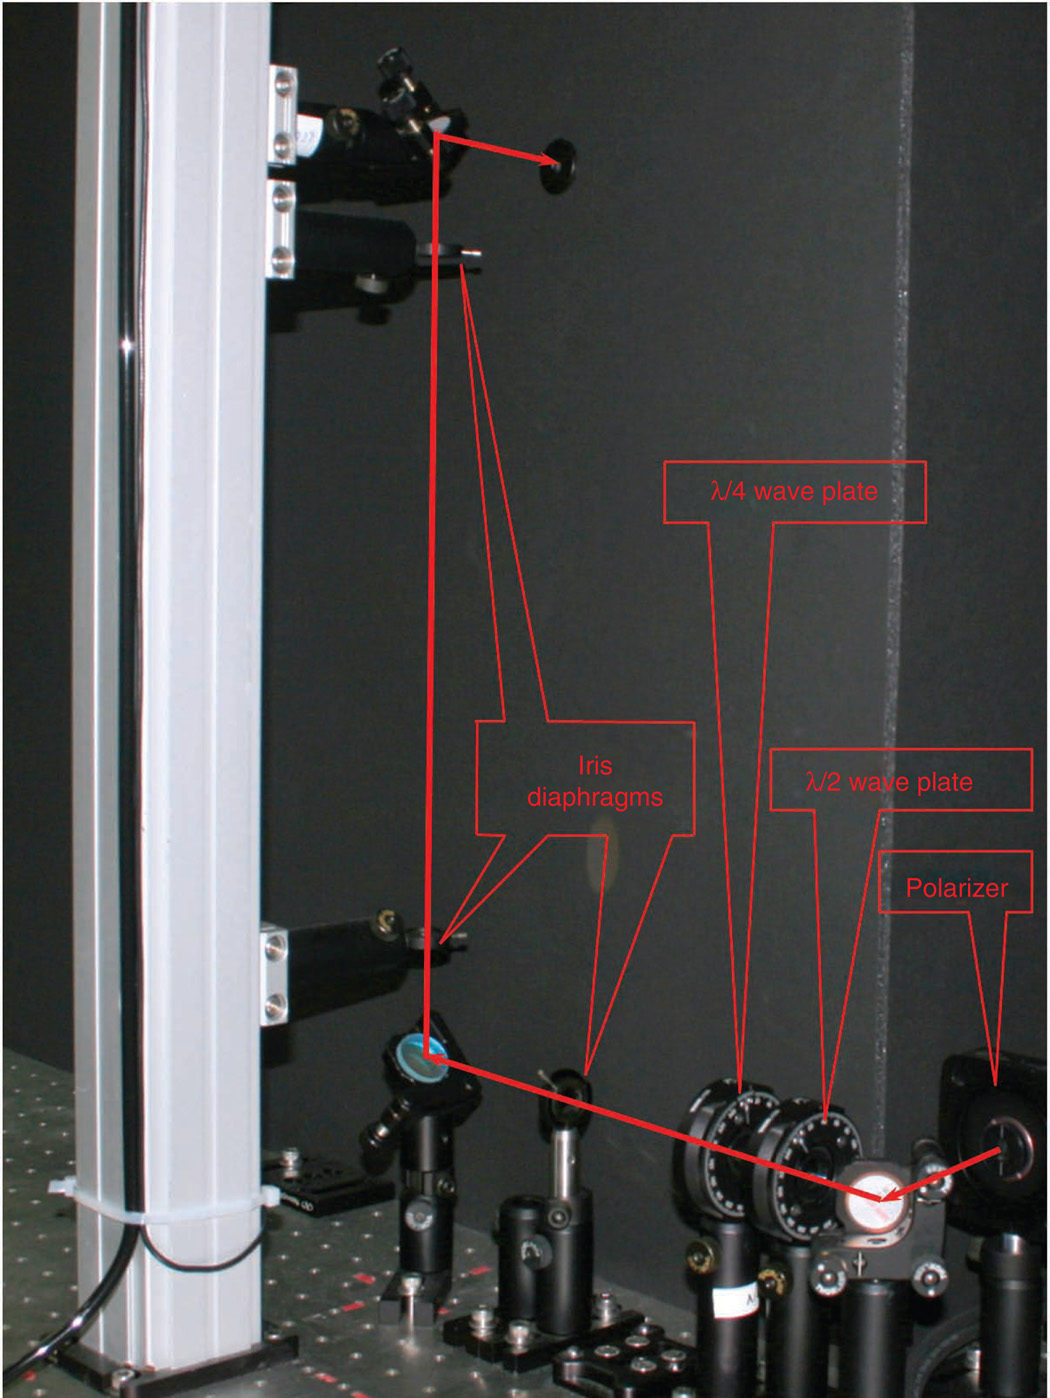
 It is important that the laser enter the scan head parallel in both planes. This is facilitated by placing pairs of apertures in the beam path (Fig. 6).
 -
4|
Use the last turning mirror before the scan head entrance to center the beam at the exit of the objective turret using an empty slot. Note that on some microscopes the instrument may need to be on with the shutter open and scanning for this procedure. In this case, use high digital zoom (~10) for this alignment to essentially park the beam.
-
5|
Insert the long distance focal length lens (1–2 m) in the beam path such that the resulting spot entering the scan head is ~1 mm in diameter. The proper location for the lens between the laser and the scanner will depend on the laser divergence and the distance. The precise location is not crucial, but the back aperture of the objective needs to be filled for best resolution.
-
6|
For power control either follow the manufacturer’s specific instructions for alignment of a Pockels cell or use a λ/2 plate and a GLP (670–1,064 nm). For the latter option, first insert the GLP and the laser power meter and maximize the laser transmission by rotating the angle of the rotation stage. Next, insert the λ/2 plate before the GLP.
-
7|
Remove the ND filter.
-
8|
Adjust the rotation of the λ/2 plate to achieve transmission of 1–10 mW through the GLP.
Figure 6.
Annotated photograph of the optical layout of the laser pathway before the scan head, showing the polarization control optics and the optical rail with apertures used for alignment.
Preliminary image acquisition
 2–4 d
2–4 d
-
9|
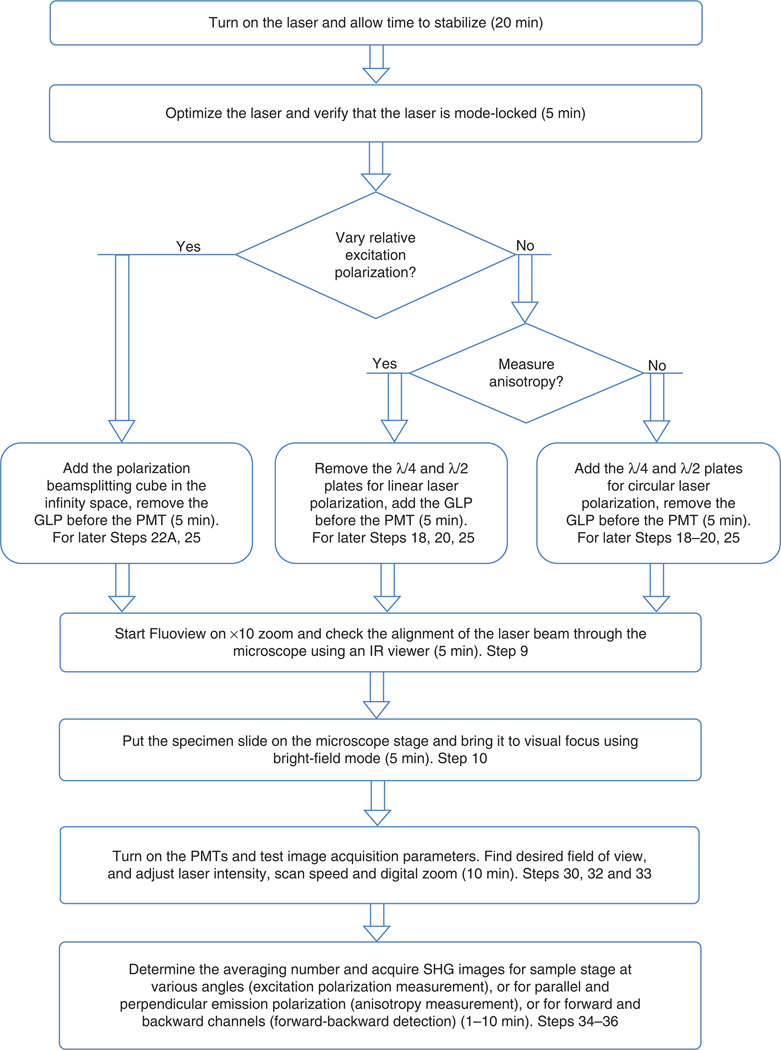
See Figure 7 for a flowchart of the day-to-day alignment and operation outlined in Steps 9–36. The directions in the rounded rectangles are for either insertion or deletion of specific components that must be performed first for subsequent measurements under different polarization conditions. As the power control optics can walk the beam slightly, begin by realigning the laser through the microscope, so that it is centered through an empty slot in the objective turret.
-
10|
Place the specimen on the stage and find the focus with the desired objective in bright–field mode.
-
11|
Turn off the bright-field source.
-
12|
Adjust the condenser height so that it is near the level of the bottom side of the specimen.
 This is not Kohler illumination, and the height of the condenser is crucial in the following alignment.
-
13|
Slide the dichroic mirror under the condenser. Readjust the condenser height so that the laser is centered on the dichroic (using an IR card or IR viewer) and the spot is not larger than the mirror surface.
-
14|
Center the residual laser on the center of the PMT assembly.
-
15|
With approximately 10–50 mW at the output of the objective (assuming 0.8-NA excitation), acquire an SHG image with a known specimen that produces SHG, where for simplicity, these could be fixed objects such as pollen grains or starch granules. First optimize the SHG intensity by adjusting the height of the condenser, and then by adjusting the vertical and horizontal controls on the dichroic mount (Fig. 5). Verify that the field of view at zoom 1, as seen in bright-field, is centered on the PMT. Further verify that the intensity of a given object (e.g., a single pollen grain) is even across the field of view by using the translational stage on the microscope. It may be necessary to iterate the alignment into the microscope, the height of the condenser and the dichroic mirror mount assembly to achieve this condition. Note that the height of the condenser and subsequent alignment must be optimized for every objective.

-
16|
Adjust the power into the microscope such that the full dynamic range of the integrator is used. In the Olympus microscope, this can be determined by looking at the histogram and also using the Hi-Lo feature in the lookup tables, which shows saturated pixels in red.

Figure 7.
Flowchart of the day-to-day operational procedures for typical SHG imaging of tissues with approximate times and corresponding step numbers. Initial setup procedures are given in Steps 1–8.
Circular polarization alignment and calibration
 3–6 d
3–6 d
-
17|
Use a PBS cube to establish the laser polarization before and after the isolator, where this optic transmits and reflects horizontal and vertical polarization, respectively.
-
18|
Insert the λ/4 plate such that there is no optical rotation; this is verified using the PBS cube by observing no change in measured power on the power meter.
-
19|
Rotate the λ/4 plate to obtain circular polarization; this will be achieved by 45° rotation (nominally). By using the power meter, verify this polarization state with the PBS cube, where there will be 50% power reflected and transmitted.
-
20|
Insert the λ/2 plate (acting as a variable retarder) before the λ/4 plate and rotate it so that there is no rotation of the linear polarization; this is again verified using the PBS cube by taking out the λ/4 plate.
-
21|
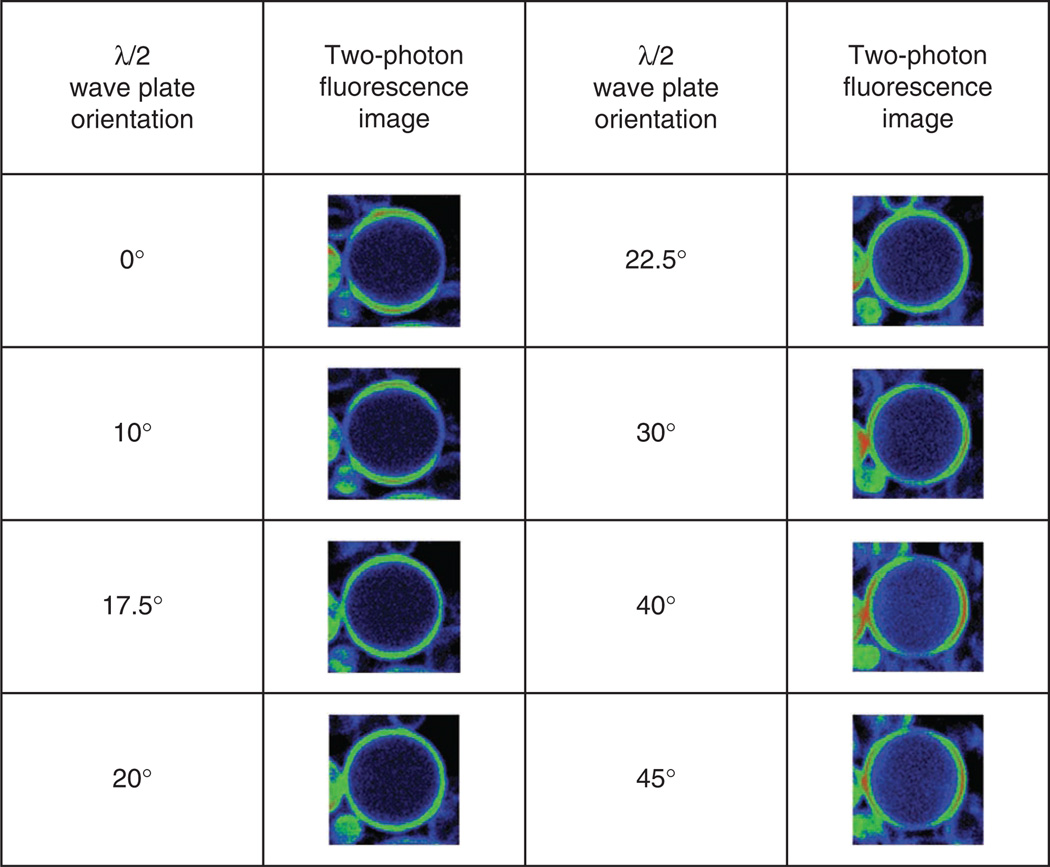
Acquire SHG or TPEF images of giant vesicles labeled with a membrane staining dye. These can be labeled with different membrane staining dyes, but we used the voltage-sensitive Di-8-ANEPPS. While keeping the λ/4 plate fixed, rotate the λ/2 plate until the vesicles show even staining around the perimeter. This is shown in Figure 8 for TPEF images acquired over a range of angles of rotation. We note that with no precompensation with the λ/2 plate (0 degree rotation), circular polarization at the focus is not maintained (the perimeter of the vesicles do not appear even). The proper rotation is at 20°, whereas at 10° and 30° of rotation circular polarization is not achieved. This demonstrates that fairly precise control is required to attain this polarization state at the focus. For a routine check of polarization circularity at a later time, one can use a well-aligned sample such as mouse or rat tail tendon. When the sample is rotated in the focal plane, no change in SHG intensity must be observed across the image.
Figure 8.
Two-photon excited fluorescence images of giant vesicles labeled with the membrane staining dye Di-8-ANEPPS with the rotation of the λ/2 plate. The correct position is at 20 degrees, at which a ring stain is achieved.
Linear polarization selection
 2–4 d
2–4 d
-
22|Selection of linear polarization can be achieved by two methods, wherein option A is more precise than option B. In option A, the specimen is mounted on a circularly centered rotation stage and rotated with respect to a fixed laser polarization. This does not suffer from any birefringence in the optical path that can distort the polarization purity. Further, this can be used at any digital zoom. In option B, the specimen is fixed and the polarization is selected by rotation of the λ/2 plate external to the microscope in the laser excitation path. This can only be used at high zoom (e.g., greater than about 5×) to avoid polarization distortions.
- Selection by rotation of the microscope stage
- Set the λ/2 and λ/4 plates so that there is no rotation when using the PBS cube as described in Step 20.
- Insert a PBS cube into the filter cube in the infinity space.
- Mount the desired specimen on the circularly centered rotation stage and rotate it to acquire images.
- Selection by external λ/2 plate
- Reverse the order of the λ/2 and λ/4 plates.
- With no rotation of the λ/4 plate, choose the desired polarization with the λ/2 plate.
- Verify the polarization at the focus by using the PBS cube.
- Adjust the λ/2 plate until the desired polarization is achieved and acquire images. Note that this approach works best at high zoom (>5), where the scan angle is small, thereby resulting in less ellipticity.
Anisotropy alignment
 2–4 d
2–4 d
-
23|
Choose the desired linear polarization at the focus as described in Steps 17–22.
-
24|
Adjust the position of the detection dichroic mirror as described in Step 13 (see Fig. 5).
-
25|
Center the residual laser on the two collimation lenses. Adjust their positions until the beam is collimated and passes the clear aperture of the GLP.
-
26|
By using the translation stage, approximately center the PMT assembly with respect to the residual laser.
-
27|
Acquire an image of a test object (e.g., pollen grains or starch granules) to optimize the collection path. Note that because of chromatic aberration in the condenser and collimating lenses, the desired SHG may be slightly laterally shifted relative to the laser.
 The height of the condenser is crucial for this alignment, and this optimization must be done for every measurement and for every different objective lens.
Calibration of the forward and backward detection paths
 2–4 d
2–4 d
-
28|
By using sparse fluorescent beads (ensuring no aggregates) emitting near the SHG wavelength, acquire TPEF images in the forward and backward directions. Ensuring single particles is important, as aggregates may not be isotropically emitting and this will lead to incorrect calibration factors.
-
29|
Integrate the resulting fluorescence intensities in ImageJ or FIJI, and then take the ratio of the forward and backward intensities. In our microscope, this gives a forward/backward calibration factor of 1.025 for the ×40, 0.8-NA objective and 0.9-NA condenser.
 If analog detection is used, the PMT settings (voltage, gain and offset) must be exactly the same for the desired measurement as those used in the calibration step. These controls are not used for single-photon counting.
Data acquisition
 1 d
1 d
-
30|
Refer to Table 3 for typical data acquisition parameters.
-
31|
Place the desired specimen on the microscope stage.
-
32|
Set the zoom and axial step size to satisfy the Nyquist criterion for the chosen NA.
-
33|
Take one optical section with the desired zoom to adjust the laser power (Step 6) to optimize the dynamic range of the integration electronics.
-
34|
Use 2–5 averaging if the SHG signal is weak and noisy, as this will eliminate high-frequency noise.
-
35|
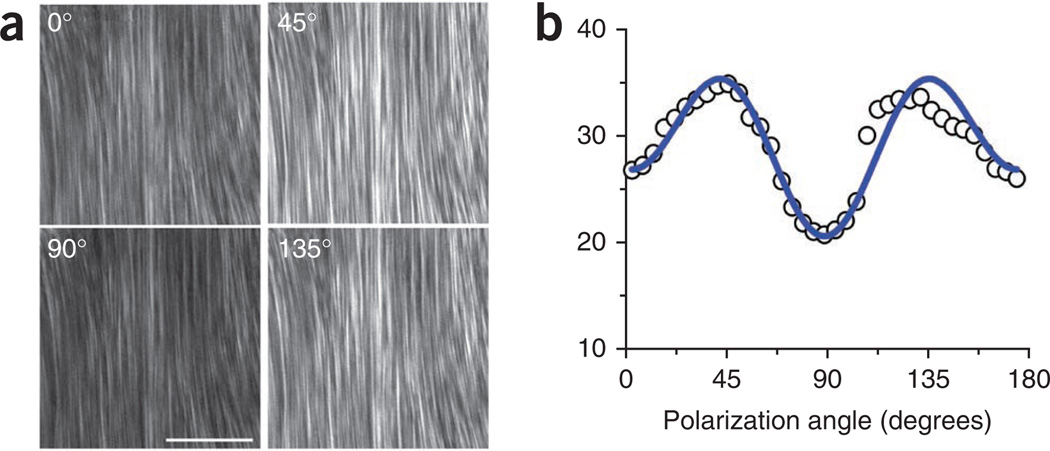
To measure the dependence of the SHG intensity on the laser polarization, either rotate the specimen on the centered stage or by using the external λ/2 plate (Step 22). Acquire images at least every 10° of rotation. Representative images for mouse tendon for several polarizations are shown in Figure 9a, and the resulting plot and fit39 are shown in Figure 9b.
-
36|
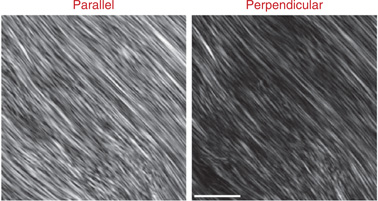
To measure the SHG anisotropy, choose the desired laser polarization (aligned with the fibers of interest), and then take successive images with the GLP oriented parallel and perpendicular to the laser polarization. Representative images for tendon are shown in Figure 10.

Figure 9.
SHG intensity dependence on the laser polarization. (a) Representative images are shown for 0°, 45°, 90° and 135°. Scale bar, 50 µm. (b) The resulting plot and fit39 from optical sections from 37 angles.
Figure 10.
Representative SHG polarization anisotropy images for mouse tendon are shown with the GLP oriented parallel and perpendicular to the laser polarization. The depth into tissue was 17 µm. Scale bar, 15 µm.
Data analysis
 2–3 d
2–3 d
-
37|
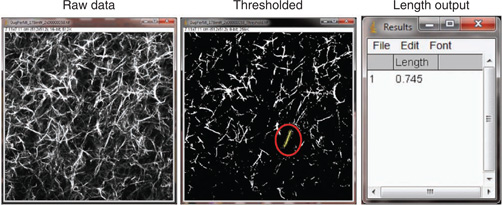
Use ImageJ or FIJI to measure fiber lengths. Use the threshold function to identify fibers and then the freehand tool to determine the lengths. We choose the threshold level on the basis of discrimination of signal from fibrillar collagenous tissues against the background noise. This must be calibrated for the field of view, as ImageJ has an internal pixel-size calibration. Figure 11 shows ImageJ screenshots for the procedure for a single SHG optical section from a self-assembled fibrillar collagen gel, wherein the left and center images are the raw and thresholded images, respectively, and the output of fiber sizes is given on the right.

-
38|
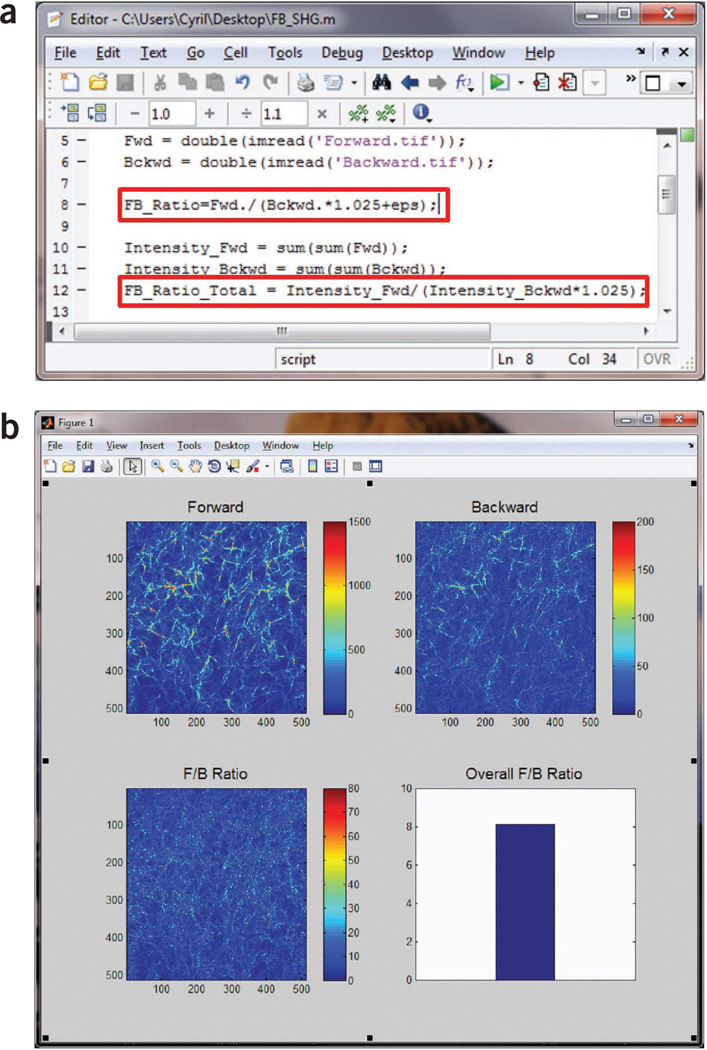
Use MATLAB or ImageJ to calculate the F/B ratio. Add a small offset in image math to avoid division by zero. The F/B can then be calculated for the entire field on a pixel-by-pixel basis and averaged over the field of view. Correct this value with the calibration factor from Steps 28 and 29. See Figure 12 for representative screenshots for the MATLAB script (Fig. 12a), the SHG images (Fig. 12b), the F/B image and the resulting average over the field of view.
-
39|
For attenuation measurements (the relative SHG intensity as a function of depth into the tissue), integrate the intensity over the field of view or region of interest using ImageJ or FIJI. The data for each optical series are self-normalized to the optical section with the average maximum intensity.
Figure 11.
Using ImageJ to measure collagen fiber lengths. Left, raw SHG image; center, thresholded image used to identify fibers. One fiber (in the red circle) is selected and a freehand line (yellow) is drawn on top to measure its length using the Analyze → Measure function. Right, measurement result showing the fiber length in the relative unit of the image (1 unit = 23.9 µm for a field size of 170 × 170 µm).
Figure 12.
Forward-backward analysis of SHG image from a fibrillar collagen gel using MATLAB. (a) Screenshot of the MATLAB script used to calculate F/B ratio pixel by pixel and the overall F/B ratio for the entire field of view. Note the highlighted lines for the calibration factor, 1.025, and the small offset, eps (the floating-point relative accuracy for MATLAB that equals 2− 52), to avoid division by zero. (b) MATLAB output showing the forward and backward SHG images, the calculated F/B ratio image and the overall F/B ratio.

Troubleshooting advice can be found in Table 4.
Table 4.
Troubleshooting table.
| Step | Problem | Possible reason | Solution |
|---|---|---|---|
| 12 | No forward SHG signal | Condenser is closed from bright-field illumination | Open the condenser |
| 15 | Uneven field in forward SHG | Alignment into the scan head is not parallel | Realign using a known specimen |
| 16 | Photodamage of stained specimens | Too much power or too close to two-photon resonance of stain | Lower the power or change the wavelength |
| 36 | Low anisotropy from known high-anisotropy specimen | Angle of GLP relative to the excitation polarization is incorrect | Use a PBS cube after the condenser to verify where the GLP is parallel and perpendicular to the laser polarization |
| 37 | Inconsistent measurements | Background light is reaching the detector | Take background images and subtract |

Steps 1–8, general preliminary alignment: 2–4 d
Steps 9–16, preliminary image acquisition: 2–4 d
Steps 17–21, circular polarization alignment and calibration: 3–6 d
Step 22, linear polarization selection: 2–4 d
Steps 23–27, anisotropy alignment: 2–4 d
Steps 28 and 29, calibration of the forward and backward detection paths: 2–4 d
Steps 30–36, data acquisition: 1 d (See Fig. 7 for a breakdown of the times required for specific measurements)
Steps 37–39, data analysis: 2–3 d
ANTICIPATED RESULTS
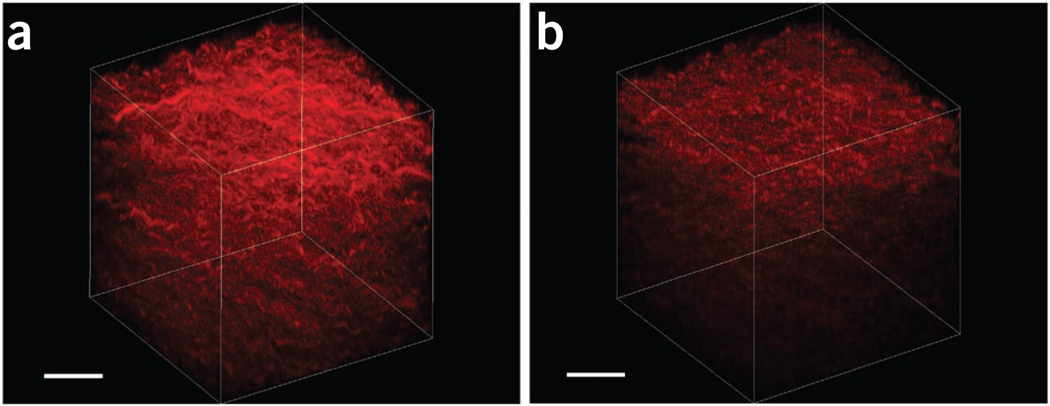
Representative 3D renderings of SHG images from fibrillar collagen gels are provided in Figure 13, showing the respective forward and backward results. The depth-dependent attributes can then be used to determine the F/B ratio as well as the relative attenuation (i.e., the intensity as a function of depth). The renderings were performed with Imaris, although other rendering software programs are available and can be used.
Figure 13.
3D renderings of SHG images of a fibrillar collagen gel. (a,b) The forward and backward results are shown in a and b, respectively. These images are used for calculating forward/backward ratios and attenuation data. Scale bars, 40 µm.
Representative SHG polarization-dependent images and analysis are shown in Figure 9. The data are fit to the model we developed39 and are related to the α-helical pitch angle of collagen. This profile is characteristic of type I collagen, and demonstrates that the polarization of the laser at the focus of the microscope is the desired linear polarization. In contrast, little modulation of the response, a shifted response or asymmetric response would be indicative of polarization scrambling or rotation at the focal plane.
Analogously, representative anisotropy images from tendon are given in Figure 10. Calculating the anisotropy parameter β with equation (4) yielded a value of ~ 0.33. We note that for this regular structure, similar results are obtained by either integrating over the whole field of view or on a pixel-by-pixel basis. These images were acquired at a depth of 17 µm, which corresponds to about one scattering length in the visible/near-UV spectral region29. We note that for a very thin fiber (less than one scattering length), the β value for tendon would approach the limiting value of 1.0, corresponding to complete alignment. However, the anisotropy is rapidly reduced by scattering58,68. Indeed, through optical clearing, which greatly decreased the scattering coefficient, we showed that near-unity values for tendon were obtained58. Tendon is thus an excellent choice of tissue for calibration of SHG polarization anisotropy. If lower anisotropies are obtained than those shown here, it would be indicative of incorrect laser polarization or incorrect polarizer alignment. Finally, Figure 14 shows the importance of the alignment through the polarization analysis path. The left and right panels show properly and misaligned images, respectively, from a self-assembled fibrillar collagen gel. In the latter, the field is not even, and the dichroic mirror (Fig. 5) is misaligned.
Figure 14.
Forward SHG anisotropy images from a fibrillar collagen gel. (a,b) The image in panel a is properly aligned through the microscope and the analyzing Glan-laser polarizer, whereas part of the field is missing in b because the SHG signal does not pass the clear aperture of the polarizer. Scale bar, 40 µm.
Acknowledgments
We gratefully acknowledge support under US National Institutes of Health grant no. CA136590.
Footnotes
AUTHOR CONTRIBUTIONS P.J.C. primarily prepared the manuscript. X.C. constructed the current instrument, acquired the data for the manuscript and developed the analysis scripts; S.P. and O.N. constructed the first instrument; P.J.C., S.P., O.N. and others primarily developed the SHG tissue-imaging protocols.
COMPETING FINANCIAL INTERESTS The authors declare no competing financial interests.
References
- 1.Campagnola PJ, Dong CY. Second harmonic generation microscopy: principles and applications to disease diagnosis. Laser Photonics Rev. 2011;5:13–26. [Google Scholar]
- 2.Campagnola PJ, Loew LM. Second-harmonic imaging microscopy for visualizing biomolecular arrays in cells, tissues and organisms. Nat. Biotechnol. 2003;21:1356–1360. doi: 10.1038/nbt894. [DOI] [PubMed] [Google Scholar]
- 3.Campagnola P. Second harmonic generation imaging microscopy: applications to diseases diagnostics. Anal. Chem. 2011;83:3224–3231. doi: 10.1021/ac1032325. [DOI] [PMC free article] [PubMed] [Google Scholar]
- 4.Zipfel WR, et al. Live tissue intrinsic emission microscopy using multiphoton-excited native fluorescence and second harmonic generation. Proc. Natl. Acad. Sci. USA. 2003;100:7075–7080. doi: 10.1073/pnas.0832308100. [DOI] [PMC free article] [PubMed] [Google Scholar]
- 5.Campagnola PJ, et al. 3-Dimesional high-resolution second harmonic generation imaging of endogenous structural proteins in biological tissues. Biophys. J. 2002;82:493–508. doi: 10.1016/S0006-3495(02)75414-3. [DOI] [PMC free article] [PubMed] [Google Scholar]
- 6.Provenzano PP, et al. Collagen reorganization at the tumor-stromal interface facilitates local invasion. BMC Med. 2006;4:38. doi: 10.1186/1741-7015-4-38. [DOI] [PMC free article] [PubMed] [Google Scholar]
- 7.Conklin MW, et al. Aligned collagen is a prognostic signature for survival in human breast carcinoma. Am. J. Pathol. 2011;178:1221–1232. doi: 10.1016/j.ajpath.2010.11.076. [DOI] [PMC free article] [PubMed] [Google Scholar]
- 8.Sahai E, et al. Simultaneous imaging of GFP, CFP and collagen in tumors in vivo using multiphoton microscopy. BMC Biotechnol. 2005;5:14. doi: 10.1186/1472-6750-5-14. [DOI] [PMC free article] [PubMed] [Google Scholar]
- 9.Kirkpatrick ND, Brewer MA, Utzinger U. Endogenous optical biomarkers of ovarian cancer evaluated with multiphoton microscopy. Cancer Epidemiol. Biomarkers Prev. 2007;16:2048–2057. doi: 10.1158/1055-9965.EPI-07-0009. [DOI] [PubMed] [Google Scholar]
- 10.Nadiarnykh O, Lacomb RB, Brewer MA, Campagnola PJ. Alterations of the extracellular matrix in ovarian cancer studied by Second Harmonic Generation imaging microscopy. BMC Cancer. 2010;10:94. doi: 10.1186/1471-2407-10-94. [DOI] [PMC free article] [PubMed] [Google Scholar]
- 11.Lacomb R, Nadiarnykh O, Campagnola PJ. Quantitative SHG imaging of the diseased state osteogenesis imperfecta: experiment and simulation. Biophys. J. 2008;94:4504–4514. doi: 10.1529/biophysj.107.114405. [DOI] [PMC free article] [PubMed] [Google Scholar]
- 12.Schenke-Layland K, et al. Increased degradation of extracellular matrix structures of lacrimal glands implicated in the pathogenesis of Sjogren's syndrome. Matrix Biol. 2008;27:53–66. doi: 10.1016/j.matbio.2007.07.005. [DOI] [PMC free article] [PubMed] [Google Scholar]
- 13.Strupler M, et al. Second harmonic imaging and scoring of collagen in fibrotic tissues. Opt. Express. 2007;15:4054–4065. doi: 10.1364/oe.15.004054. [DOI] [PubMed] [Google Scholar]
- 14.Sun W, et al. Nonlinear optical microscopy: use of second harmonic generation and two-photon microscopy for automated quantitative liver fibrosis studies. J. Biomed. Opt. 2008;13:064010. doi: 10.1117/1.3041159. [DOI] [PubMed] [Google Scholar]
- 15.Le TT, Langohr IM, Locker MJ, Sturek M, Cheng JX. Label-free molecular imaging of atherosclerotic lesions using multimodal nonlinear optical microscopy. J. Biomed. Opt. 2007;12:054007. doi: 10.1117/1.2795437. [DOI] [PMC free article] [PubMed] [Google Scholar]
- 16.Kwon GP, Schroeder JL, Amar MJ, Remaley AT, Balaban RS. Contribution of macromolecular structure to the retention of low-density lipoprotein at arterial branch points. Circulation. 2008;117:2919–2927. doi: 10.1161/CIRCULATIONAHA.107.754614. [DOI] [PMC free article] [PubMed] [Google Scholar]
- 17.Lin SJ, et al. Evaluating cutaneous photoaging by use of multiphoton fluorescence and second-harmonic generation microscopy. Opt. Lett. 2005;30:2275–2277. doi: 10.1364/ol.30.002275. [DOI] [PubMed] [Google Scholar]
- 18.Lo W, et al. Intact corneal stroma visualization of GFP mouse revealed by multiphoton imaging. Microsc. Res. Tech. 2006;69:973–975. doi: 10.1002/jemt.20373. [DOI] [PubMed] [Google Scholar]
- 19.Ajeti V, et al. Structural changes in mixed Col I/Col V collagen gels probed by SHG microscopy: implications for probing stromal alterations in human breast cancer. Biomed. Opt. Express. 2011;2:2307–2316. doi: 10.1364/BOE.2.002307. [DOI] [PMC free article] [PubMed] [Google Scholar]
- 20.Han M, Giese G, Bille JF. Second harmonic generation imaging of collagen fibrils in cornea and sclera. Opt. Express. 2005;13:5791–5797. doi: 10.1364/opex.13.005791. [DOI] [PubMed] [Google Scholar]
- 21.Lin SJ, et al. Discrimination of basal cell carcinoma from normal dermal stroma by quantitative multiphoton imaging. Opt. Lett. 2006;31:2756–2758. doi: 10.1364/ol.31.002756. [DOI] [PubMed] [Google Scholar]
- 22.Cicchi R, et al. Multidimensional non-linear laser imaging of Basal Cell Carcinoma. Opt. Express. 2007;15:10135–10148. doi: 10.1364/oe.15.010135. [DOI] [PubMed] [Google Scholar]
- 23.Dimitrow E, et al. Sensitivity and specificity of multiphoton laser tomography for in vivo and ex vivo diagnosis of malignant melanoma. J. Invest. Dermatol. 2009;129:1752–1758. doi: 10.1038/jid.2008.439. [DOI] [PubMed] [Google Scholar]
- 24.Chen SY, et al. In vivo virtual biopsy of human skin by using noninvasive higher harmonic generation microscopy. IEEE J. Sel. Top. Quant. Electron. 2010;16:478–492. [Google Scholar]
- 25.Raub CB, et al. Noninvasive assessment of collagen gel microstructure and mechanics using multiphoton microscopy. Biophys. J. 2007;92:2212–2222. doi: 10.1529/biophysj.106.097998. [DOI] [PMC free article] [PubMed] [Google Scholar]
- 26.Mertz J, Moreaux L. Second-harmonic generation by focused excitation of inhomogeneously distributed scatterers. Opt. Commun. 2001;196:325–330. [Google Scholar]
- 27.Lacomb R, Nadiarnykh O, Townsend SS, Campagnola PJ. Phase matching considerations in second harmonic generation from tissues: Effects on emission directionality, conversion efficiency and observed morphology. Opt. Comm. 2008;281:1823–1832. doi: 10.1016/j.optcom.2007.10.040. [DOI] [PMC free article] [PubMed] [Google Scholar]
- 28.Yew EYS, Sheppard CJR. Effects of axial field components on second harmonic generation microscopy. Opt. Express. 2006;14:1167–1174. doi: 10.1364/oe.14.001167. [DOI] [PubMed] [Google Scholar]
- 29.LaComb R, Nadiarnykh O, Carey S, Campagnola PJ. Quantitative SHG imaging and modeling of the optical clearing mechanism in striated muscle and tendon. J. Biomed. Opt. 2008;13:021108. doi: 10.1117/1.2907207. [DOI] [PubMed] [Google Scholar]
- 30.Shen YR. The Principles of Nonlinear Optics. John Wiley and Sons; 1984. [Google Scholar]
- 31.Nucciotti V, et al. Probing myosin structural conformation in vivo by second-harmonic generation microscopy. Proc. Natl. Acad. Sci. USA. 2010;107:7763–7768. doi: 10.1073/pnas.0914782107. [DOI] [PMC free article] [PubMed] [Google Scholar]
- 32.Pena AM, Boulesteix T, Dartigalongue T, Schanne-Klein MC. Chiroptical effects in the second harmonic signal of collagens I and IV. J. Am. Chem. Soc. 2005;127:10314–10322. doi: 10.1021/ja0520969. [DOI] [PubMed] [Google Scholar]
- 33.Cox G, et al. 3-Dimensional imaging of collagen using second harmonic generation. J. Struct. Biol. 2003;141:53–62. doi: 10.1016/s1047-8477(02)00576-2. [DOI] [PubMed] [Google Scholar]
- 34.Williams RM, Zipfel WR, Webb WW. Interpreting second-harmonic generation images of collagen I fibrils. Biophys. J. 2005;88:1377–1386. doi: 10.1529/biophysj.104.047308. [DOI] [PMC free article] [PubMed] [Google Scholar]
- 35.Prockop DJ, Fertala A. The collagen fibril: the almost crystalline structure. J. Struct. Biol. 1998;122:111–118. doi: 10.1006/jsbi.1998.3976. [DOI] [PubMed] [Google Scholar]
- 36.Nadiarnykh O, et al. Second harmonic generation imaging microscopy studies of osteogenesis imperfecta. J. Biomed. Opt. 2007;12:051805. doi: 10.1117/1.2799538. [DOI] [PubMed] [Google Scholar]
- 37.Hulmes DJ. Building collagen molecules, fibrils, and suprafibrillar structures. J. Struct. Biol. 2002;137:2–10. doi: 10.1006/jsbi.2002.4450. [DOI] [PubMed] [Google Scholar]
- 38.Deniset-Besseau A, et al. Measurement of the second-order hyperpolarizability of the collagen triple helix and determination of its physical origin. J. Phys. Chem. B. 2009;113:13437–13445. doi: 10.1021/jp9046837. [DOI] [PubMed] [Google Scholar]
- 39.Plotnikov SV, Millard AC, Campagnola PJ, Mohler WA. Characterization of the myosin-based source for second-harmonic generation from muscle sarcomeres. Biophys. J. 2006;90:693–703. doi: 10.1529/biophysj.105.071555. [DOI] [PMC free article] [PubMed] [Google Scholar]
- 40.Rocha-Mendoza I, et al. Sum frequency vibrational spectroscopy: the molecular origins of the optical second-order nonlinearity of collagen. Biophys. J. 2007;93:4433–4444. doi: 10.1529/biophysj.107.111047. [DOI] [PMC free article] [PubMed] [Google Scholar]
- 41.Su PJ, Chen WL, Chen YF, Dong CY. Determination of collagen nanostructure from second-order susceptibility tensor analysis. Biophys. J. 2011;100:2053–2062. doi: 10.1016/j.bpj.2011.02.015. [DOI] [PMC free article] [PubMed] [Google Scholar]
- 42.Erikson A, Ortegren J, Hompland T, de Lange Davies C, Lindgren M. Quantification of the second-order nonlinear susceptibility of collagen I using a laser scanning microscope. J. Biomed. Opt. 2007;12:044002. doi: 10.1117/1.2772311. [DOI] [PubMed] [Google Scholar]
- 43.Mansfield JC, Winlove CP, Moger J, Matcher SJ. Collagen fiber arrangement in normal and diseased cartilage studied by polarization sensitive nonlinear microscopy. J. Biomed. Opt. 2008;13:044020. doi: 10.1117/1.2950318. [DOI] [PubMed] [Google Scholar]
- 44.Brockbank KG, et al. Quantitative second harmonic generation imaging of cartilage damage. Cell Tissue Bank. 2008;9:299–307. doi: 10.1007/s10561-008-9070-7. [DOI] [PubMed] [Google Scholar]
- 45.Lilledahl MB, Pierce DM, Ricken T, Holzapfel GA, Davies Cde L. Structural analysis of articular cartilage using multiphoton microscopy: input for biomechanical modeling. IEEE Trans. Med. Imaging. 2011;30:1635–1648. doi: 10.1109/TMI.2011.2139222. [DOI] [PubMed] [Google Scholar]
- 46.Zoumi A, Yeh A, Tromberg BJ. Imaging cells and extracellular matrix in vivo by using second-harmonic generation and two-photon excited fluorescence. Proc. Natl. Acad. Sci. USA. 2002;99:11014–11019. doi: 10.1073/pnas.172368799. [DOI] [PMC free article] [PubMed] [Google Scholar]
- 47.Debarre D, Olivier N, Beaurepaire E. Signal epidetection in third-harmonic generation microscopy of turbid media. Opt. Express. 2007;15:8913–8924. doi: 10.1364/oe.15.008913. [DOI] [PubMed] [Google Scholar]
- 48.Muller M, Squier JA, Wilson T, Brakenhoff G. 3D microscopy of transparent objects using third-harmonic generation. J. Microsc. 1998;191:266–272. doi: 10.1046/j.1365-2818.1998.00399.x. [DOI] [PubMed] [Google Scholar]
- 49.Cheng JX, Book LD, Xie XS. Polarization coherent anti-Stokes Raman scattering microscopy. Opt. Lett. 2001;26:1341–1343. doi: 10.1364/ol.26.001341. [DOI] [PubMed] [Google Scholar]
- 50.Freudiger CW, et al. Label-free biomedical imaging with high sensitivity by stimulated Raman scattering microscopy. Science. 2008;322:1857–1861. doi: 10.1126/science.1165758. [DOI] [PMC free article] [PubMed] [Google Scholar]
- 51.Wu J, et al. Automated quantification and reconstruction of collagen matrix from 3D confocal datasets. J. Microsc. 2003;210:158–165. doi: 10.1046/j.1365-2818.2003.01191.x. [DOI] [PubMed] [Google Scholar]
- 52.Brezinski ME, et al. Correlation of collagen organization with polarization sensitive imaging of in vitro cartilage: Implications for osteoarthritis. J. Rheumatol. 2001;28:1311–1318. [PubMed] [Google Scholar]
- 53.Liu B, et al. Characterizing of tissue microstructure with single-detector polarization-sensitive optical coherence tomography. Appl. Opt. 2006;45:4464–4479. doi: 10.1364/ao.45.004464. [DOI] [PubMed] [Google Scholar]
- 54.Dombeck DA, et al. Uniform polarity microtubule assemblies imaged in native brain tissue by second-harmonic generation microscopy. Proc. Natl. Acad. Sci. USA. 2003;100:7081–7086. doi: 10.1073/pnas.0731953100. [DOI] [PMC free article] [PubMed] [Google Scholar]
- 55.Millard AC, Jin L, Lewis A, Loew LM. Direct measurement of the voltage sensitivity of second-harmonic generation from a membrane dye in patch-clamped cells. Opt. Lett. 2003;28:1221–1223. doi: 10.1364/ol.28.001221. [DOI] [PubMed] [Google Scholar]
- 56.Dombeck DA, Blanchard-Desce M, Webb WW. Optical recording of action potentials with second-harmonic generation microscopy. J. Neurosci. 2004;24:999–1003. doi: 10.1523/JNEUROSCI.4840-03.2004. [DOI] [PMC free article] [PubMed] [Google Scholar]
- 57.Nuriya M, Jiang J, Nemet B, Eisenthal KB, Yuste R. Imaging membrane potential in dendritic spines. Proc. Natl. Acad. Sci. USA. 2006;103:786–790. doi: 10.1073/pnas.0510092103. [DOI] [PMC free article] [PubMed] [Google Scholar]
- 58.Nadiarnykh O, Campagnola PJ. Retention of polarization signatures in SHG microscopy of scattering tissues through optical clearing. Opt. Express. 2009;17:5794–5806. doi: 10.1364/oe.17.005794. [DOI] [PMC free article] [PubMed] [Google Scholar]
- 59.Stoller P, Kim B-M, Rubinchik AM, Reiser KM, Da Silva LB. Polarization-dependent optical second-harmonic imaging of a rat-tail tendon. J. Biomed. Opt. 2001;7:205–214. doi: 10.1117/1.1431967. [DOI] [PubMed] [Google Scholar]
- 60.Nikolenko V, Nemet B, Yuste R. A two-photon and second-harmonic microscope. Methods. 2003;30:3–15. doi: 10.1016/s1046-2023(03)00003-3. [DOI] [PubMed] [Google Scholar]
- 61.Rogers JD, Capoglu IR, Backman V. Nonscalar elastic light scattering from continuous random media in the Born approximation. Opt. Lett. 2009;34:1891–1893. doi: 10.1364/ol.34.001891. [DOI] [PMC free article] [PubMed] [Google Scholar]
- 62.Yeh AT, Nassif N, Zoumi A, Tromberg BJ. Selective corneal imaging using combined second-harmonic generation and two-photon excited fluorescence. Opt. Lett. 2002;27:2082–2084. doi: 10.1364/ol.27.002082. [DOI] [PubMed] [Google Scholar]
- 63.Cox G, Sheppard CJ. Practical limits of resolution in confocal and non-linear microscopy. Microsc. Res. Tech. 2004;63:18–22. doi: 10.1002/jemt.10423. [DOI] [PubMed] [Google Scholar]
- 64.Axelrod D. Carbocyanine dye orientation in red cell membrane studied by microscopic fluorescence polarization. Biophys. J. 1979;26:557–573. doi: 10.1016/S0006-3495(79)85271-6. [DOI] [PMC free article] [PubMed] [Google Scholar]
- 65.Moreaux L, Sandre O, Charpak S, Blanchard-Desce M, Mertz J. Coherent scattering in multi-harmonic light microscopy. Biophys. J. 2001;80:1568–1574. doi: 10.1016/S0006-3495(01)76129-2. [DOI] [PMC free article] [PubMed] [Google Scholar]
- 66.Chu S-W, et al. Studies of (2)/(3) tensors in submicron-scaled bio-tissues by polarization harmonics optical microscopy. Biophys. J. 2004;86:3914–3922. doi: 10.1529/biophysj.103.034595. [DOI] [PMC free article] [PubMed] [Google Scholar]
- 67.Sandre O, Moreaux L, Brochard-Wyart F. Dynamics of transient pores in stretched vesicles. Proc. Natl. Acad. Sci. USA. 1999;96:10591–10596. doi: 10.1073/pnas.96.19.10591. [DOI] [PMC free article] [PubMed] [Google Scholar]
- 68.Gusachenko I, Latour G, Schanne-Klein MC. Polarization-resolved second harmonic microscopy in anisotropic thick tissues. Opt. Express. 2010;18:19339–19352. doi: 10.1364/OE.18.019339. [DOI] [PubMed] [Google Scholar]


