Abstract
Objectives
The effectiveness of the active humidification systems (AHS) in patients already weaned from mechanical ventilation and with an artificial airway has not been very well described. The objective of this study was to evaluate the performance of an AHS in chronically tracheostomized and spontaneously breathing patients.
Methods
Measurements were quantified at three levels of temperature (T°) of the AHS: level I, low; level II, middle; and level III, high and at different flow levels (20 to 60 L/minute). Statistical analysis of repeated measurements was performed using analysis of variance and significance was set at a P<0.05.
Results
While the lowest temperature setting (level I) did not condition gas to the minimum recommended values for any of the flows that were used, the medium temperature setting (level II) only conditioned gas with flows of 20 and 30 L/minute. Finally, at the highest temperature setting (level III), every flow reached the minimum absolute humidity (AH) recommended of 30 mg/L.
Conclusion
According to our results, to obtain appropiate relative humidity, AH and T° of gas one should have a device that maintains water T° at least at 53℃ for flows between 20 and 30 L/m, or at T° of 61℃ at any flow rate.
Keywords: Tracheostomy, Respiratory Therapy, Patient Care, Oxygen Inhalation Therapy, Ventilator Weaning
INTRODUCTION
The upper airway is the area of the respiratory system responsible for the conditioning of inhaled gas by providing humidification, heating and filtration. Gas reaches 100% relative humidity (RH) and 29℃-32℃ of temperature (T°) after passing through the nasopharynx. Gas T° is 32℃-34℃ and its RH is 100% at the level of the carina. Finally, at the alveolar level, gas reaches 37℃ of T°, 100% of RH and contains 43.9 mg/L of absolute humidity (AH) [1].
The point at which gases reach the alveolar conditions is known as the isothermic saturation boundary (ISB), and usually resides between the fourth and fifth generation of subsegmental bronchi.
With the insertion of an artificial airway, the nasopharyngeal function of conditioning the inhaled gas is bypassed, and the ISB is shifted further down to a zone of the respiratory tract not very well designed to properly condition the inhaled gases. This situation is provided by the fact that medical gases have less moisture than the environmental air [2].
Inadequate humidification of inhaled gas increases the risk of atelectasis, enhances the airway resistance, and promotes a greater incidence of infections, a harder respiratory load, and thickening of airway secretions and destruction of airway epithelium. The slowing down of ciliary activity is a consequence of mucous membrane functional disturbance, and it appears within three hours of mechanical ventilation with gases carrying an AH lower than 25 mg/L [2,3].
The American Association for Respiratory Care recommends that the gas delivered by an artificial airway should have between 31℃ and 35℃ of T°, 100% of RH and with a mimimum AH of 30 mg/L [4,5]. These requirements may be achieved by using active humidification systems (AHS) or heated and moisture exchangers (HME), also known as "artificial noses". The HMEs act as the upper airway tract by collecting the heat and moisture exhaled by the patient, which will later be used to condition the inhaled gas [6]. The effectiveness of HMEs is related to tidal volume, inspiratory time, minute volume, and body T° [1]. HMEs increase dead space and resistance in the airway. Resistance is further increased by the presence of dried secretions, the viral-bacterian filter and/or moisture surplus. These changes may negatively impact weaning from mechanical ventilation, especially in those patients with poor muscular mass [1,7,8,9,10,11]. The addition of dead space in spontaneous ventilation may cause an increase of pCO2 and work of breathing [1,12,13,14,15]. Contraindications to the use of HMEs include patients with bronchorrhea, very high or very low tidal volume, bleeding in the airways, dehydration, and hypothermia [16].
AHS add moisture and heat to the inhaled gas in an active way [6]. This system is recommended for patients with a minute ventilation higher than 10 L/minute, or in patients with contraindications to the use of HMEs [7]. Complications associated with its use may include airway burns, decreased hydration and dryness of secretions, increased resistance, excessive condensation of water in the tubing, which may cause a higher risk of infection and contamination of the liquid when filling the chamber.
Chanques et al. [17] tested two different humidification systems, AHS vs. Bubble Humidifier (BH). They evaluated both the level of comfort in patients without an artificial airway and the laboratory performance of these systems using flows of 3, 6, 9, 12, and 15 L/minute. Patients showed higher discomfort (dry mouth and throat) with BH than with AHS. In the laboratory, AHS reached 34.1℃ of T°, RH 77.6% and AH 29.7 mg/L, while BH reached 26.7℃ of T°, RH 60.7% and AH 15.6 mg/L.
Considering the contraindications to the use of HMEs, and the need of conditioning the inhaled gas in patients with an artificial airway who no longer require mechanical ventilation, we decided to study if AHS is a good humidification and heating alternative for these patients.
The objective of this study was to evalute the efficiency of AHS, in terms of RH, T°, and AH of delivered gas, in a laboratory environment.
MATERIALS AND METHODS
This study was carried out at the Basilea Neurological, Orthopaedic and Respiratory Rehabilitation Clinic, in Buenos Aires, Argentina, from January 29th through February 25th, 2008.
Setting
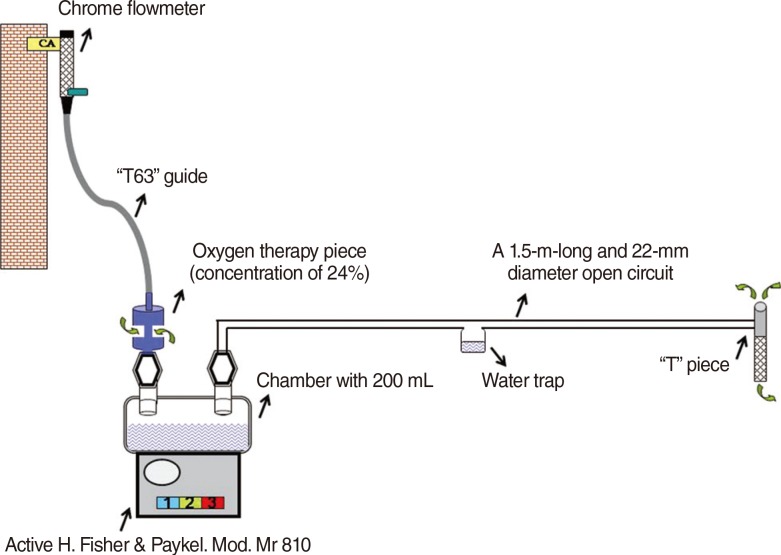
A 1.5-m-long and 22-mm diameter open circuit with a concentric lid was created. One end of the tubing was connected to an inflow of the open circuit chamber. A "T" piece was connected to the other end of the tubing. Then, the active heater chamber was filled with 200 mL of distilled water and the AHS was switched on. Later, the flowmeter was opened, and the oxygen therapy piece was connected with the "T63 guide" to obtain the desired flows of 20, 30, 40, 50, and 60 L/minute. Three levels of temperature were set: level I (low), level II (middle), and level III (high). They were compared at different flows (20 to 60 L/minute) (Fig. 1).
Fig. 1.
The components and assembly of active humidification system for the study. CA, compressed air.
Measurements
These temperature settings were measured at different flows over 5 days. A total of 1995 measurements and 300 calculations were carried out during eighteen 10-hour work days. It took three days to quantify values of water temperature without gas flow (T° water/flow) for each of the three levels of the equipment. Measurements were performed using the OHMEDA 5420 VOLUME monitor (Boc Healthcarem, Manchester, UK); Thermohygrometer Testo 605-H1 (Testo AG, Ciudad Autónoma de Buenos Aires, Argentina), AHS MR810 (Fisher & Paykel Healthcare, East Tamaki, New Zealand); Mercury Thermometer [-10℃/110℃] (Luft, Germany); 1.5-m-long, 22-mm-diameter tubing with water trap; Chrome Flowmeter Precision Medical (Precision Medical, Northampton, UK); oxygen therapy piece 24%. The gas used for the study was compressed air. These measured and calculated variables are described in Table 1.
Table 1.
Abbreviation and description of the measured and calculated variables
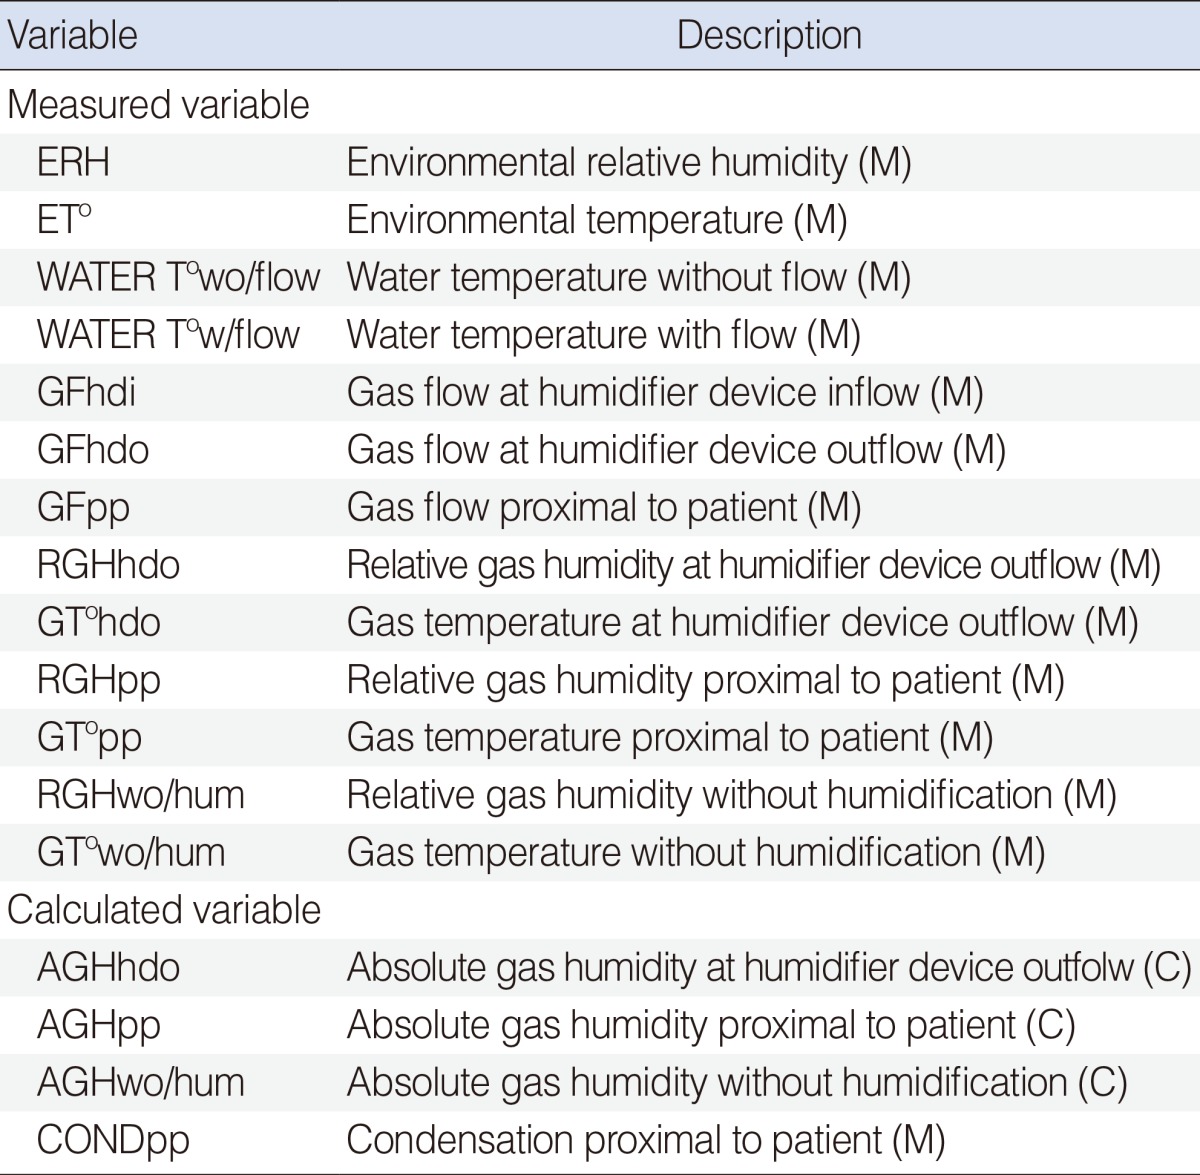
AH was calculated according to the following formula: AH=216.9 ×vapor pressure (VP)/T°. Where AH was absolute humidity, VP was water vapor pressure in millibars, 216.9 was a constant and T° is the gas termperature in Kelvin. Water vapor pressure was based on gas T° according to the values stated by bibliography [18].
The obtained data was included in a table for compilation and further analysis. Environmental temperature and environmental relative humidity (EHR) of the laboratory were measured with a thermohygrometer over a period of two minutes so that the values could reach a plateau. Relative gas humidity without humidification (RGHwo/hum) and gas temperature without humidification (GT°wo/hum) were measured by using a thermohygrometer over two minutes. The maximum water temperature reached at each of the 3 (three) AHS temperature levels, with (water temperature with flow, WATER T°w/flow) and without gas current flow, was quantified. In order to quantify this temperature, a 400-mL capacity chamber was filled with 200 mL of distilled water. A mercury thermometer was dipped into the distilled water to half its depth, avoiding contact with the base of the chamber. The setup was changed at each preset temperature level and the WATER T°w/flow was recorded once every hour during ten hours. A similar procedure was repeated for the other two temperature levels.
Gas flow was measured at the inflow (GFhdi) and outflow (GFhdo) of the humidifier device.
Flow at the distal end of the tubing, i.e., proximal to the patient (GFpp) was measured using a Ventilometer Ohmeda 5420. Flows were measured in the following way: we connected one end of the "T63" guide to the flowmeter for central compressed air. On the other end we adapted an oxygen therapy piece to concentrations of 24%. We connected the oxygen therapy piece to the ventilometer and the latter to the humidification chamber. We gradually increased the flow from the flowmeter until the final flow, measured by the ventilometer, reached the desired values. The original outflow from the flowmeter (between 1.5 and 6 L/minute) changed to 20, 30, 40, 50, and 60 L/minute according to the Bernoulli's Principle and the Venturi effect.
A Thermohygrometer Testo 605-H1 was used to measure temperature and relative gas humidity of the humifier device outflow (GFhdo and RGHhdo). We added an adaptor piece to the gas outflow of the chamber and tubing was attached to the other end of the piece. Therefore, the adaptor piece was between the water chamber and the tubing.
A Thermohygrometer Testo 605-H1 was used to measure Temperature and RH proximal to the patient, i.e., delivered to a patient (GT°pp and RGHpp). The Thermohygrometer was placed at the end of the tubing and before the "T" piece to obtain measurements over a two-minute period.
Condensation proximal to the patient was evaluated through observation once an hour. Distilled water was poured into the chamber up to 200 mL once every hour, and after each measurement was completed.
Analysis
An analysis of variance (ANOVA) test was used to perform the statistical analysis for repeated measurements with post hoc test, Normality test, multiple linear regression test and Student t-test. We considered the p value of <0.05 as significant.
RESULTS
A total of 1995 measurements and 300 calculations were carried out for the 3 levels of temperature of the AHS and for the 5 levels of flows that were studied.
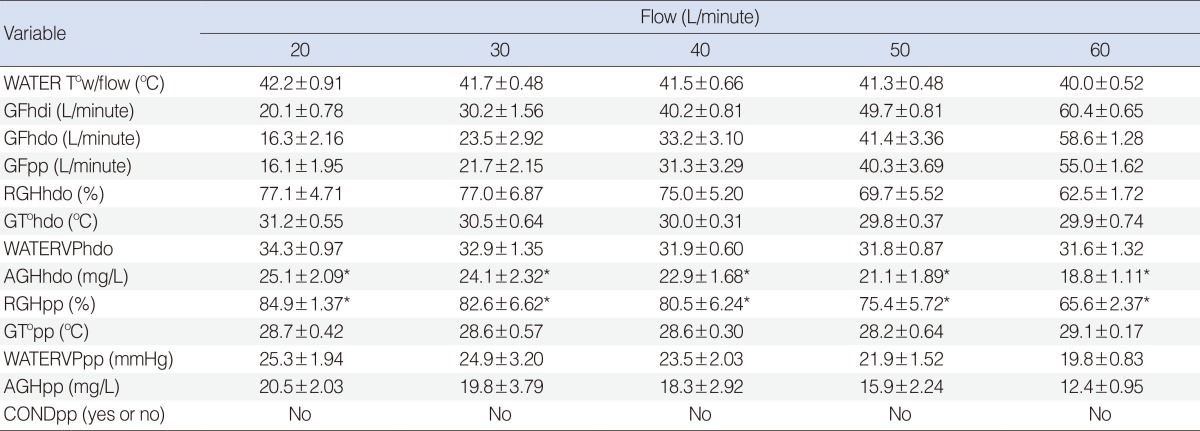
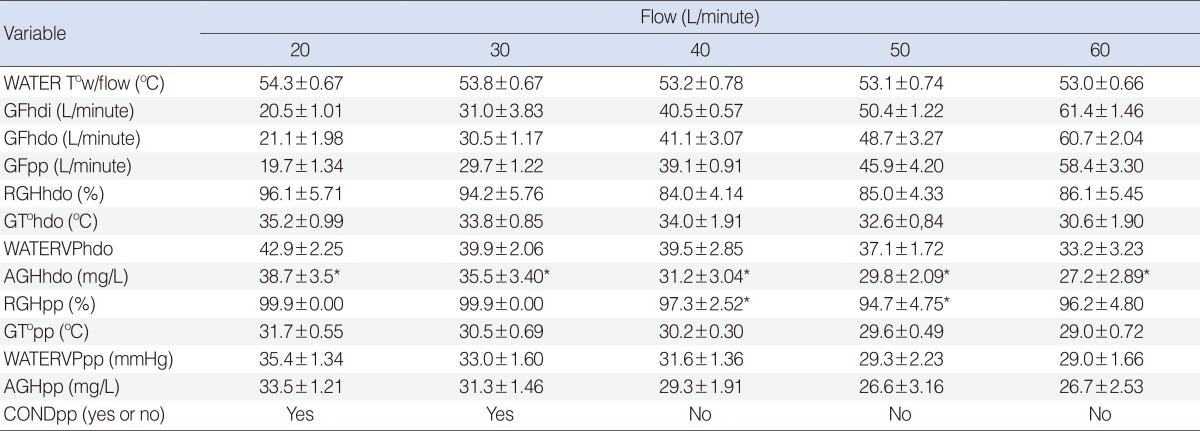
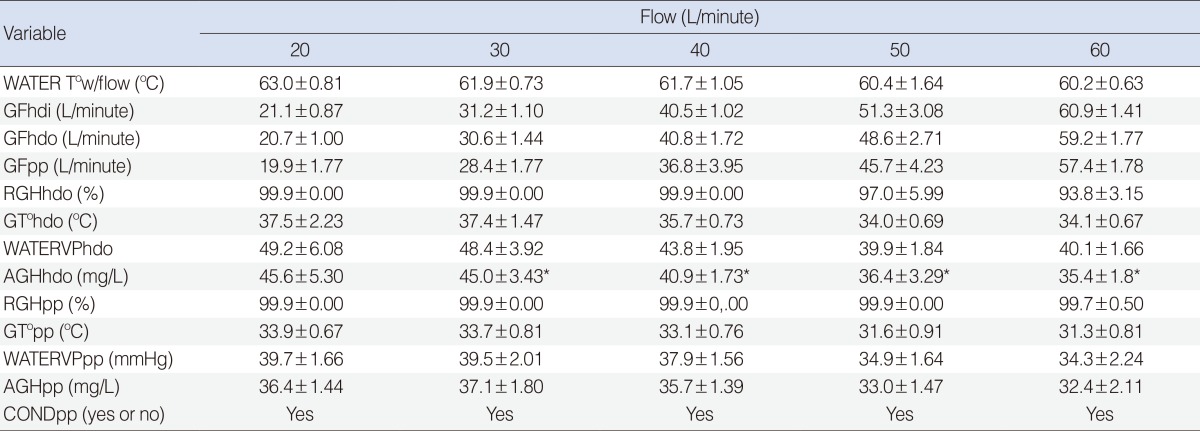
ET° and ERH were stable during the whole study, with average values of 27.63℃ (±0.13℃) and HR 51.63% (±1.27%). T° and RH of gas without humidification were also regular during the evaluation period: 27.63℃ (±0.65℃) and HR 6.09% (±0.61). Mean values±SD of all measured variables for each of the three temperature levels and for all flows are shown on Tables 2,3,4. On average, water T° without gas flow at AHS levels I, II, and III was 44℃, 59℃, and 68℃, respectively.
Table 2.
Mean values±SD of all measured variables for temperature "level I" and for all flows
Values are presented as mean±SD.
WATER T°w/flow, water termperature with flow; GFhdi, gas flow at the humidifier device infow; GFhdo, gas flow at humidifier device outflow; GFpp, gas flow proximal to patient; RGHhdo, relative gas humidity at humidifier device outflow; GT°hdo, gas temperature at humidifier device outflow; WATERVPhdo, water vapor pressure at humidifier device outflow; AGHhdo, absolute gas humidity at humidifier device outflow; RGHpp, relative gas humidity proximal to patient; GT°pp, gas temperature proximal to patient; WATERVPpp, water vapor pressure proximal to patient; AGHpp, absolute gas humidity proximal to patient; CONDpp, condensation proximal to patient.
*P<0.05, statistically significant differences between groups.
Table 3.
Mean values±SD of all measured variables for temperature "level II" and for all flows
Values are presented as mean±SD.
WATER T°w/flow, water termperature with flow; GFhdi, gas flow at the humidifier device infow; GFhdo, gas flow at humidifier device outflow; GFpp, gas flow proximal to patient; RGHhdo, relative gas humidity at humidifier device outflow; GT°hdo, gas temperature at humidifier device outflow; WATERVPhdo, water vapor pressure at humidifier device outflow; AGHhdo, absolute gas humidity at humidifier device outflow; RGHpp, relative gas humidity proximal to patient; GT°pp, gas temperature proximal to patient; WATERVPpp, water vapor pressure proximal to patient; AGHpp, absolute gas humidity proximal to patient; CONDpp, condensation proximal to patient.
*P<0.05, statistically significant differences between groups.
Table 4.
Mean values±SD of all measured variables for temperature "level III" and for all flows
Values are presented as mean±SD.
WATER T°w/flow, water termperature with flow; GFhdi, gas flow at the humidifier device infow; GFhdo, gas flow at humidifier device outflow; GFpp, gas flow proximal to patient; RGHhdo, relative gas humidity at humidifier device outflow; GT°hdo, gas temperature at humidifier device outflow; WATERVPhdo, water vapor pressure at humidifier device outflow; AGHhdo, absolute gas humidity at humidifier device outflow; RGHpp, relative gas humidity proximal to patient; GT°pp, gas temperature proximal to patient; WATERVPpp, water vapor pressure proximal to patient; AGHpp, absolute gas humidity proximal to patient; CONDpp, condensation proximal to patient.
*P<0.05, statistically significant differences between groups.
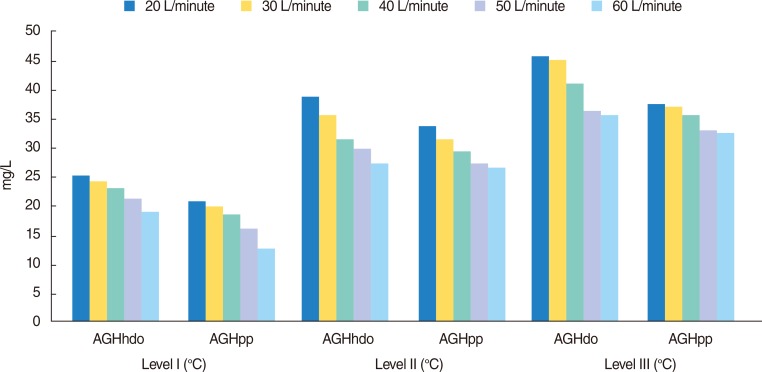
AGHpp increased due to the temperature level that was used, and it decreased due to the increase of flow. At T° level I, AGHpp underwent a fall of 40% when the flow increased from 20 to 60 L/minute (20.5 mg/L vs. 12.43 mg/L), whereas at level II the decrease of AGHpp was of 21% (33.5 mg/L vs. 26.7 mg/L). Finally, AGHpp suffered, at level III, a decrease of 11% (36.4 mg/L vs. 32.4 mg/L). ANOVA test was applied to carry out statistical analysis for repeated measurements, showing significant differences between the different T° levels and the different flow levels (P<0.0001 overall).
No evidence of correlation was found between the T° level and the flow in the device that we used. A post hoc analysis showed a significant difference between every one of the T° levels and flows that were used.
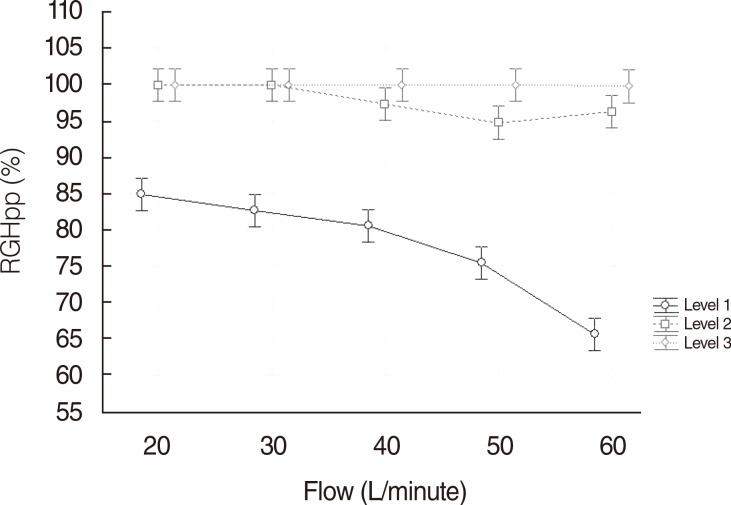
The RGHpp analysis also showed significant differences between T° levels and flow (P<0.0001 global) by applying ANOVA test to carry out statistical analysis for repeated measurements. Fig. 2 illustrates the clear interaction between RGHpp and flow. At T° level I, RGHpp experienced a fall of 33% when the flow increased from 20 to 60 L/minute (84.9% vs. 65.6%), whereas at level II the decrease of RGHpp was of 4% (99.9% vs. 96.6%). Finally, RGHpp suffered, at level III, a decrease of less than 1% (99.9% vs. 99.7%). This correlation was confirmed as significant in the ANOVA model.
Fig. 2.
Comparison between different temperature levels and flow (L/minute) related to relative gas humidity proximal to patient (RGHpp).
Regarding level I of T°, the following values were found: AGHhdo 26.05 mg/L (±6.07) vs. AGHpp 17.5 mg/L (±3.96) (P<0.0001); at level II of T°, AGHhdo 32,46 mg/L (±5.06) vs. AGHpp 29.46 mg/L (±3.39) (P=0.0007); and at level III of T°, AGHhdo 38.65 mg/L (±6.59) vs. AGHpp 34,93 mg/L (±2.46) (P=0.0003). These values show a significant difference in the decrease of AGH in the path of the tube (Fig. 3).
Fig. 3.
Absolute humidity behavior in relation to different levels of flow and temperature. AGHhdo, absolute gas humidity at humidifier device outflow; AGHpp, absolute gas humidity proximal to patient.
DISCUSSION
In terms of inhaled gas conditioning, the main variable is AH. This variable is closely related to gas T°, and gas T° depends directly on the water T° of the chamber. Consequently, it can be stated that AH delivered by AHS depends directly on the water T° of the heater.
If we focus on AH, we will observe that its behavior varies according to flow rate and water T°. Flows greater than 40 L/minute at a water T° of 53.2℃ (level II) do not reach the minimum recommended values. If flows greater than 40 L/minute are needed, the water T° will have to be increased to at least 61.4℃ (level III).
Relating AH to RH, it was observed that gas may be saturated at 99.9% without having the minimum recommended AH. This is a consequence of a decrease of water T°, or a decrease of the contact time of gas with the water surface; i.e., the greater the flows, the lower the evaporation rate; thus, the resulting mass of water vapor will also be lower.
Condensation proximal to the patient proved to be an independent predictor of an AH of at least 30 mg/L for all flows at level III, for 20 and 30 L/minute at level II, and an environmental T° of 27℃-28℃, as it was also reported by Ricard et al. [19]. In colder environments, condensation does not necessarily imply the minimun recommended AH. Chanques et al. [17] evaluated condensation by using AHS and HF in patients without an artificial airway and found condensation only when using AHS. However, this might have been influenced by the air exhaled by the patient wearing the mask.
Observing the AH behavior again, this time as it relates to the tubing length, an AH decrease is noted while approaching the end of the tubing proximal to the patient. This decrease could be caused by heat loss along the circuit.
It is quite possible that measured variables may behave differently if they were measured in patients. Measurements made with AHS and referred to as "proximal to patient" in clinical practice could be affected by the minute ventilation or the tidal volume amplitude of the patient. Hence, AH, T°, and RH of inhaled gas could fall as a result of a possible mixture with environmental air during inhalation. In order to avoid this potential problem, this circuit should have a reservoir of 75 mL at the proximal end to patient. During the exhalation phase, this reservoir is filled with conditioned gas delivered by an AHS, so if the tidal volume of the next inhalation exceeds the volume delivered by the AHS, the reservoir would provide the missing part. Taking into account that an AHS conditions flows from 20 to 60 L/minute effectively, and that a patient's minute volume is usually between 8 and 10 L/minute, the AHS delivers higher amounts of humidified gas than necessary. Such device (AHS) might be useful in patients with poor spontaneous ventilation due to the resistance and the dead space created by the passive humidifier.
Finally, we consider that an AHS could be applied to patients with an artificial airway being weaned from mechanical ventilation or during testing periods of spontaneous breathing.
In conclusion, according to our results, it may be necessary to have a device that keeps water at a temperature of at least 53℃ for flows of 20 and 30 L/minute, and at a T° of 61℃ for flows of 20, 30, 40, 50, and 60 L/minute in order to achieve appropriate RH, AH, and gas T°.
ACKNOWLEDGMENTS
We would like to thank Oscar Pereyra Gonzáles, Mariana Scrigna for his tireless dedication, effort and academic generosity.
Footnotes
No potential conflict of interest relevant to this article was reported.
References
- 1.Branson RD. Humidification for patients with artificial airways. Respir Care. 1999 Jun;44(6):630–641. [Google Scholar]
- 2.Rathgeber J. Devices used to humidify respired gases. Respir Care Clin N Am. 2006 Jun;12(2):165–182. doi: 10.1016/j.rcc.2006.03.012. [DOI] [PubMed] [Google Scholar]
- 3.Sottiaux TM. Consequences of under- and over-humidification. Respir Care Clin N Am. 2006 Jun;12(2):233–252. doi: 10.1016/j.rcc.2006.03.010. [DOI] [PubMed] [Google Scholar]
- 4.American Association for Respiratory Care. AARC clinical practice guideline. Humidification during mechanical ventilation. Respir Care. 1992 Aug;37(8):887–890. [PubMed] [Google Scholar]
- 5.American Association for Respiratory Care. Consensus statement on the essentials of mechanical ventilators: 1992. Respir Care. 1992 Sep;37(9):1000–1008. [PubMed] [Google Scholar]
- 6.Hess DR, Branson RD. Humidification: humidifiers and nebulizers. In: Branson RD, Hess DR, Chatburn RL, editors. Respiratory care equipment. 2nd ed. Philadelphia: JB Lippincott; 1999. pp. 101–132. [Google Scholar]
- 7.Setten M, Rodrigues La Moglie R. Humidificación, calentamiento y aerosolización del aire inspirado en la ventilación mecánica. In: Ceraso DH, Chiappero GR, Maskin BC, editors. Terapia intensiva. 4th ed. Buenos Aires: Editorial Médica Panamericana; 2007. pp. 202–206. [Google Scholar]
- 8.Ploysongsang Y, Branson RD, Rashkin MC, Hurst JM. Effect of flowrate and duration of use on the pressure drop across six artificial noses. Respir Care. 1989;34(10):902–907. [Google Scholar]
- 9.Nishimura M, Nishijima MK, Okada T, Taenaka N, Yoshiya I. Comparison of flow-resistive work load due to humidifying devices. Chest. 1990 Mar;97(3):600–604. doi: 10.1378/chest.97.3.600. [DOI] [PubMed] [Google Scholar]
- 10.Manthous CA, Schmidt GA. Resistive pressure of a condenser humidifier in mechanically ventilated patients. Crit Care Med. 1994 Nov;22(11):1792–1795. [PubMed] [Google Scholar]
- 11.Chiaranda M, Verona L, Pinamonti O, Dominioni L, Minoja G, Conti G. Use of heat and moisture exchanging (HME) filters in mechanically ventilated ICU patients: influence on airway flow-resistance. Intensive Care Med. 1993;19(8):462–466. doi: 10.1007/BF01711088. [DOI] [PubMed] [Google Scholar]
- 12.Iotti GA, Olivei MC, Palo A, Galbusera C, Veronesi R, Comelli A, et al. Unfavorable mechanical effects of heat and moisture exchangers in ventilated patients. Intensive Care Med. 1997 Apr;23(4):399–405. doi: 10.1007/s001340050347. [DOI] [PubMed] [Google Scholar]
- 13.Pelosi P, Solca M, Ravagnan I, Tubiolo D, Ferrario L, Gattinoni L. Effects of heat and moisture exchangers on minute ventilation, ventilatory drive, and work of breathing during pressure-support ventilation in acute respiratory failure. Crit Care Med. 1996 Jul;24(7):1184–1188. doi: 10.1097/00003246-199607000-00020. [DOI] [PubMed] [Google Scholar]
- 14.Conti G, De Blasi RA, Rocco M, Pelaia P, Antonelli M, Bufi M, et al. Effects of the heat-moisture exchangers on dynamic hyperinflation of mechanically ventilated COPD patients. Intensive Care Med. 1990;16(7):441–443. doi: 10.1007/BF01711222. [DOI] [PubMed] [Google Scholar]
- 15.Le Bourdellès G, Mier L, Fiquet B, Djedaini K, Saumon G, Coste F, et al. Comparison of the effects of heat and moisture exchangers and heated humidifiers on ventilation and gas exchange during weaning trials from mechanical ventilation. Chest. 1996 Nov;110(5):1294–1298. doi: 10.1378/chest.110.5.1294. [DOI] [PubMed] [Google Scholar]
- 16.Branson RD, Davis K, Jr, Campbell RS, Johnson DJ, Porembka DT. Humidification in the intensive care unit. Prospective study of a new protocol utilizing heated humidification and a hygroscopic condenser humidifier. Chest. 1993 Dec;104(6):1800–1805. doi: 10.1378/chest.104.6.1800. [DOI] [PubMed] [Google Scholar]
- 17.Chanques G, Constantin JM, Sauter M, Jung B, Sebbane M, Verzilli D, et al. Discomfort associated with underhumidified high-flow oxygen therapy in critically ill patients. Intensive Care Med. 2009 Jun;35(6):996–1003. doi: 10.1007/s00134-009-1456-x. [DOI] [PubMed] [Google Scholar]
- 18.Scanlan CL. Physical principles in respiratory care. In: Scanlan CL, Wilkins RL, Stoller JK, editors. Egan's fundamentals of respiratory care. 7th ed. St. Louis, MO: Mosby; 1999. pp. 79–107. [Google Scholar]
- 19.Ricard JD, Markowicz P, Djedaini K, Mier L, Coste F, Dreyfuss D. Bedside evaluation of efficient airway humidification during mechanical ventilation of the critically ill. Chest. 1999 Jun;115(6):1646–1652. doi: 10.1378/chest.115.6.1646. [DOI] [PubMed] [Google Scholar]


