

Abstract
Aim
To investigate the feasibility of dose escalation using rapid arc (RA) and Helical Tomotherapy (HT) for patients with upper, middle and distal esophageal carcinomas, even for large tumor volumes.
Background
In esophageal cancer, for patients with exclusive radio-chemotherapy, local disease control remains poor. Planning study with dose escalation was done for two sophisticated modulated radiotherapy techniques: Rapid arc against Tomotherapy.
Materials and methods
Six patients treated with a RA simultaneous integrated boost (SIB) of 60 Gy were re-planned for RA and HT techniques with a SIB dose escalated to 70 Gy. Dose volume histogram statistics, conformity indices and homogeneity indices were analyzed. For a given set of normal tissue constraints, the capability of each treatment modality to increase the GTV dose to 70 Gy was investigated.
Results
Either HT or VMAT may be used to escalate the dose delivered in esophageal tumors while maintaining the spinal cord, lung and heart doses within tolerance. Adequate target coverage was achieved by both techniques. Typically, HT achieved better lung sparing and PTV coverage than did RA.
Conclusions
Dose escalation for esophageal cancer becomes clinically feasible with the use of RA and HT. This promising result could be explored in a carefully controlled clinical study which considered normal tissue complications and tumor control as endpoints.
Keywords: Rapid arc, Tomotherapy, Dose escalation, Esophageal cancer
1. Background
In Europe, the incidence of esophageal cancer is rising, especially the number of adenocarcinoma cases, located principally in the mid- or distal esophagus. Multimodality treatment strategies, such as chemo-radiotherapy1 that can be associated with surgery or radiotherapy (pre or post-operatively), are generally the standard treatment. In locally advanced tumor, long term survival remains poor. For the cohort of patients with unresectable esophageal cancer studied by Settle,2 75% of radiation therapy failures occurred within the gross tumor volume (GTV). Despite recent advances in radiation planning, tumor imaging, and radiation delivery the radiotherapy techniques and doses used for treating esophageal cancer have remained relatively unchanged. In esophageal cancer, for patients with exclusive radio-chemotherapy, local disease control, especially within the GTV, remains poor and problematic.
Radiotherapy of the esophagus is challenging because the tumor is surrounded by a host of organs at risk (OAR) including the lungs, heart and spinal cord. However, sophisticated modulated radiotherapy techniques allow improved dose-sparing of these structures.
Several dosimetric studies3–6 have shown that, compared with standard three-dimensional conformal radiotherapy (3D CRT), intensity modulated radiotherapy (IMRT) can lower the dose to organs at risk (OARs) in the esophageal region without compromising target coverage.
Volumetric modulated arc therapy (VMAT) is an innovative technology which has recently been introduced. RapidArc (RA) is a method of VMAT based on the work of Otto.7 In RapidArc, the dose rate, MLC positions and gantry rotation speed are simultaneously optimized by an iterative inverse process. VMAT can provide similar or even better OAR sparing and PTV coverage than IMRT with a shorter delivery time.8–12 Helical Tomotherapy (HT) (TomoTherapy Inc., Madison, WI) is a modality for delivering IMRT treatments using a rotating linear accelerator.
This study investigates whether it is possible to deliver curative esophageal doses using HT and RA. In head and neck cancer, 70 Gy delivered in 35 fractions to the PTV is considered to be a curative dose.
Most published dosimetric studies of esophageal cancer consider lower prescribed doses,13,14 for example Martin et al.5 published a comparison of helical tomotherapy, RapidArc with prescriptions ranging from 45 to 60 Gy. Logically, the demonstrated benefits of radiation dose escalation for tumors at other anatomic sites in terms of improved local control and survival could be expected to apply to esophageal cancer as well. The standard esophageal prescribed dose of 50.4 Gy, published by RTOG15 has been accepted for many years. Nevertheless, Zhang et al.16 reported that higher doses of radiation were associated with decreased locoregional recurrence and increased survival. Hurmuzlu et al.17 reported a positive correlation between local tumor control and high dose RT.
2. Aim
The aim of this study was to evaluate the possibility of escalating the dose to the PTV while respecting the dose constraints to organs at risk, using RA or HT. In our department, the standard prescription is based on a RA Simultaneaous Integrated Boost (SIB) delivering 60 Gy.
We compared dosimetric data between three Simultaneous Integrated Boot (SIB) modulated plans for medium and large targets in esophageal cancer:
-
1.
The RA plan used for patient treatment, with our standard prescription dose of 60 Gy.
-
2.
A second RA plan, dose-escalated to 70 Gy.
-
3.
A HT plan, dose-escalated to 70 Gy.
3. Materials and methods
3.1. Patient selection – contouring
This study considered six patients with locally upper, middle or distal esophageal carcinomas. Table 1 summarizes the characteristics of the patients. All patients had large and long targets, with PTV volumes ranging from 386 cc to 957 cc. Each patient underwent a computed tomography scan with a slice thickness of 2.5 mm. The gross tumor volume (GTV) and involved lymph nodes were outlined by the radiation oncologist using information from fused PET/CT data, endoscopic reports and CT diagnosis images. The clinical target volume (CTV) was derived from the GTV by adding a 3D margin of 1 cm except in inferior and superior where 3 cm was applied. For each patient, two planning target volumes, PTV1 and PTV2, were generated. PTV1 consisted of the CTV plus a 1 cm margin. PTV2 consisted of the GTV plus a 1 cm margin. These two PTVs were used in the dose prescription as outlined in the subsection below. The relevant OARs were: the right and left lung, the whole lungs, the heart, the liver and the spinal canal. All of these OARs were outlined by the oncologist.
Table 1.
Summary of patient characteristics.
| Patient | CT extent | Staging | PTV2 (cm3) | PTV1 (cm3) |
|---|---|---|---|---|
| 1 | Mid-esophagus | T3N1 | 119.0 | 651.7 |
| 2 | Upper-esophagus | T3N1 | 147.4 | 821.5 |
| 3 | Mid-esophagus | T3N1 | 145.5 | 548.7 |
| 4a | Mid-esophagus | T1N0 | 117.4 | 386.3 |
| 5 | Distal-esophagus | T3N1 | 286.6 | 957.9 |
| 6 | Mid-esophagus | T2N0 | 132.6 | 434.6 |
Against medical indication to surgery.
As outlined in the introduction, for each patient, three treatment plans were optimized:
-
1.
A RA (RA SIB 48/60) plan with our standard dose of 60 Gy, delivering 60 Gy to PTV2 and 48 Gy to PTV1 in 30 fractions. This plan was delivered clinically.
-
2.
A further RA plan (RA SIB 56/70) delivering 70 Gy to PTV2 and 56 Gy to PTV1 in 35 fractions.
-
3.
A HT plan (HT SIB 56/70) delivering 70 Gy to PTV2 and 56 Gy to PTV1 in 35 fractions.
For all the plans, normalization was set to the median dose to the PTV volume receiving the highest dose prescription (PTV2) for compliance with the International Commission on Radiation Units and Measurements (ICRU) report 83 recommendations.18
3.2. Planning process
All the RA treatment plans were computed using the Eclipse TPS v8.9 (Varian Medical Systems, Inc., Palo Alto, CA). Dose calculation was performed using the anisotropic analytical algorithm (AAA) with a calculation grid resolution of 2.5 mm. The plans were optimized for a Varian 2100 iX clinac equipped with a Millenium 120 MLC. Each RA plan was designed using two 6 MV photon coplanar arcs of 360° (CW and CCW) divided in 177 control points. The collimator angle was equal to 15° and 345° for the clockwise and counterclockwise arcs, respectively. The optimization was based on the PRO II algorithm. Normal tissue optimization (NTO) was employed in the RA planning in order to minimize the dose deposited outside the PTV. The NTO was used with a distance from target of 3 mm, a start dose of 100%, an end dose of 30% and a fall off of 0.1. The maximal dose rate was set to 600 MU/min.
HT utilizes a helical slice 6 MV photon beam, modulated in intensity using binary MLCs. For all plans, we used a field width of 2.5 cm with a pitch value of 0.287 and a nominal modulation factor of 2.5. Plans were optimized using the Tomotherapy Hi-Art TPS, version 4.2. (Tomotherapy Inc. Madison, WI). The dose distribution for each beamlet was calculated using a convolution/superposition algorithm. The optimization process used the least mean squares method to minimize the objective function.
No avoidance sectors to exclude beam entrance through the lungs were used but stringent objectives were defined. The planning objectives for PTV were that at least 95% of the volume receives 95% of the prescribed dose and no more than 2% receives 107% of the prescribed dose. For the OARs, the lung volume receiving 20 Gy was limited to 30% and the lung volume receiving 30 Gy was limited to 20%. We sought to keep the lung volumes receiving 5 Gy and 10 Gy as small as possible. A mean lung dose of 15 Gy or less was sought and a limit of 20 Gy was enforced. The heart volume receiving 40 Gy was limited to 15% and we sought to keep the mean heart dose as low as possible. Several studies19,20 have noted both that the reduction of the V40 is pertinent in reducing heart toxicities and substantial radiation induced heart disease can occur in cases where the heart receives more than 40 Gy. The spinal canal volume receiving 45 Gy had to be less than 2%. These organs at risk constraints are summarized in Table 2.
Table 2.
Organs at risk constraints.
| OARs | Statistics | Constraints |
|---|---|---|
| Lungs | Mean dose (Gy) | Near 15 Gy and <20 Gy |
| V5 (%) | ALARAa | |
| V10 (%) | ALARA | |
| V20 (%) | <30% | |
| V30 (%) | <20% | |
| Heart | Mean dose (Gy) | ALARA |
| V30 (%) | ALARA | |
| V40 (%) | <15% | |
| Spinal canal | D2% (Gy) | <45 Gy |
As low as reasonable achievable.
3.3. Evaluation tools
An analysis was performed based on the cumulative dose volume histograms (DVH) for each patient/plan/region of interest. The plans were evaluated using the DVH data for target and critical organs. Here, the percentage of a volume that receives at least m% of the prescription dose is expressed as Vm% and the dose to q% of the volume is expressed as Dq%.
For the PTV, the values of D95%(Gy), D98%(Gy), D2%(Gy) (dose received by 95%, 98% and 2% of the PTV) and V95% (volume receiving 95% of the prescribed dose) were analyzed.
The conformity index CI21,22 was calculated as follows:
VT is the PTV volume and VT95% is the PTV volume receiving at least 95% of the prescribed dose. The value of the CI is necessarily between zero and one. A CI of one represents the ideal situation where the target volume coincides exactly with the treatment volume. A value of 1 for the CI represented a better PTV conformity.
Target dose homogeneity was evaluated through the Homogeneity Index18 (HI), defined as the difference between the maximum and minimum dose to the PTV (D2% and D98%), divided by the prescription dose: HI = (D2% − D98%)/Dprescription.
A lower HI value indicates that a plan provides a more homogeneous dose distribution.
The mean doses for all the relevant critical structures were assessed. The percentages of a volume that received the dose of nGy were defined by Vn. For each plan, the following data for OAR were recorded: for the lungs – mean dose (MLD), V5, V10, V20 and V30; for the heart – mean dose, V30, V40; and for the spinal canal – D2%.
4. Results
Tables 3 and 4 summarize the quantitative analysis performed on the six patients in the study. Table 3 gives the statistics for the OARs. The data are presented as the average for all patients with the standard deviation. Table 3 shows that the MLD was 14.1 ± 3.5 Gy for the RA(48/60), 15.3 ± 3.8 Gy for the RA(56/70) and 13.9 ± 3.4 Gy for the HT(56/70). For all patients, the MLD was less than 20 Gy. For the lungs, V5 was high and similar for the three plans and for all patients. The HT(56/70) had the lowest volume of lung irradiated by a dose of 10 Gy. V10 was equal to 67% for the RA(48/60), 69.8% for the RA(56/70) and 60% for the HT(56/70). The HT plan proved the most advantageous in decreasing the volume of the V10Gy. The V20 was inferior to the traditional constraint of 30% but only the HT(56/70) allowed to keep it within the 20% constraint recommended by Lee et al.23 The V30 were lower than 10% for all patients and all the three techniques (well within our clinical constraint).
Table 3.
Summary of numeric analysis of DVH for OARs for the six patients – mean ± standard deviation.
| OARs | RA(48/60 Gy) | RA(56/70 Gy) | HT(56/70 Gy) | |
|---|---|---|---|---|
| Lungs | Mean dose (MLD) (Gy) | 14.1 ± 3.5 | 15.3 ± 3.8 | 13.9 ± 3.4 |
| V5 (%) | 79.2 ± 19.4 | 79.4 ± 19.9 | 79.1 ± 20.1 | |
| V10 (%) | 67.0 ± 19.8 | 69.8 ± 20.7 | 60.0 ± 18.5 | |
| V20 (%) | 21.5 ± 8.7 | 24.8 ± 8.7 | 19.5 ± 6.2 | |
| V30 (%) | 6.5 ± 2.7 | 9.2 ± 3.0 | 8.8 ± 2.7 | |
| Heart | Mean dose (Gy) | 20.4 ± 4.8 | 22.2 ± 4.8 | 21.8 ± 4.5 |
| V30 (%) | 16.6 ± 5.3 | 22.0 ± 6.7 | 20.5 ± 5.2 | |
| V40 (%) | 7.8 ± 2.5 | 10.4 ± 3.5 | 10.6 ± 2.9 | |
| Spinal canal | D2% (Gy) | 33.3 ± 2.8 | 36.1 ± 4.5 | 34.5 ± 2.7 |
Table 4.
Target coverage comparison across the six patients – mean ± standard deviation.
| PTVs | RA(48/60 Gy) | RA(56/70 Gy) | HT(56/70 Gy) | |
|---|---|---|---|---|
| PTV1 | D95% | 0.96 ± 0.01 | 0.94 ± 0.02 | 0.95 ± 0.02 |
| D98% | 0.94 ± 0.01 | 0.92 ± 0.02 | 0.92 ± 0.02 | |
| CI | 0.90 ± 0.03 | 0.90 ± 0.03 | 0.84 ± 0.03 | |
| HI | 0.27 ± 0.05 | 0.27 ± 0.05 | 0.26 ± 0.02 | |
| PTV2 | D95% | 0.95 ± 0.02 | 0.94 ± 0.02 | 0.95 ± 0.01 |
| D98% | 0.93 ± 0.02 | 0.92 ± 0.02 | 0.94 ± 0.01 | |
| D2% | 1.03 ± 0.01 | 1.03 ± 0.005 | 1.01 ± 0.005 | |
| CI | 0.87 ± 0.02 | 0.87 ± 0.02 | 0.93 ± 0.05 | |
| HI | 0.10 ± 0.02 | 0.10 ± 0.02 | 0.06 ± 0.03 | |
On average, the HT(56/70) plans gave the best results in terms of lung sparing. Mean lung dose, V5, V10, V20 were lower with HT, even when compared to the RA(48/60) plan. All RA(56/70) plans were still acceptable relative to our OAR constraints.
Table 3 shows that the average mean heart doses were similar across the three planning techniques: 20.4 ± 4.8 Gy for the RA(48/60), 22.2 ± 4.8 Gy for the RA(56/70) and 21.8 ± 4.5 Gy for the HT(56/70). Differences were evident in the heart values of V30 and V40 between the dose prescriptions of 60 Gy and 70 Gy. V30 and V40 were 16.6% and 7.8%, respectively, for RA(48/60), 22% and 10.4% for RA(56/70) and 20.5% and 10.6% for HT(56/70). V40 was greatly below our 20% objective.
The three treatment schemes protected the spinal canal to similar levels. Average D2% spinal canal was equal to 33.3 Gy for RA(48/60), to 36.1 Gy for RA(56/70) and 34.5 Gy for HT(56/70).
Table 4 gives the statistics for the PTVs. The data are presented as the mean for all patients with the standard deviation. D95% was equal to 0.96 for RA(48/60), 0.94 for RA(56/70) and 0.95 for HT(56/70) for PTV1, and 0.95 for RA(48/60), 0.94 for RA(56/70) and 0.95 for HT(56/70) for PTV2. For RA(56/70), D95% fell slightly short of the specified criteria due to the fact that a pencil beam algorithm was used during the optimization process, before the plan was ultimately calculated using the AAA algorithm. D98% was similar for PTV1 across the RA(56/70) and HT(56/70) plans and was slightly better for PTV2 for HT(56/70) plans. HT(56/70) yielded the best D2%.
RA had a better CI for PTV1 than HT. However, the opposite trend was observed for PTV2. HT yielded a slightly better HI than RA for PTV1. Greater differences in HI were observed for PTV2 where HT showed better results (0.10 vs. 0.06).
Fig. 1 shows the typical dose volume histogram for one of the patients for RA(56/70) and HT(56/70). The best OAR sparing was yielded by HT.
Fig. 1.
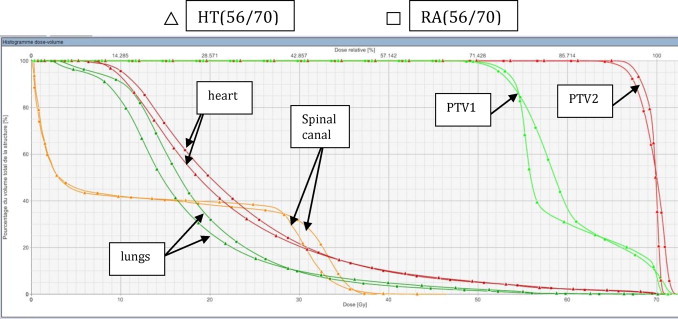
Comparing the dose volume histogram from RA(56/70) (square) and HT(56/70) (triangle) of a patient with mid esophageal tumor. Red = PTV 70 Gy; green = PTV 56 Gy; orange = spinal cord; green forest = lungs and pink = heart.
5. Discussion
To our knowledge, this study forms the first dosimetric comparison of 2 modern RT techniques (RA and HT) for esophageal cancers using a SIB technique to escalate the GTV dose to 70 Gy. Studies by both Yang et al.24 and Hazard et al.25 concluded that new and innovative treatment strategies are needed to improve outcomes for patients with esophageal cancers.
These results of this work demonstrate that either RA or HT could be utilized to treat esophageal tumors to high dose levels, without exceeding normal tissue tolerances. Consequently, dose escalation to the esophagus appears to be clinically feasible using modern RT techniques.
All treatment plans were optimized to provide acceptable coverage of PTV1 and PTV2 while maintaining OAR doses within tolerance. HT achieved superior OAR sparing and superior HI. Although the CI for PTV1 was lower for HT, the CI for PTV2 was higher for HT. Thus, HT proved to be slightly better than RA in terms of both target coverage and OAR dose.
The standard RTOG15 dose of 50.4 Gy for esophageal cancers has been prescribed for many years. However, several studies16,17,26 have reported positive correlations between local tumor control and RT target dose. For esophageal cancer, the optimal prescription dose is yet to be established. But of course, in any dose escalation study the risk of pulmonary toxicity must remain an important consideration. Several lung DVH parameters27,28 have been highly correlated with lung toxicity. Kwa et al.29 considered the mean lung dose to be the most useful predictor of radiation pneumonitis in thoracic29 radiotherapy, a finding also mirrored by other studies.30–32 Dehing Oberije et al.28 recommended a mean lung dose ≤20 Gy. V20 is also a recognized indicator of lung toxicity, correlated with increased risk of radiation pneumonitis.30,31 Dehing Oberije et al. recommended a V20 constraint of ≤35%. Lee et al.23 recommended that V20 be kept below 20%. Additionally, V30, V10 and V5 have been correlated to pulmonary complications in studies by Graham et al.30 Lee et al.23 and Tucker et al.32 respectively. In this study we found minimization of V5 difficult to accomplish: this parameter was high for all patients and all plans. However, the problem of low doses in lung, such as V5, has long been also a feature of 3D conformal radiotherapy. Indeed, conformal radiotherapy plans were optimized for the six patients with a prescribed dose of 45 Gy to the PTV1. The average of the mean lung dose was 17.4 Gy, the V5 was equal to 78.7%, the V20 was equal to 35.2%, the V30 was equal to 16%.33 The value of the V5 was at least comparable to modern techniques (RA or HT) despite the lower prescription dose of 45 Gy. The HT plans demonstrated great advantages in decreasing the volume of the lung irradiated to a dose of 10 Gy and 20 Gy. The MLD was also lower with HT.
Regarding heart doses, Wei et al.34 found that V30 >46% and <46% was associated with rates of pericardial effusion of 73% and 13%, respectively. They identified the pericardium V30 as a significant predictor of pericardial effusion on multivariate analysis. In our results, V30 was far away from the 46% that Wei34 noted as a significant predictor of pericardial effusion.
During the planning process we observed that whilst stressing the lung-sparing objectives enabled us to decrease the dose to the lungs, generally the dose to the heart increased as a result. Thus, reducing lung dose and reducing heart dose appeared to be competing objectives and it was necessary for us to strike a balance between the two. A similar form of competition was observed by Martin et al.5 Overall lung exposure could have been lowered at the cost of heart dose. Our choice was to minimize the mean heart dose and V40. The trade-off between the heart and lung doses should be closely monitored during the planning stages.
6. Conclusions
For all types of esophageal carcinoma size and location, this study has demonstrated that it is possible to use advanced RT techniques to increase the esophageal GTV dose to 70 Gy whilst ensuring that organ at risk doses are kept to an acceptable level.
The data presented here suggest that either HT or RA may be used to escalate the dose delivered in esophageal tumors while maintaining spinal cord, lung and heart doses within tolerance. Both techniques achieved adequate target dose coverage. Typically, HT achieved better lung sparing and PTV coverage than did RA.
This is a potentially significant result as 75% of esophageal locoregional failures are localized within the gross tumor volume.2 A higher radiation dose was associated with increased locoregional control and survival in the dose range studied by Zhang et al.16
The results of this work could be explored in a clinical study considering normal tissue complications and tumor control as endpoints. A carefully designed dose escalation trial would be necessary to confirm the correlation between radiation dose and locoregional control in the dose range studied. Additionally, particular care regarding risk of pulmonary toxicity would always be required.
Conflict of interest
None declared.
Financial disclosure
None declared.
Acknowledgements
The authors thank Tracy Underwood, Régis Ferrand and Martine Delannes for their contributions.
The authors express their deep gratitude to the GOCO (Grup Oncòlogic Català Occità) group for allowing them to present a part of this work in the XXI meeting.
References
- 1.Torrente S., Turri L., Deantonio L. Concomitant chemo-radiotherapy for unresectable oesophageal cancer: a mono-institutional study on 40 patients. Rep Pr Oncol Radiother. 2012;17(4):226–232. doi: 10.1016/j.rpor.2012.03.013. [DOI] [PMC free article] [PubMed] [Google Scholar]
- 2.Settle S., Bucci M., Palmer M. PET/CT fusion with treatment planning CT (TP CT) shows predominant pattern of locoregional failure in esophageal patients treated with chemoradiation (CRT) is in GTV. Int J Radiat Oncol Biol Phys. 2008;72(1):72. [Google Scholar]
- 3.Nutting C.M., Bedford J.L., Cosgrove V.P. A comparison of conformal and intensity-modulated techniques for oesophageal radiotherapy. Radiother Oncol. 2001;61:157–163. doi: 10.1016/s0167-8140(01)00438-8. [DOI] [PubMed] [Google Scholar]
- 4.Fu W., Wang L., Zhou Z. Comparison of conformal and intensity-modulated techniques for simultaneous integrated boost radiotherapy of upper esophageal carcinoma. World J Gastroenterol. 2004;10(8):1098–1102. doi: 10.3748/wjg.v10.i8.1098. [DOI] [PMC free article] [PubMed] [Google Scholar]
- 5.Martin S., Chen J.Z., Dar A.R. Dosimetric comparison of helical tomotherapy, RapidArc, and a novel IMRT and Arc technique for esophageal carcinoma. Radiother Oncol. 2011;101(3):431–437. doi: 10.1016/j.radonc.2011.08.030. [DOI] [PubMed] [Google Scholar]
- 6.Mayo C., Urie M., Fitzgerald T. Hybrid IMRT for treatment of cancers of the lung and esophagus. Int J Radiat Oncol Biol Phys. 2008;71(5):1408–1418. doi: 10.1016/j.ijrobp.2007.12.008. [DOI] [PubMed] [Google Scholar]
- 7.Otto K. Volumetric modulated arc therapy: IMRT in a single gantry arc. Med Phys. 2008;35(1):310–317. doi: 10.1118/1.2818738. Available at: http://link.aip.org/link/MPHYA6/v35/i1/p310/s1&Agg=doi (accessed 18.12.13) [DOI] [PubMed] [Google Scholar]
- 8.Benthuysen L., Hales L., Podgorsak M. Volumetric modulated arc therapy vs. IMRT for the treatment of distal esophageal cancer. Med Dosim. 2011;36(4):404–409. doi: 10.1016/j.meddos.2010.09.009. [DOI] [PubMed] [Google Scholar]
- 9.Yin L., Wu H., Gong J. Volumetric-modulated arc therapy vs c-IMRT in esophageal cancer: a treatment planning comparison. World J Gastroenterol. 2012;18(37):5266–5275. doi: 10.3748/wjg.v18.i37.5266. [DOI] [PMC free article] [PubMed] [Google Scholar]
- 10.Hawkins M.A., Bedford J.L., Warrington A.P., Tait D.M. Volumetric modulated arc therapy planning for distal oesophageal malignancies. Br J Radiol. 2012;85(January):44–52. doi: 10.1259/bjr/25428720. [DOI] [PMC free article] [PubMed] [Google Scholar]
- 11.Kumar S.A.S., Vivekanandan N., Sriram P. A study on conventional IMRT and RapidArc treatment planning techniques for head and neck cancers. Rep Pr Oncol Radiother. 2012;17(3):168–175. doi: 10.1016/j.rpor.2012.01.009. [DOI] [PMC free article] [PubMed] [Google Scholar]
- 12.Amendola B., Amendola M., Perez N., Iglesias A., Wu X. Volumetric-modulated arc therapy with RapidArc: an evaluation of treatment delivery efficiency. Rep Pr Oncol Radiother. 2013;18(6):383–386. doi: 10.1016/j.rpor.2013.07.005. [DOI] [PMC free article] [PubMed] [Google Scholar]
- 13.Abbas A.S., Moseley D., Kassam Z. Volumetric-modulated arc therapy for the treatment of a large planning target volume in thoracic esophageal cancer. J Appl Clin Med Phys. 2013;14(3):192–202. doi: 10.1120/jacmp.v14i3.4269. [DOI] [PMC free article] [PubMed] [Google Scholar]
- 14.Wang Y., Chen S., Chien C. Radiotherapy for esophageal cancer using simultaneous integrated boost techniques: dosimetric comparison of helical tomotherapy. volumetric-modulated arc therapy (RapidArc) and dynamic intensity-modulated radiotherapy. Technol Cancer Res Treat. 2013;12(6):485–491. doi: 10.7785/tcrt.2012.500348. [DOI] [PubMed] [Google Scholar]
- 15.Minsky D., Pajak T., Ginsberg R., III Trial of combined-modality therapy for esophageal therapy. J Clin Oncol. 2014;20(5):1167–1174. doi: 10.1200/JCO.2002.20.5.1167. [DOI] [PubMed] [Google Scholar]
- 16.Zhang Z., Zhongxing L., Jin J. Dose–response relationship in locoregional control for patients with stage II–III esophageal cancer treated with concurrent chemotherapy and radiotherapy. Int J Radiat Oncol Biol Phys. 2005;61(3):656–664. doi: 10.1016/j.ijrobp.2004.06.022. [DOI] [PubMed] [Google Scholar]
- 17.Hurmuzlu M., Monge O., Smaaland R. High dose definitive concomittant chemoradiotherapy in non metastatic locally advanced esophageal cancer toxicity and outcome. Dis Esophagus. 2010;23:244–252. doi: 10.1111/j.1442-2050.2009.00999.x. [DOI] [PubMed] [Google Scholar]
- 18.The International Commission on Radiation Units and Measurements Prescribing, Recording, and Reporting Photon-Beam Intensity-Modulated Radiation Therapy (IMRT), ICRU Report 83. ICRU. 2010 [Google Scholar]
- 19.Ishikura S., Nihei K., Ohtsu A. Long term toxicity after definitive chemoradiotherapy for squamous cell carcinoma of the thoracic esophagus. J Clin Oncol. 2003;21:2967–3702. doi: 10.1200/JCO.2003.03.055. [DOI] [PubMed] [Google Scholar]
- 20.Hancock S., Tucker M., Hoppe R. Factors affecting late m,ortality from heart disease after tretament of hodgkin's disease. JAMA. 1993;270:1949–1955. [PubMed] [Google Scholar]
- 21.Feuvret L., Noël G., Mazeron J. Conformity index: a review. Int J Radiat Oncol Biol Phys. 2006;64:333–342. doi: 10.1016/j.ijrobp.2005.09.028. [DOI] [PubMed] [Google Scholar]
- 22.Van’t Riet A., Mak A., Moerland M. A conformation number to quantify the degree of conformality in brachytherapy and external beam irradiation. Int J Radiat Oncol Biol Phys. 1997;37:731–736. doi: 10.1016/s0360-3016(96)00601-3. [DOI] [PubMed] [Google Scholar]
- 23.Lee H., Vaporciyan A., Cox J. Postoperative pulmonary complications after preoperative chemoradiation for esophageal carcinoma: caorrelation with pulmonary dose-volume histogram parameters. Int J Radiat Oncol Biol Phys. 2003;57(5):1317–1322. doi: 10.1016/s0360-3016(03)01373-7. [DOI] [PubMed] [Google Scholar]
- 24.Yang G., McClosky S., Khushalani N. Principles of modern radiation techniques for esophageal and gastroesophageal junction cancers. Gastrointest Cancer Res. 2009;3:S6–S10. [PMC free article] [PubMed] [Google Scholar]
- 25.Hazard L., Yang G., McAleer M. Principles and techniques of radiation therapy for esophageal and gastroesophageal junction cancers. J Natl Compr Canc Netw. 2008;6:870–878. doi: 10.6004/jnccn.2008.0065. [DOI] [PubMed] [Google Scholar]
- 26.Welsh J., Palmer M., Ajani J. Esophageal cancer dose escalation using a simultaneous Integrated boost technique. Int J Radiat Oncol Biol Phys. 2012;82:468–474. doi: 10.1016/j.ijrobp.2010.10.023. [DOI] [PMC free article] [PubMed] [Google Scholar]
- 27.Wang S.L., Liao Z., Vaporciyan A. Investigation of clinical and dosimetric factors associated with postoperative pulmonary complications in esophageal cancer patients treated with concurrent chemoradiotherapy followed by surgery. Int J Radiat Oncol Biol Phys. 2006;64(3):692–699. doi: 10.1016/j.ijrobp.2005.08.002. [DOI] [PubMed] [Google Scholar]
- 28.Dehing-Oberije C., De Raysscher D., Van Baardwijk A. The importance of patient characteristics for the prediction of radiation induced lung toxicity. Radiat Oncol. 2009;91:421–426. doi: 10.1016/j.radonc.2008.12.002. [DOI] [PubMed] [Google Scholar]
- 29.Kwa S., Lebesque J., Theuws J. Radiation pneumonitis as a function of mean lung dose: an analysis of pooled data of 540 patients. Int J Radiat Oncol Biol Phys. 1998;42(1):1–9. doi: 10.1016/s0360-3016(98)00196-5. [DOI] [PubMed] [Google Scholar]
- 30.Graham M., Purdy J., Emami B. Clinical dose-volume histogram analysis for pneumonitis after 3D treatment for non-small cell lung cancer. Int J Radiat Oncol Biol Phys. 1999;45:323–329. doi: 10.1016/s0360-3016(99)00183-2. [DOI] [PubMed] [Google Scholar]
- 31.Tsujino K., Hirota S., Endo M. Predictive value of dose-volume histogram parameters for predicting radiation pneumonitis after concurrent chemoradiation for lung cancer. Int J Radiat Oncol Biol Phys. 2003;55:110–115. doi: 10.1016/s0360-3016(02)03807-5. [DOI] [PubMed] [Google Scholar]
- 32.Tucker L., Liu H., Wang S. Dose-volume modeling of the rik of postoperative pulmonary complications among esophageal cancer patients treated with concurrent chemoradiotherapy followed by surgery. Int J Radiat Oncol Biol Phys. 2006;66:754–761. doi: 10.1016/j.ijrobp.2006.06.002. [DOI] [PubMed] [Google Scholar]
- 33.Vidal M., Vieillevigne L., Izar F. Dosimetric comparison of Rapidarc and 3D conformal RT for esophageal cancer. Phys Medica. 2012;28:S2–S3. [Google Scholar]
- 34.Wei X., Liu H., Tucker S. Risk factors for pericardial effusion in inoperable esophageal cancer patients treated with definitive chemoradiation therapy. Int J Radiat Oncol Biol Phys. 2008;70:707–714. doi: 10.1016/j.ijrobp.2007.10.056. [DOI] [PubMed] [Google Scholar]