

Abstract
Objective
Leptin alleviates hyperglycemia in rodent models of Type 1 diabetes by activating leptin receptors within the central nervous system. Here we delineate whether non-canonical leptin signaling through the Creb-regulated transcriptional coactivator 1 (Crtc1) contributes to leptin-dependent improvements in diabetic glucose metabolism.
Methods
We employed mice with a targeted genetic disruption of Crtc1, tracer dilution techniques and neuroanatomical studies to interrogate whether Crtc1 enables leptin to improve glucose metabolism in streptozotocin-induced (STZ) diabetes.
Results
Here we show that leptin improves diabetic glucose metabolism through Crtc1-dependent and independent mechanisms. We find that leptin reduces diabetic hyperglycemia, hepatic gluconeogenic gene expression and selectively increases glucose disposal to brown adipose tissue and heart, in STZ-diabetic Crtc1WT mice but not Crtc1+/− mice. By contrast, leptin decreases circulating glucagon levels in both STZ-diabetic Crtc1WT and Crtc1+/− mice. We also demonstrate that leptin promotes Crtc1 nuclear translocation in pro-opiomelanocortin (Pomc) and non-Pomc neurons within the hypothalamic arcuate nucleus (ARC). Accordingly, leptin's ability to induce Pomc gene expression in the ARC is blunted in STZ-diabetic Crtc1+/− mice.
Conclusions
Our study reveals that Crtc1 functions as a conduit for leptin's glucoregulatory actions in insulin-dependent diabetes. This study also highlights a new role for Crtc1 in modulating peripheral glucose metabolism.
Keywords: Leptin, Type 1 diabetes, Glucose, Hypothalamus, Creb-regulated transcriptional coactivator 1
1. Introduction
In addition to regulating appetite and body weight homeostasis, leptin modulates glucose metabolism through food-intake independent mechanisms [1–4]. Studies in Type 1 diabetic rodent models have demonstrated that leptin can normalize diabetic hyperglycemia and increase survival without concomitant insulin therapy [5–7]. While it is established that leptin exerts its antidiabetic effects through actions within the brain [5–8], the signaling mechanisms, responsible neurocircuits and respective glucoregulatory functions remain to be defined.
Leptin binding to leptin receptors (Leprs) initiates Lepr oligomerization and signaling from Janus kinase 2 (Jak2) to signal transducer and activator of transcription 3 (Stat3), the canonical transcriptional effector of leptin action [9–11]. Leptin also signals through a transcriptional coactivator predominantly expressed in the brain, Creb-regulated transcriptional coactivator 1 (Crtc1), to modulate energy balance and reproductive function [12–14]. Leptin enhances Crtc1 dephosphorylation and nuclear translocation in the ARC, leading to increased expression of cocaine and amphetamine regulated transcript (Cart) and kisspeptin (Kiss1), which encode neuropeptides that regulate satiety and reproduction, respectively [12,15]. Accordingly, leptin stimulates Crtc1-occupancy of the Cart and Kiss1 promoters in the mediobasal hypothalamus of Ob/Ob mice [12]. Moreover, Crtc1−/− mice are hyperphagic, mildly obese, and resistant to the anorectic effects of leptin despite intact canonical signaling to Stat3 [12]. This suggests that Crtc1 may function in a signaling pathway downstream of leptin that is independent of Stat3. While these data highlight the importance of Crtc1 as an alternate transcriptional mediator of leptin control over energy and reproductive homeostasis, it is unclear whether Crtc1 is also necessary for leptin-dependent regulation of glucose metabolism. Given the emerging role for leptin in alleviating hyperglycemia in rodent models of type 1 diabetes (T1DM) [5–7,16–19], we sought to delineate whether Crtc1 contributes to the glucose lowering effects of leptin.
2. Methods
2.1. Animal studies
All animal studies were approved by the Sanford–Burnham Medical Research Institute IACUC. All mice were housed in a specific pathogen-free facility maintained at 22.8 ± 1.1 °C and 30–70 % humidity. Mice were group-housed under a 12 h light–dark cycle with free access to water, a standard chow diet (Teklad 2916), and nestlets for enrichment unless otherwise specified. Crtc1 mutant mice, described previously [12], were backcrossed for 10 generations on a C57BL/6N (Harlan) background.
Intraperitoneal glucose tolerance tests were performed in 10–14 week old male Crtc1+/− and Crtc1WT littermates after an overnight (16 h) fast, as described previously [12]. Blood was collected via the tail into EDTA-coated capillary tubes (StatSpin), transferred to microcentrifuge tubes, and kept on ice. Blood was centrifuged for 15 min at 2000 g at 4 °C, and stored at −80 °C till analysis.
Insulin-deficient diabetes was induced in 10–14 week old male Crtc1+/− and Crtc1WT littermates via 5 days of daily streptozotocin (STZ; i.p. 50 mg/kg) injection [20]. Five days after the final STZ injection, blood glucose levels were measured from the tail vein using an AlphaTrak2 glucometer (Abbott). Mice with blood glucose levels >300 mg/dL for at least 2 consecutive days were considered diabetic and randomized to treatment groups. Mice were single housed for at least 72 h prior to initiating treatments. Ten to twelve days after the final STZ injection, treatments with vehicle (20 mM Tris, pH 8) or leptin (carrier free, R&D Systems) were initiated, as indicated. At the end of the study, mice were anesthetized with chloral hydrate (1.2 g/kg, i.p.) and euthanized via decapitation or transcardial fix-perfusion. Following decapitation, a region enriched for the ARC was microdissected, as described previously [12]. Non-fixed peripheral tissues were dissected and snap-frozen in liquid nitrogen. Prior to euthanasia, whole blood was obtained by cardiac puncture for serum measurements. Whole blood was transferred to serum separator tubes (BD) and allowed to clot for 30 min at room temperature prior to centrifugation at 1500 g for 15 min at 4 °C. Serum was aliquoted and stored at −80 °C until analysis.
Glucose kinetics were determined in a separate cohort of STZ-diabetic Crtc1WT and Crtc1+/− mice. Following confirmed hyperglycemia, catheters were surgically implanted into the left jugular vein and right carotid artery, as described previously [21]. Post-surgery, mice were single housed and allowed to recover for 4–5 days before initiating vehicle or leptin treatment (1 mg/kg, i.p., q.d. × 3d). On the last day of treatment, mice were fasted for 5 h for glucose turnover and tissue glucose uptake analyses. One hour into the fast, mice received the last treatment dose. After 3 h of fasting a primed continuous infusion of 3-[3H]-glucose (3 μCi prime, 0.05 μCi per min continuous; Perkin Elmer) was initiated. A bolus of 2-[14C]-deoxyglucose (12 μCi; PerkinElmer) was administered after 5 h of fasting. Arterial or tail vein blood samples were obtained 2, 15, 25 and 35 min after bolus injection for blood glucose and plasma 2-[14C]-deoxyglucose and/or 3-[3H]-glucose determinations. After 5 h 35 min of fasting, mice were anaesthetized with sodium pentobarbital and the soleus, gastrocnemius (Gastroc), superficial vastus lateralis (SVL), interscapular brown adipose tissue (iBAT), heart and brain were excised and snap-frozen. Plasma levels of 3-[3H]-glucose and 2-[14C]-deoxyglucose and tissue levels of 2-[14C]-deoxyglucose-6-phosphate were quantified as described previously [21]. The rates of glucose appearance (Ra) and disappearance (Rd) were calculated using Steele's non-steady state equations [22]. Glucose concentration–dependent and –independent indices of tissue glucose uptake, (Rg and Kg, respectively) were calculated as described [23].
The effects of central leptin treatment were determined in a separate cohort of STZ-diabetic Crtc1WT and Crtc1+/− mice. Following confirmed hyperglycemia, mice were anesthetized with isoflurane (2–4% for induction, 0.8–1.5% maintenance) and underwent stereotaxic surgery as described previously [12] with the following modifications. A 26 gauge guide cannula (Plastics One) was positioned within the lateral ventricle using targeting coordinates based on the Franklin and Paxinos mouse brain atlas [24]. The implantation coordinates were located relative to bregma at anteroposterior −0.7, mediolateral +1.16, dorsoventral −2.0. Two support dental screws were positioned 3–4 mm rostral to the cannula. The cannula and support screws were fixed in place using dental cement. The incision was closed with wound clips. A dummy cannula was inserted into the guide cannula until the time of injection. After surgery, mice were single housed and allowed to recover 4–5 days. The drinking response to angiotensin II (1 μg, i.c.v.) was used to verify placement and patency of the cannula. Injections were performed by connecting the guide cannula to a Hamilton syringe controlled by a UMP-3 microinjector and SYS-MICRO4 controller (World Precion Instruments). Injections were performed at a rate of 10 nL/min. Leptin was dissolved in artificial cerebrospinal fluid.
2.2. Serum hormone measurements
Serum leptin and insulin were measured by a multiplex analyte assay (Millipore) on a Luminex 200 instrument. Serum corticosterone and glucagon were quantified by ELISA (Arbor Assays and R&D Systems, respectively).
2.3. Relative quantitative real-time PCR (qPCR)
Total RNA was extracted from tissue homogenized in Trizol (Invitrogen). cDNAs were synthesized with iScript (Bio-Rad). qPCR was performed using SsoFast Evagreen reagent (BioRad) and a LightCycler 480 Instrument (Roche). Quantification of mRNA levels was performed using the LightCycler 480 Software and normalized to L32 expression. Primer sequences are listed in Supplementary Table 1.
2.4. Immunoblotting
Tissue lysates were prepared as described [12]. Pck1 and Hsp90 protein levels were detected by immunoblot using antibodies from Cayman Chemical and Santa Cruz Biotechnology, respectively. Band densitometry was conducted using QuantityOne Software (Bio-Rad).
2.5. Immunostaining and microscopy analysis
Free-floating 30 μm brain sections were prepared from transcardially fix-perfused mice, as described [12]. Brain sections from each experimental group were processed concurrently to ensure comparable staining between animals/treatments. For all immunostaining, brain sections were blocked and primary/secondary antibodies were diluted in a solution containing 1% donkey serum (Jackson Immunoresearch), 0.03% Triton X-100, and 0.05 M potassium phosphate-buffered saline (K-PBS). When applicable, avidin and biotin blocking was performed according to the manufacturer's protocol (Vector Labs).
Immunohistochemical staining for pStat3(Y705) (#9145, Cell Signaling Technologies; 1:1000, 16 h at 4 °C) was performed on equally spaced series' of brain sections as reported [12,25]. Brightfield images were obtained by whole slide scanning with a 20x objective on a Scanscope XT (Aperio). Sections were matched by tissue comparison with the Franklin and Paxinos mouse brain atlas [24]. Neuroanatomical areas and distance from bregma were approximated based on this atlas. The number of pStat3(Y705) immunoreactive cells was quantified bilaterally for a given area at the rostro-caudal level indicated. Immunostained nuclei and areas with background staining were selected with a fixed 10 pixel diameter circle in the GNU Image Manipulation Program. The number of nuclei and mean gray values were quantitated in ImageJ. The threshold for positive-labeling was set at twice the mean gray value of background staining.
Immunofluorescent staining was conducted on free-floating brain sections matched at the rostro-caudal level. Brain sections were processed as reported [12] with the following modifications. For Crtc1 immunofluorescent staining, sections were incubated for 2 h at room temperature followed by 16 h at 4 °C with the Crtc1 antibody (#6938 PBL-M, Salk Institute; 1:500) shown to specifically label Crtc1 in Supplementary Figure 3A and previously [12]. The Crtc1 antisera was pre-adsorbed to bovine thyroglobulin (Sigma). Sections were washed, incubated for 1 h at room temperature with biotin-labeled donkey anti-rabbit (Jackson Immunoresearch; 1:1000), washed and incubated with avidin-biotin complex (Vector Labs). Sections were then incubated with 5 μM fluorescein isothiocyanate (FITC)-tyramide in a buffer containing 50 mM Tris pH 8.0, 137 mM NaCl, 1 mM imidazole, and 0.003% H2O2 for signal amplification and fluorescence labeling. Mounted brain sections were coverslipped (170 ± 5 μm cover glass, Bioscience Tools) with Vectashield mounting media containing the nuclear stain, 4′,6-diamidino-2-phenylindole (DAPI; VectorLabs).
Crtc1 and α-Msh double immunostaining was performed by incubating sections with Crtc1 (1:500) and α-Msh antibodies (AB5087, Millipore; 1:500) overnight at room temperature. Crtc1 immunofluorescence was developed as above. Sections were washed and incubated for 3 h at room temperature with AlexaFluor 647–conjugated donkey anti-sheep antibody (Jackson Immunoresearch, 1:200). Sections were mounted as above. Prominent AlexaFluor 647 staining was not detected when α-Msh antisera was omitted (Supplementary Figure 3C).
Immunofluorescent images were acquired by laser-scanning confocal microscopy with an A1R confocal microscope (Nikon Instruments). Images were obtained with a Plan Apo 60x/1.40 oil objective (Nikon) and stitched with the NIS Elements AR software (Nikon). Identical acquisition settings were used for imaging each brain section from all groups within an experiment. The numbers of nuclei, immunoreactive soma and/or nuclei, and colocalization analyses were quantified in 3D stack volumes after uniform background subtraction using the NIS Elements AR software (Nikon).
Immunofluorescence and immunohistochemical staining for insulin were performed on 7 μm sections spaced 100 μm apart from paraffin-embedded pancreatic tissue obtained from fix-perfused mice. The insulin antibodies were from US Biologicals and Dako. Confocal fluorescent images and brightfield images were obtained as described above for brain sections. Analyses were performed in Nikon Elements and Aperio software, respectively.
2.6. Statistical analysis
Data are presented as the mean ± SEM. Statistical analyses were performed in GraphPad Prism (GraphPad Software Inc.). Unpaired t-tests were used for comparisons between two groups. A two-way ANOVA followed by Tukey's post-hoc test was used to determine statistical significance for more than two groups with two factors.
3. Results
3.1. Leptin alleviates diabetic hyperglycemia and hyperglucagonemia through Crtc1-dependent and -independent mechanisms
To investigate whether Crtc1 contributes to leptin-dependent improvements in diabetic hyperglycemia, we induced diabetes in Crtc1+/− and Crtc1WT littermates with an STZ regimen and examined the effects of daily vehicle or leptin (1 mg/kg, i.p., q.d. × 3d) treatment. Crtc1+/− mice exhibit an intermediate phenotype compared to Crtc1−/− mice with respect to food consumption and body weight [12]. Since reduction of diabetic hyperphagia is also associated with improvements in diabetic glycemia [6], we studied Crtc1+/− animals to minimize the influence of these parameters on glucose metabolism. Additionally, dosing was performed 3 h after the onset of the light cycle to minimize effects on food intake.
In line with previous findings [12], immunoblot analysis revealed that Crtc1 protein is approximately 50% lower in brains of Crtc1+/− mice than in Crtc1WT mice (Supplementary Figure 1A). Importantly, prior to STZ treatment Crtc1+/− mice do not show impaired glucose clearance following an i.p. glucose tolerance test when compared to Crtc1WT mice (Supplementary Figure 1B). The blood glucose area under the curve was similar between Crtc1WT and Crtc1+/− mice (Supplementary Figure 1B). Moreover, fasting plasma insulin levels were similar between Crtc1WT and Crtc1+/− mice (0.088 ± 0.059 and 0.035 ± 0.035 ng/mL, respectively; Supplementary Figure 1B). Plasma insulin levels in Crtc1WT and Crtc1+/− mice rose to 0.406 ± 0.134 ng/mL and 0.472 ± 0.125 ng/mL (P < 0.05, N = 5; Supplementary Figure 1B) respectively, 30 min after glucose injection. Together these data demonstrate that Crtc1+/− mice do not display overt impairments in glucose clearance following a glucose challenge.
STZ treatment resulted in a loss in body weight in both genotypes when compared to the body weights prior to STZ treatment (Supplementary Figure 1C). However, no differences in body weight were evident between STZ-diabetic Crtc1+/− and Crtc1WT mice prior to or following vehicle or leptin treatment (Table 1). Leptin did not significantly impact daily or cumulative food intake in either STZ-diabetic Crtc1WT or Crtc1+/− mice (Table 1). Accordingly, changes in body weight were similar between vehicle- and leptin-treated mice of both genotypes (Table 1).
Table 1.
Body weight and food intake parameters.
| STZ-Crtc1WT |
STZ-Crtc1+/− |
|||
|---|---|---|---|---|
| Vehicle |
Leptin |
Vehicle |
Leptin |
|
| (N = 12–16) | (N = 15–16) | (N = 10–17) | (N = 11–18) | |
| Body weight | ||||
| Day 0 (g) | 23.9 ± 0.5 | 24.2 ± 0.7 | 23.0 ± 0.5 | 24.0 ± 0.6 |
| Day 2 (g) | 23.6 ± 0.5 | 23.6 ± 0.7 | 22.3 ± 0.5 | 23.7 ± 0.6 |
| % change | −1.0 ± 0.7 | −2.6 ± 0.5 | −3.0 ± 0.7 | −1.4 ± 0.5 |
| Food intake | ||||
| Cumulative (g) | 9.7 ± 0.9 | 9.6 ± 0.9 | 8.5 ± 1.0 | 7.8 ± 0.8 |
| Daily (g) | 4.8 ± 0.5 | 4.8 ± 0.5 | 4.3 ± 0.5 | 3.9 ± 0.4 |
Body weight, daily and cumulative food intake do not differ between vehicle- (Veh) and leptin- (Lep) treated (i.p. 1 mg/kg, q.d. × 3d) STZ-diabetic Crtc1WT and Crtc1+/− mice.
Prior to treatment, blood glucose levels were similar between STZ-diabetic Crtc1WT and Crtc1+/− mice (531 ± 31 and 580 ± 39 mg/dL, respectively; Figure 1A). Leptin (1 mg/kg, i.p., q.d. × 3d) lowered blood glucose levels in STZ-diabetic Crtc1WT mice when compared to vehicle-treated control STZ-diabetic Crtc1WT mice (443 ± 25 vs. 531 ± 31 mg/dL, respectively, P < 0.05, N = 14–21; Figure 1A). Vehicle-treated STZ-diabetic Crtc1WT mice exhibited a rise in blood glucose from pre-treatment levels, whereas leptin-treated STZ-diabetic Crtc1WT showed a lowering in circulating glucose relative to pre-treatment levels (Figure 1A). By contrast, STZ-diabetic Crtc1+/− littermates were refractory to the anti-hyperglycemic effects of leptin (Figure 1A). Blood glucose levels were 580 ± 39 mg/dL and 561 ± 25 mg/dL in vehicle- and leptin-treated STZ-diabetic Crtc1+/− mice.
Figure 1.

Crtc1 is necessary for leptin to improve diabetic hyperglycemia but not hyperglucagonemia. A) Blood glucose levels in STZ-diabetic Crtc1WT and Crtc1+/− mice prior to (left; PreTx) and following (middle; PostTx) vehicle or leptin treatment (Veh or Lep; i.p. 1 mg/kg, q.d. × 3d). Percent change in blood glucose levels from pre-treatment values (right). B) Serum levels for glucagon, corticosterone, insulin and leptin. Metabolic parameters were determined 4 h after the last treatment dose. *P < 0.05 compared to Veh treatment within genotype. #P < 0.05 compared to Crtc1WT within treatment. N = 14–21 mice per group for A and N = 8–21 mice per group for B.
Leptin's ability to lower blood glucose levels in rodent models of T1DM is associated with reduced circulating glucagon [5,26–28] or corticosterone levels [5,29]. Therefore we explored the possibility that leptin's inability to reduce hyperglycemia in STZ-diabetic Crtc1+/− mice may reflect impaired leptin regulation of glucagon and/or corticosterone secretion. In vehicle-treated STZ-diabetic Crtc1WT and Crtc1+/− mice, serum leptin concentrations were very low and did not differ between the genotypes (0.087 ± 0.023 and 0.160 ± 0.049 ng/mL, respectively). As expected, leptin treatment resulted in increased circulating leptin levels in both genotypes (Figure 1B). Consistent with previous findings [5,26–28], leptin reduced serum glucagon in STZ-diabetic Crtc1WT mice (Figure 1B). Notably, leptin also lowered serum glucagon in STZ-diabetic Crtc1+/− mice (Figure 1B). In parallel, while insulin levels were very low in vehicle-treated STZ-diabetic Crtc1WT and Crtc1+/− mice (0.081 ± 0.031 and 0.090 ± 0.033 ng/mL, respectively), leptin increased circulating insulin levels to 0.572 ± 0.175 and 0.330 ± 0.115 ng/mL in STZ-diabetic Crtc1WT and Crtc1+/− mice, respectively. Insulin levels were not significantly different between leptin-treated STZ-diabetic Crtc1WT and Crtc1+/− mice. By contrast, no significant differences were detected for serum corticosterone levels between vehicle- and leptin-treated mice of either genotype (Figure 1B). Thus, leptin alleviates hyperglucagonemia in STZ-diabetes via Crtc1-independent mechanisms.
Because we observed a significant increase in insulin levels with leptin treatment, we determined if this reflects the presence of residual β-cells within the pancreas of STZ-diabetic mice. Immunohistochemical and immunofluorescence staining for insulin revealed the existence of insulin-positive β-cells within islets of STZ-diabetic mice (Supplementary Figure 2). Analysis of confocal images showed that in nondiabetic and STZ-diabetic islets, insulin-positive β-cells account for 61.3% and 52.2% of cells within the islet, respectively. However, the number of pancreatic islets was reduced in STZ-diabetic mice when compared to non-diabetic animals (16.4 ± 0.9 vs 42.8 ± 1.2 islets, P<0.05, N = 2–4). Similarly, pancreatic islets in STZ-diabetic mice were significantly smaller than islets in non-diabetic mice (3781 ± 573 vs 10,167 ± 426 μm2, P<0.05, N = 2–4). Thus, these data suggest that residual β-cells exist within the pancreas of STZ-diabetic mice and leptin enhances insulin secretion from these residual β-cells.
3.2. Acute leptin treatment promotes Crtc1 nuclear translocation in STZ-diabetic mice
Crtc1 is a transcriptional coactivator that is regulated by nucleocytoplasmic shuttling [12,30–33]. In leptin-deficient, hyperinsulinemic Ob/Ob mice, acute leptin treatment triggers Crtc1 nuclear translocation in the ARC [12]. Given the impact of reduced Crtc1 expression on leptin's ability to improve glucose homeostasis in STZ-diabetes, we sought to determine if leptin promotes Crtc1 nuclear localization in ARC neurons, in the setting of insulin-dependent diabetes. In particular, we examined the effect of a single vehicle or leptin dose (1 mg/kg, i.p.) on Crtc1 subcellular localization within the ARC. Immunolabeling for Crtc1 revealed that within 30 min of a single leptin treatment, Crtc1 subcellular localization is altered in ARC neurons of STZ-diabetic mice (Figure 2A). Quantitative confocal colocalization analyses further confirmed that while the number of Crtc1-positive (Crtc1+) cells in the ARC is not altered by leptin, there is an increase in the percentage of cells with nuclear Crtc1 staining (Figure 2B). In vehicle-treated STZ-diabetic mice, Crtc1 is predominantly localized in the cytoplasm of ARC cells, whereas following a single leptin dose, Crtc1 resides in the cytoplasm and nucleus, or is exclusively nuclear (Figure 2B).
Figure 2.
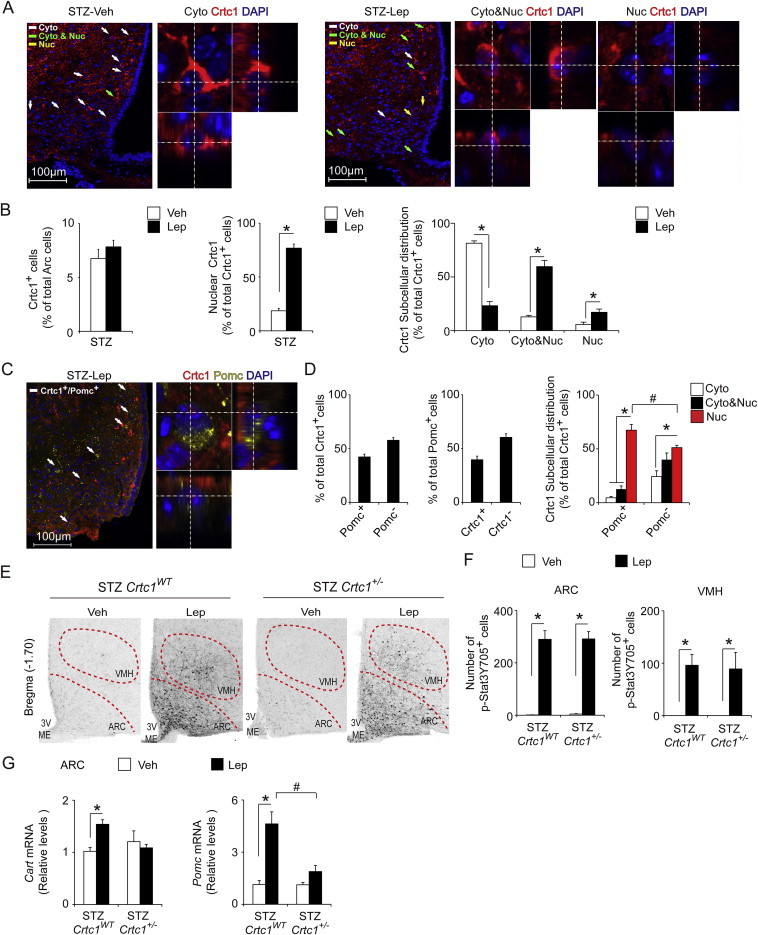
Crtc1 responds to leptin and contributes to leptin-stimulated gene expression in the ARC. A) Representative confocal immunofluorescent images of Crtc1 (red) and DAPI (blue) in the ARC (Bregma −1.70) of STZ-diabetic mice acutely treated with Veh or Lep (i.p. 1 mg/kg, 30 min). Examples of cells with cytoplasmic (Cyto), cytoplasmic and nuclear (Cyto&Nuc), or exclusively nuclear (Nuc) Crtc1 distribution are denoted by white, green, or yellow arrows, respectively. Also shown are higher magnifications of cells with Cyto, Cyto&Nuc and Nuc Crtc1 localization in the x-y, x-z and y-z axes. B) Graphs showing the percent number of Crtc1+ cells in the ARC (left), percentage of Crtc1+ cells with nuclear Crtc1 localization (middle) and the subcellular distribution of Crtc1 (right) in Veh- and Lep-treated (i.p., 1 mg/kg, 30 min) STZ-diabetic mice (N = 5–6). C) Representative confocal immunofluorescent images of Crtc1 (red), α-MSH (yellow) and DAPI (blue) in the ARC of Lep-treated (i.p. 1 mg/kg, q.d. × 3d, 30 min) STZ-diabetic mice. White arrows denote cells with Crtc1 and α-MSH co-staining. A higher magnification in the x-y, x-z and y-z axes of a cell with Nuc Crtc1 and soma co-stained for α-MSH. D) Quantitative analyses of mid-level ARC sections (Bregma −1.70; N = 5) showing the percentage of ARC Crtc1+ cells that do or do not co-express α-MSH, (Pomc+ or Pomc−, respectively; left); the percentage of ARC Pomc+ cells that do or do not co-express Crtc1, (Crtc1+ or Crtc−, respectively; middle); and the subcellular localization of Crtc1 in Pomc+ and Pomc− cells (right). E) Representative brightfield images of ARC and VMH p-Stat3 Y705 immunostaining in Veh- and Lep-treated (i.p. 1 mg/kg, q.d. × 3d, 30 min) STZ-diabetic Crtc1WT and Crtc1+/− mice. F) Graphs showing the number of ARC and VMH cells with pStat3 Y705 immunostaining in Veh- and Lep-treated (i.p. 1 mg/kg, q.d. × 3d, 30 min) STZ-diabetic Crtc1WT and Crtc1+/− mice (N = 3–5). G) qPCR analyses for Cart and Pomc mRNA levels in the ARC of Veh- and Lep-treated (i.p. 1 mg/kg, q.d. × 3d, 4 h) STZ-diabetic Crtc1WT and Crtc1+/− mice (N = 4–10). *P < 0.05 for a comparison within a group. #P < 0.05 for a comparison between groups within the same factor.
Next, we determined whether leptin promotes Crtc1 nuclear translocation specifically in ARC Pomc neurons by double immunofluorescent staining for Crtc1 and α-melanocyte stimulating hormone (α-Msh), a neuropeptide derived from cleavage of the Pomc peptide [34]. For this analysis, we used brain sections from STZ-diabetic mice treated for 3 days with leptin, since we detected very few soma immunolabeled for α-Msh following acute leptin treatment (Supplementary Figure 3B). Following 3 days of leptin treatment, Crtc1 was detected in the nucleus in 85.5 ± 3.0% (N = 5) of ARC Crtc1+ neurons. In approximately 42% of ARC Crtc1+ neurons, the soma were co-labeled with α-Msh. In these ARC Pomc+ Crtc1 neurons, Crtc1 was primarily detected within the nucleus (Figure 2C,D). In the remaining ARC non-Pomc Crtc1 neurons, the majority of Crtc1 was distributed to both the cytoplasm and nucleus, or was exclusively nuclear (Figure 2C). Of note, Crtc1 was detected in a significant number of neurons labeled with α-Msh in the soma. Specifically, Crtc1+ Pomc neurons accounts for roughly 42% of total Pomc neurons in the mid-level ARC (Figure 2D). These data are consistent with ARC Pomc neurons being a heterogeneous population [35–37].
3.3. STZ-diabetic Crtc1+/− mice show impaired leptin-induced gene changes in the ARC despite intact leptin stimulation of p-Stat3(Y705)
Since leptin acutely regulates Crtc1 and diminished Crtc1 expression impairs leptin's ability to alleviate diabetic hyperglycemia, we determined if Crtc1+/− mice exhibit altered leptin signaling within the brain. Immunohistochemical staining across series' of brain sections revealed that leptin robustly increased p-Stat3(Y705) in the ARC, ventromedial hypothalamus (VMH), dorsomedial hypothalamus (DMH) and nucleus of the solitary tract (NTS) in both STZ-diabetic Crtc1WT and Crtc1+/− mice (Figure 2E and Supplementary Figure 4). Increased p-Stat3(Y705) staining was also evident in other areas known to express functional leptin receptors (Lepr), including the periaqueductal gray area (data not shown) [38–41]. The total number of p-Stat3(Y705) positive cells in the ARC, VMH, DMH and NTS did not differ between vehicle- or leptin-treated STZ-diabetic Crtc1WT and Crtc1+/− mice (Figure 2E,F and Supplementary Figure 4). Hence, a loss of leptin signaling to Stat3 in hypothalamic and brainstem nuclei does not account for the blunted responses of STZ-diabetic Crtc1+/− mice to leptin.
Because leptin promotes Crtc1 nuclear translocation in the ARC, we further assessed if diminished Crtc1 function impacts leptin regulation of key genes in the ARC. In vehicle-treated animals, no differences in Cart or Pomc transcripts were detected in the ARC between the two genotypes (Figure 2G). As expected, leptin treatment stimulated both Cart and Pomc gene expression in the ARC of STZ-diabetic Crtc1 WT mice, and these effects were blunted in STZ-diabetic Crtc1+/− mice (Figure 2G). Hence, Crtc1 is necessary for leptin to induce Cart and Pomc gene expression in the ARC.
3.4. Leptin modulates metabolic gene expression and enhances glucose uptake in peripheral tissues via Crtc1
Improved circulating glucose levels may reflect changes in the rates of hepatic glucose output and/or tissue glucose uptake. To begin to analyze this, we examined the impact of reduced Crtc1 function on leptin regulation of genes involved in glucose metabolism in liver and soleus muscle. Consistent with the glucose-lowering effects of leptin, hepatic expression of Pck1 and Ppargc1a, key regulators of hepatic gluconeogenesis [42], were decreased relative to vehicle-treated STZ-diabetic Crtc1WT mice. By contrast, leptin treatment failed to lower Pck1 and Ppargc1a mRNA levels in the livers of STZ-diabetic Crtc1+/− animals (Figure 3A). Immunoblot analyses further showed that leptin suppression of Pck1 transcripts translates to a reduction in Pck1 protein levels (Figure 3A). In soleus muscle, leptin stimulated Ppargc1a gene expression but did not modulate expression of the glucose transporters, Glut1 and Glut4 (Figure 3B).
Figure 3.
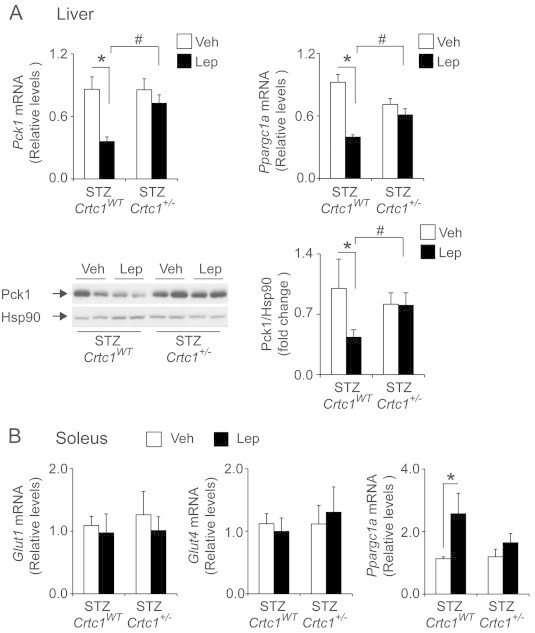
Leptin is unable to modulate metabolic gene expression in liver and soleus in STZ-diabetic Crtc1+/− mice. A) qPCR analyses showing Lep (i.p. 1 mg/kg, q.d. × 3d) reduces hepatic Pck1 and Ppargc1a gene expression (top left and right, respectively) in STZ-diabetic Crtc1WT but not Crtc1+/− mice (N = 8–12). Western blot and densitometric analyses showing Lep suppresses Pck1 protein levels in STZ-diabetic Crtc1WT but not Crtc1+/− mice (N = 4–16). Heat shock protein 90 (Hsp90) levels are shown as loading controls. B) qPCR analyses showing mRNA levels for Glut1, Glut4, and Ppargc1a mRNA levels in soleus of STZ-diabetic Crtc1WT and Crtc1+/− mice treated with Veh or Lep (i.p. 1 mg/kg, q.d. × 3d; N = 10–16). Transcript levels were determined 4 h after the last treatment dose. *P < 0.05 compared to Veh treatment within genotype. #P < 0.05 compared to Crtc1WT within treatment.
Next, we directly examined the functional contribution of Crtc1 to leptin-driven changes in glucose metabolism in STZ-diabetes by employing tracer dilution techniques. In the post-absorptive state, leptin treatment (i.p. 1 mg/kg, q.d. × 3d) did not suppress endogenous Ra, a marker of hepatic glucose production, or stimulate whole-body glucose disappearance (Rd) in either genotype when compared to vehicle treatment (Figure 4A). Similarly, no changes in brain and skeletal muscle glucose uptake were evident between leptin- and vehicle-treated STZ-diabetic mice of either genotype (Supplementary Figure 5). Neither the glucose metabolic index (Rg) or glucose clearance (Kg) for skeletal muscle was altered by leptin treatment (Supplementary Figure 5). However, leptin significantly enhanced iBAT and myocardial glucose uptake in STZ-diabetic Crtc1WT mice (Figure 4B–C). In leptin-treated STZ-diabetic Crtc1WT mice, glucose clearance by iBAT and heart was significantly greater than in vehicle-treated mice. Similarly, iBAT Rg was increased in leptin-treated STZ-diabetic Crtc1WT animals, demonstrating that leptin also enhances glucose concentration-dependent glucose uptake. By comparison, leptin did not stimulate glucose uptake into iBAT or heart in STZ-diabetic Crtc1+/− mice (Figure 4B–C), further demonstrating that Crtc1 not only contributes to leptin-driven metabolic changes at the molecular level but is also important for leptin-driven increases in glucose metabolism in specific peripheral tissues.
Figure 4.

Reduced Crtc1 expression impairs leptin-stimulated iBAT and myocardial glucose uptake. A) Indices of hepatic glucose production (Ra) and whole-body glucose disposal (Rd) do not differ between Veh- and Lep-treated (i.p. 1 mg/kg, q.d. × 3d) STZ-diabetic Crtc1WT and Crtc1+/− mice. B) Leptin stimulates iBAT and heart glucose uptake in STZ-diabetic Crtc1WT but not Crtc1+/− mice. Glucose concentration-dependent and –independent glucose uptake (Rg and Kg, respectively) are shown. N = 5–6, *P < 0.05 compared to Veh treatment within genotype.
To further examine whether Crtc1 may play a direct role in these peripheral tissues, we examined Crtc1 protein expression in liver, iBAT and heart. In line with prior findings [13,43], Crtc1 protein was detected in brain but not liver, iBAT or heart (Supplementary Figure 6). Lastly, we explored whether central leptin delivery improves diabetic hyperglycemia through Crtc1. STZ-diabetic Crtc1WT and Crtc1+/− mice were treated once-daily with vehicle or leptin (100 ng, 10 ng/min, i.c.v.; q.d. × 3d). In comparison to vehicle treatment, daily and cumulative food intakes in STZ-diabetic Crtc1WT mice were significantly reduced by 32% with i.c.v. leptin-treatment (Supplementary Figure 7A). In STZ-diabetic Crtc1+/− mice, a 20% decrease in food intake was observed with i.c.v. leptin treatment, but this did not reach statistical significance (Supplementary Figure 7A). Since treatment- and genotype-dependent differences were observed for food intake, we pair-fed groups of STZ-diabetic Crtc1WT and Crtc1+/− mice with the amount of food consumed by i.c.v. leptin-treated STZ-diabetic Crtc1WT mice. As anticipated, i.c.v. leptin treatment resulted in a 39.6 ± 4.0% lowering in blood glucose levels from pre-treatment levels in STZ-diabetic Crtc1WT mice. The glucose-lowering effects observed with i.c.v. leptin treatment were not solely dependent on food-intake, since pair-feeding resulted in a 5.6 ± 5.6% decline in blood glucose in STZ-diabetic Crtc1WT mice. By contrast, i.c.v leptin-treatment failed to improve hyperglycemia in STZ-diabetic Crtc1+/− mice. These data suggest that Crtc1 is necessary for both peripheral and central leptin treatment to improve diabetic hyperglycemia.
4. Discussion
In the current study, we examined the significance of Crtc1 in leptin's glucoregulatory functions in uncontrolled diabetes. Collectively, our data show that leptin improves diabetic glucose metabolism through both Crtc1-dependent and -independent mechanisms. In particular, we demonstrate that Crtc1 is necessary for leptin-dependent improvements in glycemia and metabolic gene regulation in liver and soleus muscle in the setting of insulin-dependent diabetes. Furthermore, we establish a previously undescribed role for Crtc1 in leptin-stimulated glucose disposal to brown adipose tissue and heart. By contrast, our data reveal that Crtc1 is not essential for leptin to alleviate hyperglucagonemia in STZ-diabetic mice. In addition, we find that in STZ-diabetes, leptin promotes Crtc1 nuclear translocation within the ARC and specifically in Pomc and non-Pomc neurons. Moreover, leptin stimulation of Cart and Pomc gene expression in the ARC is dampened in STZ-diabetic Crtc1+/− mice. Lastly, we demonstrate that reduced expression of Crtc1 does not significantly impair leptin's ability to stimulate Stat3 Y705 phosphorylation in hypothalamic and hindbrain nuclei.
Although the anti-diabetic actions of leptin are initiated by leptin signaling within the brain [7,8], the responses of peripheral tissues drive leptin-dependent improvements in glucose metabolism. Earlier studies have linked leptin's anti-diabetic actions with suppression of hyperglucagonemia [5,26–28]; however recent studies have decoupled leptin's ability to normalize blood glucose levels from its anti-hyperglucagonemic effects in uncontrolled diabetes [29,44]. Here, we confirm that leptin reduces serum glucagon levels and improves diabetic hyperglycemia in STZ-diabetic Crtc1WT mice. However, we also find that leptin lowers glucagon concentrations to the same extent in STZ-diabetic Crtc1+/− animals, which are unresponsive to the anti-hyperglycemic actions of leptin. Thus, these data support prior evidence [29] that leptin's glucose lowering effects can be uncoupled from its ability to suppress hyperglucagonemia. These findings also reveal that leptin employs a Crtc1-independent mechanism to lower glucagon levels in Type 1 diabetic rodents.
While previous reports provide compelling evidence that leptin decreases glucagon levels through an insulin-independent mechanism [6], we cannot exclude this possibility in our study. Although insulin levels were very low in vehicle-treated STZ-diabetic Crtc1WT and Crtc1+/− mice (≤0.075 ng/mL), leptin significantly increased insulin levels in both genotypes. This discrepancy is attributed to the presence of residual β-cells, which survive STZ treatment in our model. In this regard, it is noteworthy that short-term intravenous leptin infusion has been shown to increase circulating insulin in Ob/Ob mice [1].
In the present study, the glucose-lowering effects of leptin are associated with enhanced glucose uptake into iBAT and heart. Notably, our data implicate Crtc1 as a mediator for these metabolic changes. Because we and others find that leptin enhances iBAT glucose uptake [5,8,28], leptin-stimulated iBAT thermogenesis may underlie leptin's anti-diabetic actions. This is an attractive possibility since BAT recruitment improves glucose metabolism in humans [45]. Moreover, increasing BAT abundance through transplantation improves glucose homeostasis dose-dependently in non-diabetic mice [46]. Also, Crtc1−/− mice have reduced energy expenditure compared to Crtc1WT mice [12], but the mechanism responsible for this phenotype has not been delineated. Lastly, both the glucoregulatory and thermogenic effects of leptin are independent of leptin's anorexigenic actions [1,2,6,19,47]. Further studies are necessary to directly examine the contribution of leptin-stimulated thermogenesis in improving diabetic glucose metabolism. In addition, it is currently unknown whether Crtc1 contributes to iBAT thermogenesis in response to leptin, cold exposure and/or high-fat feeding.
Leptin also influences hepatic glucose metabolism in uncontrolled diabetes [5,8,29]. In addition to leptin acutely reducing gluconeogenic substrate availability [29], data from our laboratory and others suggest that molecular changes in Pck1 mRNA and protein levels [5,8,27,29] may provide a positive feed-forward mechanism for leptin suppression of hepatic gluconeogenic flux. Importantly, we find that Crtc1 is necessary for these leptin-driven molecular changes in liver. Despite these compelling data, we did not observe significant changes in whole body endogenous glucose production following leptin treatment. This is in contrast to the inhibition of endogenous glucose production observed with chronic central leptin delivery [5], but may be consistent with molecular changes preceding alterations in metabolic flux. Alternatively, peripheral leptin treatment may reduce hepatic gluconeogenic flux, but not overall hepatic glucose production. Nevertheless, our study supports literature evidence for both a reduced capacity for hepatic gluconeogenesis and enhanced tissue glucose uptake as likely mechanisms that contribute to leptin's ability to alleviate diabetic hyperglycemia [5,8,28]. Importantly, our data implicates Crtc1 as a conduit for these glucoregulatory actions of leptin.
Although Crtc1 is highly expressed in the brain [12–14] and the anti-diabetic actions of leptin are initiated by leptin signaling within the brain [5–7], the specific neuronal populations in which Crtc1 contributes to leptin-dependent improvements in diabetic glucose metabolism remain unclear. In line with the heterogeneity of ARC Pomc neurons [48–50], we find that less than half of Pomc neurons in the mid-level ARC co-express Crtc1. Importantly, our data also show that in STZ-diabetes, leptin treatment promotes Crtc1 nuclear localization within this subpopulation of ARC Pomc neurons. Supporting a role for Crtc1 function in ARC Pomc neurons, we show that leptin induction of Cart and Pomc transcripts in the ARC is impaired in STZ-diabetic Crtc1+/− animals. Considering the role of melanocortin signaling in iBAT thermogenesis [51–53], it is tempting to speculate that the blunted induction of ARC Pomc gene expression in STZ-diabetic Crtc1+/− animals may underlie the blunted leptin-stimulated glucose disposal in iBAT and glucose lowering observed in these mice.
In non-diabetic rodents the ARC is essential for leptin's glucoregulatory effects and ARC Pomc neurons play a prominent role in this regard [54]. However, in insulin-deficient diabetes Lepr expression in ARC Pomc neurons accounts for only a small portion of leptin's glucose-lowering effects [8]. Thus, Lepr signaling in ARC Pomc neurons is not sufficient to mediate all of leptin's antidiabetic actions [8]. Rather, as with many of leptin's physiological effects, it is very likely that several neuronal populations are integral for leptin to improve peripheral glucose metabolism and increase survival in insulin-deficient diabetes. Consistent with this, Lepr-expressing GABAergic and Pomc neurons collectively mediate leptin's glucose lowering and life-saving effects in type 1 diabetes [8]. It is noteworthy that leptin also induces Crtc1 nuclear localization in ARC non-Pomc neurons. Further studies are required to determine the identity of these leptin-responsive Crtc1+ neurons in the ARC. GABAergic non-Pomc neurons identifiable with Cre recombinase expression driven by the rat insulin-2 promoter, are plausible candidates since these neurons contribute to leptin-regulated BAT function [55]. Since Crtc1 nuclear translocation is coupled to calcium influx and thus neuronal activity [12,30–33], Crtc1 is poised to function as an activity-dependent transcriptional coactivator. Correspondingly, Crtc1 may play a pivotal role in leptin-excited neurons. Additional studies are necessary to test the relative metabolic and transcriptional functions of Crtc1 in ARC Pomc and non-Pomc neurons and to identify extra-ARC neurons in which Crtc1 responds to leptin.
While we demonstrate that i.c.v leptin-treatment fails to improve hyperglycemia in STZ-diabetic Crtc1+/− mice, these data do not exclude the possibility of Crtc1 playing a role in peripheral tissues. However, we did not detect Crtc1 protein levels in liver, iBAT and heart; which, implies that Crtc1 may not play a direct role in these tissues. Conditional genetic ablation and/or targeted knockdown of Crtc1 within the central nervous system and/or in specific peripheral tissues will provide clarity in this regard.
In summary, this study defines Crtc1 as a transcriptional effector that is necessary for leptin to alleviate hyperglycemia but not glucagon secretion in experimental diabetes. These data highlight a role for leptin-Crtc1 signaling in regulating metabolic gene expression in liver and soleus, and improving glucose uptake into iBAT and heart. Future studies delineating the leptin-responsive neurocircuits and their respective glucoregulatory functions may provide a foundation for the development of novel therapeutics to restore normoglycemia in Type 1 diabetes.
Acknowledgments
This work was supported by institutional funds. The authors thank Christina Chang and John Shelley for their technical assistance in immunostaining experiments. We thank Dr. Marc Montminy (Salk Institute) for providing the Crtc1 mutant mice and Crtc1 antisera.
Conflict of interest
The authors have no conflicts of interest to declare.
Appendix A. Supplementary data
The following are the supplementary data related to this article:
Supplementary Figure 1.

Baseline parameters of Crtc1+/− mice. A) Left, representative immunoblot showing Crtc1 protein levels in brain tissue from Crtc1WT, Crtc1+/− and Crtc1−/− mice. Top and bottom images are short and long exposures, respectively. Hsp90 protein levels are shown as loading controls. Right, densitometric analysis of Crtc1 immunoblots showing a reduction and loss of Crtc1 protein levels in Crtc1+/− and Crtc1−/− mice, respectively (N = 2). B) Left, graph showing blood glucose levels in Crtc1WT and Crtc1+/− mice during a glucose tolerance test (GTT; i.p., 2 g/kg). Middle, area under the curve (AUC) for blood glucose levels in Crtc1WT and Crtc1+/− mice during the GTT. Right, plasma insulin levels for Crtc1WT and Crtc1+/− mice during the GTT at 0 and 30 min. N = 9–12 mice. C) Body weights of Crtc1WT and Crtc1+/− mice prior to STZ treatment (PreSTZ) and 12 days after STZ treatment (PostSTZ). N = 30–35, *P < 0.05 compared to preSTZ treatment within genotype.
Supplementary Figure 2.

Insulin immunostaining in non-diabetic and STZ-diabetic mice related to Figure 1. A) Left (top), representative confocal immunofluorescent images showing insulin (red) and DAPI (blue) in non-diabetic and STZ-diabetic Crtc1WT mice. Middle and right (top), quantitative analyses of 2 levels of pancreatic sections showing the percent number of insulin-positive β-cells within islets. B) Left (bottom), representative brightfield image showing insulin-positive cells within islets of pancreatic sections from non-diabetic and STZ-diabetic Crtc1WT mice. Middle and right (bottom), quantitative analyses of 2 levels of pancreatic sections showing the reduced islet numbers and islet size, respectively, in non-diabetic versus STZ-diabetic Crtc1WT mice. N = 2–4, *P < 0.05 compared to non-diabetic mice.
Supplementary Figure 3.

Specificity of immunostaining related to Figure 2. A) Representative confocal immunofluorescent image showing Crtc1 (red) and DAPI (blue) in Crtc1WT ARC (Bregma −1.70). Crtc1 staining is absent in Crtc1−/− ARC. B) Representative confocal immunofluorescent image showing Crtc1 (red), α-MSH (yellow; Pomc) and DAPI (blue) in the ARC of Lep-treated STZ-diabetic mice 30 min after dosing. α-MSH staining is greater with 3days of daily Lep treatment than with acute treatment (i.p. 1 mg/kg). C) Negative control staining showing absence of AlexaFluor 647 signal (yellow) when α-MSH antibody is omitted.
Supplementary Figure 4.

Leptin signaling to pStat3 is intact in STZ-diabetic Crtc1+/− mice, related to Figure 2. A) Representative brightfield images of DMH and NTS p-Stat3 Y705 immunostaining in Veh- and Lep-treated (i.p. 1 mg/kg, q.d. × 3d, 30 min) STZ-diabetic Crtc1WT and Crtc1+/− mice. Number of immunoreactive cells is quantified in B). N = 3–5, *P < 0.05 compared to Veh treatment within genotype.
Supplementary Figure 5.

Leptin does not improve skeletal muscle glucose uptake in STZ-diabetes, related to Figure 4. A–D) Glucose uptake indices, Rg and Kg in soleus, SVL, Gastroc, and brain, respectively, in Veh and Lep-treated (i.p. 1 mg/kg, q.d. × 3d) STZ-diabetic Crtc1WT and Crtc1+/− mice. N = 5–6.
Supplementary Figure 6.

Crtc1 protein levels in brain and peripheral tissues related to Figure 4. Immunoblot for Crtc1 protein levels in brain, liver, iBAT, and heart tissue lysates (50 or 5µg protein) from Crtc1WT, Crtc1+/− and Crtc1−/− mice. Hsp90 protein levels are shown as loading controls.
Supplementary Figure 7.

Crtc1 is necessary for central leptin treatment to improve diabetic hyperglycemia. A) Body weight, daily and cumulative food intake in STZ-diabetic Crtc1WT and Crtc1+/− mice prior to and following pair-feeding (PF), vehicle (Veh) or leptin (Lep) treatment (i.c.v., 100 ng, 10 ng/min, q.d. × 3d). B) Percent change in blood glucose levels from pre-treatment values in STZ-diabetic Crtc1WT and Crtc1+/− mice following pair-feeding, vehicle or leptin treatment (i.c.v., 100 ng, 10 ng/min, q.d. for 3d). N = 5–12, *P < 0.05 compared to Lep treatment within genotype. #P < 0.05 for a comparison between groups within the same treatment.
Supplementary Table 1.

qPCR primer sequences.
References
- 1.Burcelin R., Kamohara S., Li J., Tannenbaum G.S., Charron M.J., Friedman J.M. Acute intravenous leptin infusion increases glucose turnover but not skeletal muscle glucose uptake in ob/ob mice. Diabetes. 1999;48(6):1264–1269. doi: 10.2337/diabetes.48.6.1264. [DOI] [PubMed] [Google Scholar]
- 2.Kamohara S., Burcelin R., Halaas J.L., Friedman J.M., Charron M.J. Acute stimulation of glucose metabolism in mice by leptin treatment. Nature. 1997;389(6649):374–377. doi: 10.1038/38717. [DOI] [PubMed] [Google Scholar]
- 3.Pelleymounter M.A., Cullen M.J., Baker M.B., Hecht R., Winters D., Boone T. Effects of the obese gene product on body weight regulation in ob/ob mice. Science. 1995;269(5223):540–543. doi: 10.1126/science.7624776. [DOI] [PubMed] [Google Scholar]
- 4.Halaas J.L., Gajiwala K.S., Maffei M., Cohen S.L., Chait B.T., Rabinowitz D. Weight-reducing effects of the plasma protein encoded by the obese gene. Science. 1995;269(5223):543–546. doi: 10.1126/science.7624777. [DOI] [PubMed] [Google Scholar]
- 5.German J.P., Thaler J.P., Wisse B.E., Oh I.S., Sarruf D.A., Matsen M.E. Leptin activates a novel CNS mechanism for insulin-independent normalization of severe diabetic hyperglycemia. Endocrinology. 2011;152(2):394–404. doi: 10.1210/en.2010-0890. [DOI] [PMC free article] [PubMed] [Google Scholar]
- 6.Hidaka S., Yoshimatsu H., Kondou S., Tsuruta Y., Oka K., Noguchi H. Chronic central leptin infusion restores hyperglycemia independent of food intake and insulin level in streptozotocin-induced diabetic rats. FASEB Journal. 2002;16(6):509–518. doi: 10.1096/fj.01-0164com. [DOI] [PubMed] [Google Scholar]
- 7.Fujikawa T., Chuang J.C., Sakata I., Ramadori G., Coppari R. Leptin therapy improves insulin-deficient type 1 diabetes by CNS-dependent mechanisms in mice. Proceedings of the National Academy of Sciences of the United States of America. 2010;107(40):17391–17396. doi: 10.1073/pnas.1008025107. [DOI] [PMC free article] [PubMed] [Google Scholar]
- 8.Fujikawa T., Berglund E.D., Patel V.R., Ramadori G., Vianna C.R., Vong L. Leptin engages a hypothalamic neurocircuitry to permit survival in the absence of insulin. Cell Metabolism. 2013;18(3):431–444. doi: 10.1016/j.cmet.2013.08.004. [DOI] [PMC free article] [PubMed] [Google Scholar]
- 9.Nakashima K., Narazaki M., Taga T. Leptin receptor (OB-R) oligomerizes with itself but not with its closely related cytokine signal transducer gp130. FEBS Letters. 1997;403(1):79–82. doi: 10.1016/s0014-5793(97)00013-6. [DOI] [PubMed] [Google Scholar]
- 10.Banks A.S., Davis S.M., Bates S.H., Myers M.G., Jr. Activation of downstream signals by the long form of the leptin receptor. The Journal of Biological Chemistry. 2000;275(19):14563–14572. doi: 10.1074/jbc.275.19.14563. [DOI] [PubMed] [Google Scholar]
- 11.Kloek C., Haq A.K., Dunn S.L., Lavery H.J., Banks A.S., Myers M.G., Jr. Regulation of Jak kinases by intracellular leptin receptor sequences. The Journal of Biological Chemistry. 2002;277(44):41547–41555. doi: 10.1074/jbc.M205148200. [DOI] [PubMed] [Google Scholar]
- 12.Altarejos J.Y., Goebel N., Conkright M.D., Inoue H., Xie J., Arias C.M. The Creb1 coactivator Crtc1 is required for energy balance and fertility. Nature Medicine. 2008;14(10):1112–1117. doi: 10.1038/nm.1866. [DOI] [PMC free article] [PubMed] [Google Scholar]
- 13.Song Y., Altarejos J., Goodarzi M.O., Inoue H., Guo X., Berdeaux R. CRTC3 links catecholamine signalling to energy balance. Nature. 2010;468(7326):933–939. doi: 10.1038/nature09564. [DOI] [PMC free article] [PubMed] [Google Scholar]
- 14.Wu Z., Huang X., Feng Y., Handschin C., Gullicksen P.S., Bare O. Transducer of regulated CREB-binding proteins (TORCs) induce PGC-1alpha transcription and mitochondrial biogenesis in muscle cells. Proceedings of the National Academy of Sciences of the United States of America. 2006;103(39):14379–14384. doi: 10.1073/pnas.0606714103. [DOI] [PMC free article] [PubMed] [Google Scholar]
- 15.Kristensen P., Judge M.E., Thim L., Ribel U., Christjansen K.N., Wulff B.S. Hypothalamic CART is a new anorectic peptide regulated by leptin. Nature. 1998;393(6680):72–76. doi: 10.1038/29993. [DOI] [PubMed] [Google Scholar]
- 16.Havel P.J., Uriu-Hare J.Y., Liu T., Stanhope K.L., Stern J.S., Keen C.L. Marked and rapid decreases of circulating leptin in streptozotocin diabetic rats: reversal by insulin. American Journal of Physiology. 1998;274(5 Pt 2):R1482–R1491. doi: 10.1152/ajpregu.1998.274.5.R1482. [DOI] [PubMed] [Google Scholar]
- 17.Roden M., Ludwig C., Nowotny P., Schneider B., Clodi M., Vierhapper H. Relative hypoleptinemia in patients with type 1 and type 2 diabetes mellitus. International Journal of Obesity and Related Metabolic Disorders. 2000;24(8):976–981. doi: 10.1038/sj.ijo.0801266. [DOI] [PubMed] [Google Scholar]
- 18.Sindelar D.K., Havel P.J., Seeley R.J., Wilkinson C.W., Woods S.C., Schwartz M.W. Low plasma leptin levels contribute to diabetic hyperphagia in rats. Diabetes. 1999;48(6):1275–1280. doi: 10.2337/diabetes.48.6.1275. [DOI] [PubMed] [Google Scholar]
- 19.Chinookoswong N., Wang J.L., Shi Z.Q. Leptin restores euglycemia and normalizes glucose turnover in insulin-deficient diabetes in the rat. Diabetes. 1999;48(7):1487–1492. doi: 10.2337/diabetes.48.7.1487. [DOI] [PubMed] [Google Scholar]
- 20.Paik S.G., Fleischer N., Shin S.I. Insulin-dependent diabetes mellitus induced by subdiabetogenic doses of streptozotocin: obligatory role of cell-mediated autoimmune processes. Proceedings of the National Academy of Sciences of the United States of America. 1980;77(10):6129–6133. doi: 10.1073/pnas.77.10.6129. [DOI] [PMC free article] [PubMed] [Google Scholar]
- 21.Ayala J.E., Bracy D.P., James F.D., Julien B.M., Wasserman D.H., Drucker D.J. The glucagon-like peptide-1 receptor regulates endogenous glucose production and muscle glucose uptake independent of its incretin action. Endocrinology. 2009;150(3):1155–1164. doi: 10.1210/en.2008-0945. [DOI] [PMC free article] [PubMed] [Google Scholar]
- 22.Steele R., Wall J.S., De Bodo R.C., Altszuler N. Measurement of size and turnover rate of body glucose pool by the isotope dilution method. The American Journal of Physiology. 1956;187(1):15–24. doi: 10.1152/ajplegacy.1956.187.1.15. [DOI] [PubMed] [Google Scholar]
- 23.Kraegen E.W., James D.E., Jenkins A.B., Chisholm D.J. Dose-response curves for in vivo insulin sensitivity in individual tissues in rats. The American Journal of Physiology. 1985;248(3 Pt 1):E353–E362. doi: 10.1152/ajpendo.1985.248.3.E353. [DOI] [PubMed] [Google Scholar]
- 24.Franklin K.B.J., Paxinos G. 3rd ed. Academic Press; San Diego: 2008. The mouse brain in stereotaxic coordinates. [Google Scholar]
- 25.Munzberg H., Jobst E.E., Bates S.H., Jones J., Villanueva E., Leshan R. Appropriate inhibition of orexigenic hypothalamic arcuate nucleus neurons independently of leptin receptor/STAT3 signaling. The Journal of Neuroscience: The Official Journal of the Society for Neuroscience. 2007;27(1):69–74. doi: 10.1523/JNEUROSCI.3168-06.2007. [DOI] [PMC free article] [PubMed] [Google Scholar]
- 26.Yu X., Park B.H., Wang M.Y., Wang Z.V., Unger R.H. Making insulin-deficient type 1 diabetic rodents thrive without insulin. Proceedings of the National Academy of Sciences of the United States of America. 2008;105(37):14070–14075. doi: 10.1073/pnas.0806993105. [DOI] [PMC free article] [PubMed] [Google Scholar]
- 27.Wang M.Y., Chen L., Clark G.O., Lee Y., Stevens R.D., Ilkayeva O.R. Leptin therapy in insulin-deficient type I diabetes. Proceedings of the National Academy of Sciences of the United States of America. 2010;107(11):4813–4819. doi: 10.1073/pnas.0909422107. [DOI] [PMC free article] [PubMed] [Google Scholar]
- 28.Denroche H.C., Levi J., Wideman R.D., Sequeira R.M., Huynh F.K., Covey S.D. Leptin therapy reverses hyperglycemia in mice with streptozotocin-induced diabetes, independent of hepatic leptin signaling. Diabetes. 2011;60(5):1414–1423. doi: 10.2337/db10-0958. [DOI] [PMC free article] [PubMed] [Google Scholar]
- 29.Perry R.J., Zhang X.M., Zhang D., Kumashiro N., Camporez J.P., Cline G.W. Leptin reverses diabetes by suppression of the hypothalamic-pituitary-adrenal axis. Nature Medicine. 2014;20(7):759–763. doi: 10.1038/nm.3579. [DOI] [PMC free article] [PubMed] [Google Scholar]
- 30.Screaton R.A., Conkright M.D., Katoh Y., Best J.L., Canettieri G., Jeffries S. The CREB coactivator TORC2 functions as a calcium- and cAMP-sensitive coincidence detector. Cell. 2004;119(1):61–74. doi: 10.1016/j.cell.2004.09.015. [DOI] [PubMed] [Google Scholar]
- 31.Bittinger M.A., McWhinnie E., Meltzer J., Iourgenko V., Latario B., Liu X. Activation of cAMP response element-mediated gene expression by regulated nuclear transport of TORC proteins. Current Biology. 2004;14(23):2156–2161. doi: 10.1016/j.cub.2004.11.002. [DOI] [PubMed] [Google Scholar]
- 32.Ch'ng T.H., Uzgil B., Lin P., Avliyakulov N.K., O'Dell T.J., Martin K.C. Activity-dependent transport of the transcriptional coactivator CRTC1 from synapse to nucleus. Cell. 2012;150(1):207–221. doi: 10.1016/j.cell.2012.05.027. [DOI] [PMC free article] [PubMed] [Google Scholar]
- 33.Nonaka M., Kim R., Fukushima H., Sasaki K., Suzuki K., Okamura M. Region-specific activation of CRTC1-CREB signaling mediates long-term fear memory. Neuron. 2014;84(1):92–106. doi: 10.1016/j.neuron.2014.08.049. [DOI] [PubMed] [Google Scholar]
- 34.Lowry P.J., Chadwick A. Interrelations of some pituitary hormones. Nature. 1970;226(5242):219–222. doi: 10.1038/226219a0. [DOI] [PubMed] [Google Scholar]
- 35.Williams K.W., Margatho L.O., Lee C.E., Choi M., Lee S., Scott M.M. Segregation of acute leptin and insulin effects in distinct populations of arcuate proopiomelanocortin neurons. The Journal of Neuroscience: The Official Journal of the Society for Neuroscience. 2010;30(7):2472–2479. doi: 10.1523/JNEUROSCI.3118-09.2010. [DOI] [PMC free article] [PubMed] [Google Scholar]
- 36.Hentges S.T., Nishiyama M., Overstreet L.S., Stenzel-Poore M., Williams J.T., Low M.J. GABA release from proopiomelanocortin neurons. The Journal of Neuroscience: The Official Journal of the Society for Neuroscience. 2004;24(7):1578–1583. doi: 10.1523/JNEUROSCI.3952-03.2004. [DOI] [PMC free article] [PubMed] [Google Scholar]
- 37.Wittmann G., Hrabovszky E., Lechan R.M. Distinct glutamatergic and GABAergic subsets of hypothalamic pro-opiomelanocortin neurons revealed by in situ hybridization in male rats and mice. The Journal of Comparative Neurology. 2013;521(14):3287–3302. doi: 10.1002/cne.23350. [DOI] [PMC free article] [PubMed] [Google Scholar]
- 38.Elmquist J.K., Bjorbaek C., Ahima R.S., Flier J.S., Saper C.B. Distributions of leptin receptor mRNA isoforms in the rat brain. The Journal of Comparative Neurology. 1998;395(4):535–547. [PubMed] [Google Scholar]
- 39.Leshan R.L., Bjornholm M., Munzberg H., Myers M.G., Jr. Leptin receptor signaling and action in the central nervous system. Obesity. 2006;14(Suppl. 5):208S–212S. doi: 10.1038/oby.2006.310. [DOI] [PubMed] [Google Scholar]
- 40.Scott M.M., Lachey J.L., Sternson S.M., Lee C.E., Elias C.F., Friedman J.M. Leptin targets in the mouse brain. Journal of Comparative Neurology. 2009;514(5):518–532. doi: 10.1002/cne.22025. [DOI] [PMC free article] [PubMed] [Google Scholar]
- 41.Patterson C.M., Leshan R.L., Jones J.C., Myers M.G., Jr. Molecular mapping of mouse brain regions innervated by leptin receptor-expressing cells. Brain Research. 2011;1378:18–28. doi: 10.1016/j.brainres.2011.01.010. [DOI] [PMC free article] [PubMed] [Google Scholar]
- 42.Yoon J.C., Puigserver P., Chen G., Donovan J., Wu Z., Rhee J. Control of hepatic gluconeogenesis through the transcriptional coactivator PGC-1. Nature. 2001;413(6852):131–138. doi: 10.1038/35093050. [DOI] [PubMed] [Google Scholar]
- 43.Altarejos J.Y., Taniguchi M., Clanachan A.S., Lopaschuk G.D. Myocardial ischemia differentially regulates LKB1 and an alternate 5'-AMP-activated protein kinase kinase. The Journal of Biological Chemistry. 2005;280(1):183–190. doi: 10.1074/jbc.M411810200. [DOI] [PubMed] [Google Scholar]
- 44.Meek T.H., Matsen M.E., Damian V., Cubelo A., Chua S.C., Jr., Morton G.J. Role of melanocortin signaling in neuroendocrine and metabolic actions of leptin in male rats with uncontrolled diabetes. Endocrinology. 2014;155(11):4157–4167. doi: 10.1210/en.2014-1169. [DOI] [PMC free article] [PubMed] [Google Scholar]
- 45.Chondronikola M., Volpi E., Borsheim E., Porter C., Annamalai P., Enerback S. Brown adipose tissue improves whole-body glucose homeostasis and insulin sensitivity in humans. Diabetes. 2014;63(12):4089–4099. doi: 10.2337/db14-0746. [DOI] [PMC free article] [PubMed] [Google Scholar]
- 46.Stanford K.I., Middelbeek R.J., Townsend K.L., An D., Nygaard E.B., Hitchcox K.M. Brown adipose tissue regulates glucose homeostasis and insulin sensitivity. The Journal of Clinical Investigation. 2013;123(1):215–223. doi: 10.1172/JCI62308. [DOI] [PMC free article] [PubMed] [Google Scholar]
- 47.Collins S., Kuhn C.M., Petro A.E., Swick A.G., Chrunyk B.A., Surwit R.S. Role of leptin in fat regulation. Nature. 1996;380(6576):677. doi: 10.1038/380677a0. [DOI] [PubMed] [Google Scholar]
- 48.Elias C.F., Aschkenasi C., Lee C., Kelly J., Ahima R.S., Bjorbaek C. Leptin differentially regulates NPY and POMC neurons projecting to the lateral hypothalamic area. Neuron. 1999;23(4):775–786. doi: 10.1016/s0896-6273(01)80035-0. [DOI] [PubMed] [Google Scholar]
- 49.Cowley M.A., Smart J.L., Rubinstein M., Cerdan M.G., Diano S., Horvath T.L. Leptin activates anorexigenic POMC neurons through a neural network in the arcuate nucleus. Nature. 2001;411(6836):480–484. doi: 10.1038/35078085. [DOI] [PubMed] [Google Scholar]
- 50.Choudhury A.I., Heffron H., Smith M.A., Al-Qassab H., Xu A.W., Selman C. The role of insulin receptor substrate 2 in hypothalamic and beta cell function. The Journal of Clinical Investigation. 2005;115(4):940–950. doi: 10.1172/JCI24445. [DOI] [PMC free article] [PubMed] [Google Scholar]
- 51.Satoh N., Ogawa Y., Katsuura G., Numata Y., Masuzaki H., Yoshimasa Y. Satiety effect and sympathetic activation of leptin are mediated by hypothalamic melanocortin system. Neuroscience Letters. 1998;249(2–3):107–110. doi: 10.1016/s0304-3940(98)00401-7. [DOI] [PubMed] [Google Scholar]
- 52.Ste Marie L., Miura G.I., Marsh D.J., Yagaloff K., Palmiter R.D. A metabolic defect promotes obesity in mice lacking melanocortin-4 receptors. Proceedings of the National Academy of Sciences of the United States of America. 2000;97(22):12339–12344. doi: 10.1073/pnas.220409497. [DOI] [PMC free article] [PubMed] [Google Scholar]
- 53.Berglund E.D., Liu T., Kong X., Sohn J.W., Vong L., Deng Z. Melanocortin 4 receptors in autonomic neurons regulate thermogenesis and glycemia. Nature Neuroscience. 2014;17(7):911–913. doi: 10.1038/nn.3737. [DOI] [PMC free article] [PubMed] [Google Scholar]
- 54.Coppari R., Ichinose M., Lee C.E., Pullen A.E., Kenny C.D., McGovern R.A. The hypothalamic arcuate nucleus: a key site for mediating leptin's effects on glucose homeostasis and locomotor activity. Cell Metab. 2005;1(1):63–72. doi: 10.1016/j.cmet.2004.12.004. [DOI] [PubMed] [Google Scholar]
- 55.Kong D., Tong Q., Ye C., Koda S., Fuller P.M., Krashes M.J. GABAergic RIP-Cre neurons in the arcuate nucleus selectively regulate energy expenditure. Cell. 2012;151(3):645–657. doi: 10.1016/j.cell.2012.09.020. [DOI] [PMC free article] [PubMed] [Google Scholar]