

Abstract
MicroRNAs bind to and regulate the abundance and activity of target messenger RNA through sequestration, enhanced degradation, and suppression of translation. Although miRNA have a predominantly negative effect on the target protein concentration, several reports have demonstrated a positive effect of miRNA, i.e., increase in target protein concentration on miRNA overexpression and decrease in target concentration on miRNA repression. miRNA–target pair-specific effects such as protection of mRNA degradation owing to miRNA binding can explain some of these effects. However, considering such pairs in isolation might be an oversimplification of the RNA biology, as it is known that one miRNA interacts with several targets, and conversely target mRNA are subject to regulation by several miRNAs. We formulate a mathematical model of this combinatorial regulation of targets by multiple miRNA. Through mathematical analysis and numerical simulations of this model, we show that miRNA that individually have a negative effect on their targets may exhibit an apparently positive net effect when the concentration of one miRNA is experimentally perturbed by repression/overexpression in such a multi-miRNA multitarget situation. We show that this apparent unexpected effect is due to competition and will not be observed when miRNA interact noncompetitively with the target mRNA. This result suggests that some of the observed unusual positive effects of miRNA may be due to the combinatorial complexity of the system rather than due to any inherently unusual positive effect of the miRNA on its target.
Keywords: miRNA, mathematical model, post-transcriptional regulation, combinatorial binding
INTRODUCTION
An important layer of regulation in the multilevel gene regulation process is post-transcriptional regulation, including transcript turnover and translational control (Mata et al. 2005). A class of regulators termed microRNAs (miRNA) play an important role in post-transcriptional regulation. miRNA biogenesis and its regulation has been described in recent reviews (Krol et al. 2010; Yates et al. 2013). Mature miRNAs cause varied effects on gene expression through interaction with microRNA recognition elements (MREs), which are complementary or partially complementary sequences on their target messenger-RNA (mRNA). miRNA–mRNA interaction is combinatorial. MREs may be present on mRNA as well as noncoding transcripts both endogenous, such as long noncoding RNA, as well as synthetic RNA, such as antagomirs (Krützfeldt et al. 2005; Ebert et al. 2007). As a result, each miRNA has several binding partners including ∼100–200 target mRNA (Brennecke et al. 2005; Krek et al. 2005). Conversely, each mRNA is regulated by multiple miRNA. Estimates of the mean number of MREs on coding strands range from 2.4 to 15 (John et al. 2004; Kiriakidou et al. 2004; Savas and Tanese 2010). It is reported that ∼60% of mRNA have binding sites for one or more miRNAs in their 3′ untranslated region (3′ UTR) (van Rooij 2011). Related miRNAs such as miR-10a and miR-10b have hundreds of common targets (Martin et al. 2014). miR-206 competes with miR-344 for the MRE which is the translational control element inside the 3′ UTR thereby promoting or repressing KLF4 expression (Lin et al. 2011). miR-101a and miR-199a* bind to 3′ UTR of Cox-2 mRNA thereby controlling its expression (Chakrabarty et al. 2007).
The miRNA effectuates repression by causing either translational repression or stoichiometric/nonstoichiometric mRNA degradation (Breving and Esquela-Kerscher 2010), shown in Figure 1. Translational repression by miRNA can come about via multiple methods (Liu et al. 2005; Chekulaeva and Filipowicz 2009; McDaneld 2009; Fabian et al. 2010; Huntzinger and Izaurralde 2011), such as (i) by blocking the initiation site; (ii) by hindering the eIF4E function or its recruitment to 5′ cap of the target; (iii) by slowing down elongation owing to ribosome fall off or promotion of premature termination; or (iv) by translocation of the miRNA-target complex to processing bodies (P-bodies).The predominant action of miRNA on its targets is destabilization of target transcripts (Guo et al. 2010), which occurs through multiple mechanisms including the slicer activity of Argonaute 2, deadenylation/decapping-dependent pathways, and coordinated regulation by RNA-binding proteins and miRNA (Fabian et al. 2010; Huntzinger and Izaurralde 2011; Wu and Brewer 2012). miRNA activity has been termed as catalytic because one miRNA regulates more than one target strand. This nonstoichiometric effect is thought to be due to selective degradation of the target mRNA strand from the bound complex (Hutvágner and Zamore 2002; Baccarini et al. 2011).
FIGURE 1.

Effects of miRNA. Sequences coding for RNA and miRNA through a series of processing steps lead to formation of mRNA and functional miRNA, respectively. The miRNA complex (RISC) so formed can bind mRNA leading either to reduced rate in translation or stoichiometric/nonstoichiometric degradation of complex. Figure shows only nonstoichiometric degradation leading to recycling of miRNA.
The role of miRNA in regulation of gene expression has been long thought to be repressive in action, with decreased target transcript concentrations resulting from miRNA activity. Recent reports (Huang et al. 2012; Vasudevan 2012) demonstrate the unexpected positive role of miRNA. Overexpression of miR-223 leads to increased expression of its target GLUT4 protein expression thereby leading to increased glucose uptake (Lu et al. 2010). miR-34 binding to the 3′ UTR has been reported to lead to the up-regulation of expression of its target (Ghosh et al. 2008). The miRNA X1miR16 mediates translational activation of Myt1 gene leading to maintenance of immature state of the oocyte (Mortensen et al. 2011). The net effect of miR-466l's binding to IL-10 AU-rich elements is to prevent IL-10 mRNA degradation mediated by tristetraprolin, resulting in stability of IL-10 mRNA and elevated IL-10 expression (Ma et al. 2010). Binding of miR-10a to the 5′ end of ribosomal proteins leads to increase in their translation efficiency during amino acid starvation. Conversely, inhibition of endogenous miR-10a causes decrease in translational levels (Ørom et al. 2008).These and other examples of noncanonical miRNA signaling leading to miRNA-dependent increase in target protein expression are hypothesized to be due to increased translation and/or decreased degradation of the miRNA–mRNA complex, or feedback transcriptional activation of target gene expression (Maute et al. 2014). We have previously developed a mathematical model and predicted a parameter zone where such pair-specific positive effects are to be expected (Gokhale and Gadgil 2012). Here, we analytically show that even in the absence of such unusual pair-specific target–miRNA interactions, (apparent) unexpected positive effects may be possible as a result of the multiple interacting nonlinear effects of miRNA on common targets.
We computationally explore the possibility that the combinatorial nature of miRNA–mRNA interaction could result in observations of an apparent positive effect of miRNA when the concentration of a single miRNA is changed through knockdown/knockout or overexpression. We hypothesize that the decrease or increase in one miRNA results in a change in the distribution of all miRNA binding to a set of common targets and the observed effect on one particular target protein level is the net effect of change in the distribution of miRNA bound to that target. Mathematical models can help identify whether such a positive effect may be observed even though the miRNA's individual effect is to repress the target in a single-miRNA–single-target situation. miRNA effects have been investigated using stochastic and deterministic mathematical models that include a range of detail, summarized in Supplemental Table S1. Some minimal models, for instance, a model for miRNA action in competing endogenous RNA (ceRNA) networks (Gérard and Novák 2013), only include reversible binding of miRNA and mRNA and degradation of the complex. Others include details of miRNA biogenesis, formation of RISC (Hausser et al. 2013), stoichiometric degradation of complex, selective degradation resulting in “catalytic,” or nonstoichiometric return of miRNA from the complex (Gokhale and Gadgil 2012; Klironomos and Berg 2013), and details of translation by the bound mRNA (Zinovyev et al. 2013). An excellent review paper by Zhdanov discusses almost all the kinetic models until 2011 (Zhdanov 2011). Most models published before 2013 do not include the effect of competition, either resulting from two miRNA binding to the same target, or resulting from one miRNA that can bind to two targets with differing affinity. Several recent reviews (Taulli et al. 2013; Kartha and Subramanian 2014; Tay et al. 2014) have summarized situations where competition for the same miRNA species leads to complex regulation of target expression and discussed mathematical models for understanding this “ceRNA language.”
Multi-miRNA–multi-mRNA models have been formulated for specific modules where the targets regulate miRNA transcription, e.g., 2miRNA–2mRNA networks regulating the cell fate/differentiation decision (Lu et al. 2013; Yan et al. 2014), feedback loops with one miRNA and one target whose protein product regulates miRNA expression (Siciliano et al. 2013), or modules where one of the targets is a TF that regulates expression of the other targets (Riba et al. 2013). However, we limit our discussion to models where the target proteins have no effect on miRNA activity or concentration. A vast majority of recent models are developed to simulate and analyze the ceRNA effect, and so model at a minimum two competing (m)RNA strands and one miRNA that can bind to both. Ala et al. (2013) formulated a model for one miRNA interacting with two competing RNA, and together with bioinformatics analysis and experimental data determined the optimal conditions for ceRNA activity. Noorbakhsh et al. (2013) model and simulate the stochastic dynamics of one miRNA binding to one coding and one noncoding transcript and show that noise is a measure of the crosstalk between competing miRNA binding targets. In an excellent analysis of the combinatorial interactions between mRNA and miRNA, Figliuzzi et al. (2013b) have derived an expression for steady-state transcript and complex concentration for multiple-miRNA interacting with multiple mRNA, but focused on analysis of the sensitivity of mRNA concentrations at steady state as a function of the transcription rate of other ceRNA. Translation (by free mRNA or mRNA–miRNA complex) has not been modeled, and the analysis is limited to the effect on steady-state transcript levels. The effect of changes in miRNA transcription rate on the net target protein formation has not been studied as it was not the objective of that work. They have recently extended this analysis to the study of the dynamics of post-transcriptional regulation by ceRNA (Figliuzzi et al. 2013a). A stochastic description of multi-miRNA–multi-mRNA interactions was formulated and used (Bosia et al. 2013) to study the effect of ceRNA transcription rate on the noise of network components and the response time required to reattain steady state after a perturbation. Jia and Kulkarni (2010) have studied the effect of regulation by small RNAs on protein distribution through a model that includes translation by both bound and unbound mRNA. They assume that the concentration of the small RNA is large such that the complex formation rate is pseudo-first order in the mRNA concentration. They have extended their initial model for multiple-miRNAs regulating a single mRNA (Baker et al. 2012), retaining the assumption of pseudo-first-order reaction rates. Pseudo-first-order miRNA–mRNA interaction kinetics have also been used in a detailed model of translation (Morozova et al. 2012) to discriminate between various modes of miRNA action on translation.
To our knowledge, a detailed model for the miRNA mechanism of action that includes second-order association, nonstoichiometric mRNA degradation, and translation by the bound mRNA has not so far been used to analyze the combinatorial effect of multiple competing small RNA on a target. Here, we present such a model and use it to analyze translational modulation of a target by multiple miRNA. For simulations, we use previously reported parameters that result in intuitive effects, i.e., the effect of a single miRNA on its target is negative when there is no competition from another miRNA. We identify conditions for a 2miRNA–1mRNA system where increase in one miRNA concentration has a positive effect on the concentrations of the target, thus establishing that such an observation of an unexpected effect may not always imply any inherent positive effect of the miRNA on the target, but rather could be an observation resulting from the effect of interaction and competition. We also show that this apparent positive effect is not observed when the miRNA interact independently or noncompetitively with their common target.
RESULTS
Model for combinatorial mRNA–miRNA network
For analyzing the effect of competing miRNA, we develop a model, schematically represented in Figure 2, for a system of 2 miRNAs (μ1 and μ2) binding to and post-transcriptionally regulating expression of their common target mRNA m1. Throughout, the same symbols are used in a context-dependent manner for entities and their concentrations. We assume zero-order formation kinetics, with each μj and m1 being formed with a zero-order birth rate bjμ and b1m, respectively. We assume that m1 can bind to every miRNA μ1, μ2 with second-order association rate constants k11+, k12+, respectively. The resulting complexes c11, c12 can undergo first-order dissociation (rate constants, respectively, k11−, k12−), stoichiometric degradation (rate constants d11c, d12c), or selective degradation of either the miRNA (nonstoichiometric miRNA degradation with mRNA returned, rate constant k11retm, k12retm) or selective degradation of mRNA (nonstoichiometric mRNA degradation where miRNA is recycled, rate constant k11retμ, k12retμ). If MREs on the mRNA are overlapping, only a single miRNA can bind to the mRNA, and a “combicomplex” with both miRNA simultaneously bound to the same mRNA cannot exist. In such a competitive binding situation, miRNAs compete to bind to the mRNA. If MREs are nonoverlapping, there is a possibility of combicomplex formation where free miRNAs bind to existing complexes. This combicomplex is formed either by complex c11 binding to miRNA μ2 with second-order association rate k112+, or by complex c12 binding to μ1 with second-order association rate k121+. The complexes (c112, c11, and c12) containing mRNA, as well as the unbound mRNA (m1) can serve as a template for first-order formation of protein p1 with translation rate constants b112p, b11p, b12p, and b1p, respectively. Protein, mRNA, the two miRNAs, and combicomplex are assumed to undergo first-order degradation with rate constants d1p, d1m, d1μ, and d2μ, and d112′, respectively.
FIGURE 2.

Schematic representation for the model. mRNA (m1) associates and dissociates with miRNAs (μ1 and μ2) forming complexes c11 and c12. These complexes formed can be stoichiometrically degraded (rate constants d11c, d12c), selectively degraded (nonstoichiometric degradation, rate constants k11retm/μ and k12retm/μ), or can be associated with second miRNA to form combicomplex (c112). The combicomplex formed can be stoichiometrically degraded. mRNA, complexes, and combicomplexes translate to form protein. The rate parameters are depicted in italics and species in bold. Unfilled arrows depict catalytic formation of protein from complexes and mRNA, dashed arrows represent nonstoichiometric degradation of one species from the complex returning the other species. (Ø) Sink/source.
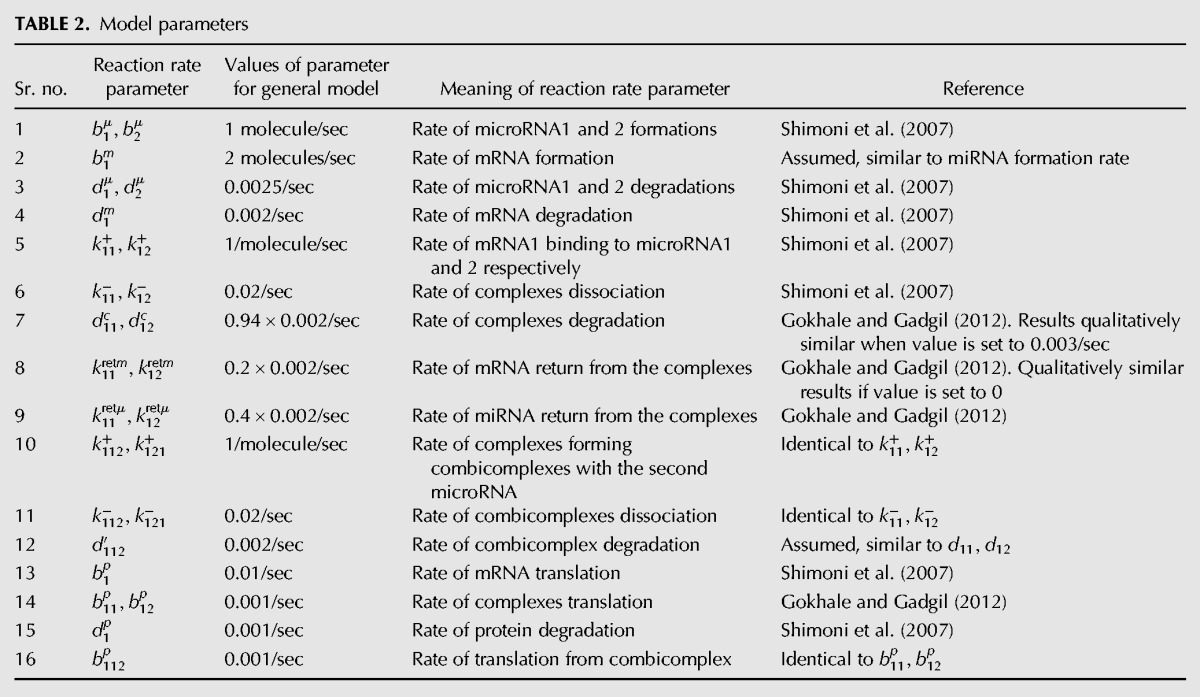
The differential equations for this system and the associated parameters are given in Tables 1 and 2, respectively. At steady state, the system of coupled nonlinear equations (stated in Supplemental Information Section S.3) can be analytically solved (Supplemental Information Section S.4) for the case when there is perfect competition. Simplification results in a cubic equation in one variable, whose solution using Mathematica is given in PDF format as Supplemental Information File 2 (Mathematica file available upon request). Using this expression for steady-state protein concentration, we calculated the scaled protein concentrations as a function of b1μ, b11p, and k11+ keeping the other parameters constant at values given in Table 2.
TABLE 1.
Differential equations for a system of two miRNA interacting with one mRNA
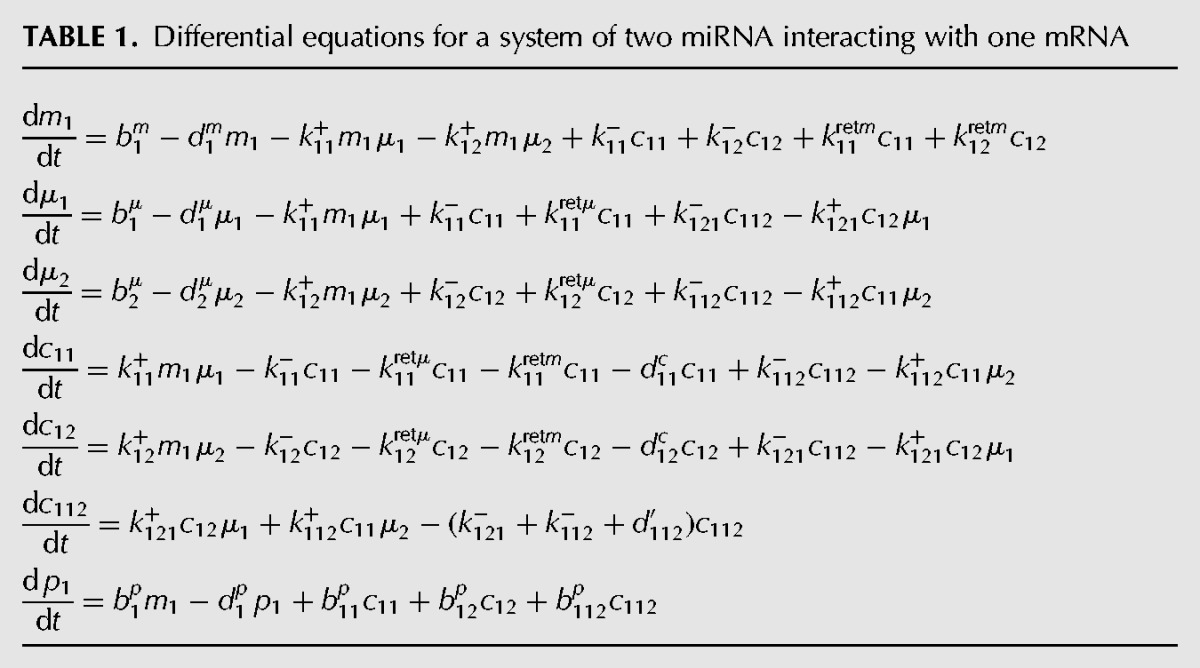
TABLE 2.
Model parameters
We first show that for these parameters, if individual miRNA effects are simulated, the effects are always intuitive or expected, i.e., increase in miRNA formation rate results in a decrease in steady-state target protein concentration when there is no competition by the other miRNA. To simulate the no-competition case, we derive the steady-state concentration for a system with just one miRNA and one mRNA. It is easy to show that this expression is given by a visually uninterpretable expression given in Equation 1. Despite the lack of elegant symmetry or amenability to simplification, the equation precisely relates the protein concentration to the values of the various reaction rate parameters. The detailed derivation and analysis is given in Supplemental Information Section S.5 (Mathematica file is available upon request).
where
| (1) |
If the ceRNA effect is to be simulated, a system of two mRNAs and one or two miRNAs can be simulated. The differential equations for a 2miRNA–2mRNA system are given in Supplemental Information Section S.6. All these conditions are special cases of a model system of M-miRNA interacting combinatorially with N-miRNAs, for which the equations and a partial solution obtained are given in Supplemental Information Sections S.1, S.2. Here, we use the analytical and numerical solution of the equations for the 2miRNA–1mRNA system at steady state to show that combinatorial complexity results in apparent unexpected positive effects attributed to miRNA.
Combinatorial regulation may lead to apparent positive effects of miRNA on target protein
First, we show that the choice of parameters used (using parameters from previous reports, see Table 2) is such that when one-miRNA–one-mRNA interactions are considered the miRNA has a negative effect on target protein concentration. For the simple case of one miRNA interacting with one target, the steady-state protein concentration is given by Equation 1. Parameters as stated in Table 2, i.e., “typical” parameters where miRNA has a negative effect on net translation rate and transcript concentration are used to calculate the reference protein concentration pref. We vary the miRNA formation rate, miRNA affinity to mRNA (association rate), and the specific rate of translation owing to the bound mRNA, keeping all these parameters in the previously published range. No set of parameters used here is chosen so as to favor an unexpected positive miRNA effect. For instance, the maximum value of the translation rate of the bound mRNA is never more than the translation rate of free mRNA, and the total degradation rate of the mRNA–miRNA complex is never lower than the degradation rate of unbound mRNA. Figure 3A shows the scaled protein ratio (i.e., protein concentration for a particular parameter combination scaled by pref) for this parameter space. If any path is traced along the b1μ-axis, i.e., for increasing values of the miRNA formation rate, for a constant value of other parameters, the colors always shift from darker to lighter, indicating a decrease in the relative target protein. This demonstrates that at any point in this space, the target protein concentration decreases with increase in the miRNA formation rate. Conversely, a decrease in the miRNA formation rate, corresponding to a knockdown experiment, leads to an increase in the target protein concentration. This conclusion is also clear from Figure 3B, which shows a few such individual paths for constant values of the translation rate constant for the complex. We are interested in a qualitative estimate of whether the system shows expected (target protein decreases with increase in miRNA formation) or unexpected (target protein increases with increase in miRNA formation) effects. The sensitivity of protein concentration to miRNA formation rate constant is a measure of whether the protein concentration will increase (positive value of sensitivity) or decrease (negative value of sensitivity) when the miRNA formation rate increases. The sensitivity values so obtained are converted into binary value to depict the parameter region when the unexpected and expected effects are observed. The slice plot for actual sensitivity value obtained is shown in Supplemental Figure S1; and the binarized value in Supplemental Figure S2. It is seen that this value is always negative, also confirming the result seen in Figure 3A,B. This is the expected effect, consistent with a negative role for miRNA in regulation of target protein levels. Keeping simulation parameters unchanged, we then investigate whether inclusion of a competing miRNA changes these results.
FIGURE 3.

(A) Scaled protein steady-state level for single mRNA–single miRNA as a function of rate of formation of miRNA1 (b1μ molecules/sec), translation by complex c11 (b11p/sec), and formation of complex c11 (k11+/molecule/sec). Position marked with × corresponds to reference values of b1μ, b11p, and k11+ as listed in Table 2. Other parameter values constant, given in Table 2. (B) Line plot of scaled protein level for one miRNA, interacting with single mRNA. Lines represents specific parts of A, for constant complex formation rate (k11+=0.2943/molecule/sec). For all constant levels of b11p, increase in rate of miRNA formation (b1μ) leads to decrease in protein ratio levels. Reference values of b1μ, b11p, and k11+ listed in Table 2 are 1 molecule/sec, 0.001/sec, and 1/molecule/sec. Other parameter values are constant, given in Table 2.
For exactly the same parameter range, we simulate the combinatorial system with two competing miRNAs and one mRNA. For this perfect competition condition, we assume that the MREs overlap such that only one miRNA can bind at a given time. Hence combicomplex formation cannot occur, and the rate constants for combicomplex formation are set to zero. The expressions for steady-state protein concentrations, with a detailed derivation are given in Supplemental Information text Sections S.3 and S.4. Parameters controlling miRNA formation, miRNA affinity to mRNA, and the translation owing to the bound mRNA are varied in exactly the same range as in Figure 3. Figure 4A,B are the equivalents of Figure 3A,B for the combinatorial regulation scenario. Figure 4A depicts the protein concentration and Figure 4B is a 2-D subset of Figure 4A depicting effect of change in miRNA formation rate on the target protein concentration. Unlike Figure 3A, in Figure 4A, one can find certain paths in the direction of increasing miRNA formation rate that go from lighter to darker shades showing an increase in the protein level. Figure 4B shows the variation of protein concentration with miRNA formation rate for the same combinations of parameters as Figure 3B. Experiments investigating the role of a specific miRNA typically measure the change in protein levels as a function of change in that miRNA level. Figure 4B represents such virtual experiments, which are lines from the surface shown in Figure 4A. Each line in Figure 4B shows the scaled protein concentration for different miRNA formation rates for fixed values of the other parameters. Different lines represent different values of the complex translation rate. It is seen that some lines, for lower translation rates, show the expected result of decrease in target protein with increase in miRNA formation rate. However, parts of other lines have a positive slope, i.e., the protein level increases with increase in miRNA formation rate. This shows the unexpected effect. From Figure 4B, it is clear that there are certain ranges in the parameter space where the steady-state target protein concentration increases with an increase in the miRNA formation rate. The range of parameter space where this effect is observed is clear from the binarized sensitivity shown in Figure 4C. The actual sensitivity values corresponding to this graph are shown in Supplemental Figure S3. Note that the range of parameter space simulated in Figure 4 is identical to that in Figure 3, where in the absence of competition the miRNA effect was the expected negative effect for the entire range of parameter combinations. This clearly demonstrates that even for parameters where the inherent effect of any single miRNA is negative, in the presence of combinatorial miRNA effects, the net effect of an increase in miRNA might be an increase in steady-state target levels, or conversely, a decrease in the miRNA formation rate might lead to a decrease in the target protein concentration, falsely suggestive of an unexpected positive role for miRNA.
FIGURE 4.

(A) Scaled protein steady-state level for two miRNAs competitively interacting with single mRNA as a function of rate of formation of miRNA2 (b2μ), translation by complex c12 (b12p), and formation of complex c12 (k12+). All three axes ranges are exactly as in Figure 3A. Position marked with × corresponds to reference values of b1μ, b11p, and k11+ as listed in Table 2. Other parameter values constant, given in Table 2. (B) Line plot of scaled protein level for two miRNA, competitively interacting with single mRNA. Lines represent specific parts of A, for constant complex formation rate (k11+=0.2943/molecule/sec). For some constant levels of b12p increase in rate of miRNA formation (b2μ) leads to increase in protein ratio levels. Reference values of b1μ, b11p, and k11+ listed in Table 2 are 1 molecule/sec, 0.001/sec, and 1/molecule/sec. Other parameter values constant, given in Table 2. (C) Binarized protein steady-state sensitivity to miRNA formation rate for two miRNAs competitively interacting with single mRNA as a function of rate of formation of miRNA2 (b2μ), translation by complex c12 (b12p), and formation of complex c12 (k12+). All three axes ranges are exactly as in Figure 3B. The two colors depict the light gray regions of expected (negative sensitivity, protein decreases with miRNA formation rate) and dark gray regions of unexpected (positive sensitivity) effects of miRNA on steady-state target protein level, in contrast with Supplemental Figure S2 for a 1miRNA–1mRNA system with the same parameters which is uniformly green (expected effect). Other parameter values are constant, given in Table 2.
Interactions between MREs lead to apparent positive effects
Figure 4A shows results for a competitive binding situation, where two miRNAs compete, presumably because the MREs are overlapping. In this situation, binding of one miRNA completely prevents binding of the other miRNA. It is unclear whether the unintuitive effect seen is due to the mere presence of the other miRNA, or whether competition between the two miRNAs is necessary. The other extreme situation when two miRNA influence a common target is that the binding of one miRNA has no effect on binding of the other miRNA. Such a noncompetitive situation is modeled; with the possibility of combicomplex formation with rates such that binding of any miRNA to bound or unbound mRNA is governed by the same parameters (as stated in Table 2). Figure 5 shows the equivalent of Figure 4B for this situation. The entire plot of scaled protein concentration for the entire parameter range is shown in Supplemental Figure S4. It is seen that all lines on Figure 5 (that correspond exactly to the translation rates shown in Figs. 3B, 4B) have a negative slope, i.e., the protein concentration as expected decreases with the miRNA formation rate irrespective of the value of the complex translation rate. It is clear that the apparent positive effects seen in Figure 4B are completely abrogated when miRNA are allowed to independently bind and regulate mRNA.
FIGURE 5.

Line plot of scaled protein level for two miRNA, noncompetitively interacting with single mRNA. Lines represent specific parts of Supplemental Figure S3. For every constant level of b12p increase in rate of miRNA formation b2μ leads to decrease in protein ratio levels. Other parameter values are constant, given in Table 2.
DISCUSSION
Several models have considered the implications of RNA species (ceRNA) competing for the same miRNA. Here we for the first time present the use of a comprehensive model for miRNA action to investigate the effect of multiple-miRNA competing for the same mRNA that includes second-order association with miRNA, translation by free and bound mRNA, and nonstoichiometric/stoichiometric degradation of mRNA. We model overexpression/down-regulation as a corresponding change in the miRNA formation rate leading to a correlated change in the total miRNA concentration. We use the model to investigate the possibility of observing positive effects of miRNA, i.e., an increase in target protein concentration when the miRNA formation is increased in an overexpression experiment or equivalently a decrease in target protein concentration when the miRNA formation is decreased in a knockout/knockdown experiment. The actual mode of action has been previously modeled in great detail. We believe that this model can serve as a framework to study the effect of competition among competing miRNAs on the concentration of their common target.
Several low- and high-throughput methods have been used to identify miRNA targets (Tarang and Weston 2014). Several recent experimental studies on single miRNA report the observation of nonintuitive effects of miRNA on their target transcript and/or protein levels, in both miRNA overexpression and knockdown experiments. Genome-wide analysis of miRNAs and targets leads to the observation that predicted target mRNA expression is anti-correlated (as expected) but often not correlated, or (unexpectedly) positively correlated with miRNA expression. An elaborate study (Nicolas et al. 2008) of the effect of overexpression and knockdown of the same miRNA in the same model system resulted in the finding that there were 21 targets with a 6-mer seed match that consistently changed in both experimental conditions, but none of them were predicted by computational tools. Conversely, even such an elaborate experiment failed to identify a previously validated target as its transcript level did not change. The study also reported a distribution of differential expression levels spanning both up- and down-regulation of transcripts with seed sequence matches following either overexpression or knockdown of miRNA indicating the presence of both expected and unexpected effects on putative targets. In a study of non-small cell lung cancer tissue (Ma et al. 2011), of the target genes with conserved miRNA binding sites, 10.5% were anti-correlated, 10.1% were correlated and 79.4% genes showed no correlation with the miRNA expression. Typically, only the set of mRNA with anti-correlated levels is selected for further study presumably under the implicit assumption that the unexpected behavior either results from indirect effects or experimental/assay error. As a result, valid miRNA targets may be omitted from analysis. It is therefore important to analyze the potential causes for positive correlation and lack of correlation beyond the simple explanations of indirect effects.
We have previously constructed a comprehensive model for a single mRNA interacting with a single miRNA and shown that such positive effects can indeed be observed for pair-specific effects that are mathematically represented as certain regions of parameter space. The mechanistic implication of these parameter regions are situations where the miRNA binding stabilizes the transcript, or enhances the translation rate, or both. Such mechanisms have also been experimentally reported.
However, a majority of individual miRNA–mRNA interactions reported to date demonstrate a negative regulation of target protein levels by the miRNA. In this paper, we show that even when this is the case, the combinatorial effects of miRNA can lead to situations where for certain biologically feasible regions of parameter space, there is an apparent positive effect of miRNA, i.e., steady-state target protein concentrations are positively correlated with miRNA formation rate. The unique advantage of a mechanism-based mathematical model is that it enables dissection of the causes for such unintuitive observations. We have carried out an analysis of the model similar to the result shown in Figure 5, where we changed the system to simulate a perfectly noncompetitive system. Simulation of a range of partial competition scenarios where the binding of one miRNA to the common target retards but does not completely inhibit the binding of the other miRNA (results not shown here) shows that while partial competition also leads to nonintuitive effects as seen in Figure 4, a milder effect close to the perfect-noncompetition case abrogates such an effect, and the results are similar to those shown in Figure 5. In this model, we have allowed the possibility of nonstoichiometric degradation where the mRNA–miRNA can selective degrade such that only the miRNA or only the mRNA component is degraded. While there are several reports of selective degradation of mRNA and recycling of miRNA, we are not aware of any reports of selective degradation of miRNA. However, even upon setting the rate constant for this process to zero, the results obtained are similar to those reported here, indicating that selective miRNA degradation is not required for observing the nonintuitive effect reported in this paper.
It is instructive to analyze the regions of the parameter space where the nonintuitive effects are observed, i.e., the darker areas in Figure 4C. The steady-state protein level depends on the steady-state levels of the free mRNA and the miRNA–mRNA complexes c11 and c12. In particular, it can be written as a weighted sum of mRNA in these three states as p1 = (b1p[m1] + b11pc11 + b12pc12)/d1p, where the weights are the translation efficiencies of the free and bound forms. The relative concentration of these forms depends on the miRNA interaction with the mRNA. There are three key parameters that determine the miRNA action, which are the three axes in Figure 4A,C. The miRNA formation rate controls the total miRNA present, the rate of association or complex formation controls the affinity of the miRNA for the mRNA, and the rate of translation, which is always less than the rate of translation by unbound mRNA, defines the effectiveness of the repression by miRNA. The relative parameters for the two miRNA determine the apparent response. In Figure 4, all c12 translation rates simulated are at values lower than the value for m1 but some values are taken higher and some lower than the constant translation rate for c11. When the association rate is higher and c12 translation rate is higher than the corresponding values for c11, miRNA2 binds better but does not repress as much. Therefore, when its concentration of miRNA2 is decreased by decrease in its formation rate, the fraction of mRNA bound by miRNA1 is larger, resulting in a net higher repression of translation and therefore a lower target protein concentration. The overall effect observed is that a decrease in miRNA2 formation rate has resulted in a decrease in its target protein, i.e., a counterintuitive effect. For this simulation the total degradation rate of each of the complexes was comparable with (though not higher than) the degradation rate for unbound mRNA. Similar results are obtained when the stoichiometric degradation rate of each complex is assumed to be 50% higher than the degradation rate constant for unbound mRNA. Conversely, when the concentration of miRNA2 is increased by increase in its formation rate, the fraction of mRNA bound by miRNA1 is lower, resulting in a net lower repression of translation and therefore a higher target protein concentration. The overall effect observed is that an increase in miRNA2 formation rate has resulted in an increase in its target protein, i.e., a counterintuitive effect.
A similar analogy can be constructed for miRNA2 binding better but the complex c12 being more stable than c11 (even when neither complex is more stable than unbound mRNA). As the concentration of miRNA2 is decreased, the other takes its place, but the net effect is a decrease in target protein levels as the complex is more unstable. Again, a reduction in miRNA2 level leads to a decrease in target protein, incorrectly suggesting that miRNA2 has a positive effect on target protein. However as the effects are expected to be not as simple, a mathematical model is needed to analyze a complicated scenario such as when the miRNA2 binding is more favorable than that of miRNA1, and c12 translates as well as degrades more efficiently than c11.
We have independently varied the parameters for miRNA formation, binding and effect on translation in order to simulate behavior in this parameter space. It might be the case for certain miRNA that the parameters are correlated, i.e., higher binding affinity may be associated with a lower translation rate and higher degradation rate for the bound mRNA. However, diametrically opposite situations with translational repression when there is a partial match, and translational enhancement when there is increasing base-pairing has also been reported (Saraiya et al. 2013). So we choose to avoid making assumptions about the covariance of various parameters. If certain regions of parameter space are not accessible physically for a particular pair of miRNAs and mRNAs, then clearly the predicted effects for that space will not be true. It is also clear from the simulations that the unintuitive effect will not be seen for all possible parameter combinations. For instance, when the miRNA does not significantly bind to the mRNA, a change in its formation rate is unlikely to lead to a change in the target protein level. The identification of miRNA as a regulator of target protein expression has logically led to development of mathematical models that analyze the interaction of a single miRNA with one target. These models are sufficient to predict and explain results on the effect of experimental changes in target mRNA. However, we believe that our analysis for the first time shows that reduction of the reaction system to a 1miRNA–1mRNA system results in the inability to anticipate unexpected experimental results from experiments where the miRNA expression is changed and there are multiple miRNA competing for the mRNA. This inability might erroneously spur the search for an unusual mechanism when the real explanation lies in the complexity of the system, not the unusualness of individual interactions.
At a different scale, efforts to construct a genome-scale network of miRNA–mRNA interactions have been reported. A genome-scale network of miRNA, lncRNA, and mRNA has been constructed (Jalali et al. 2013). Dynamics within such networks, and the role of miRNA in propagation of dynamics has been reported (Gérard and Novák 2013). However, models on this scale owing to computational/analysis constraints use minimal models for miRNA–mRNA interactions, for instance, ignoring nonstoichiometric effects, or translation of bound complex. Models for two (m)RNA competing for one miRNA have been used to analyze the ceRNA language. We believe that the model presented here is an appropriate tool to investigate systems with competing miRNA, and in general for combinatorial competition the model for two miRNA interacting with two mRNA presents an optimal scale where the model is “as simple as possible but not simpler” in that it is amenable to analysis yet contains the complexity needed to explain and predict emergent properties such as the apparent positive effect of miRNA predicted in this paper.
MATERIALS AND METHODS
Analysis for 1mRNA–1miRNA system
For the simplest model that has one miRNA and its sole target mRNA, we use Equation 1 to calculate the steady-state protein concentration. We calculate the steady-state concentrations p for different combinations of b1μ, b11p, and k11+ keeping the other parameters constant at values as stated in Table 2. We define a scaled concentration where pref is the protein steady-state concentration when the parameters are the “reference” values given in Table 2. To determine the sensitivity of steady-state target protein level for specific rate of miRNA synthesis, partial derivative of the protein steady-state concentration is calculated with respect to miRNA formation rate using Mathematica. The sensitivity was calculated as a function of b1μ, b11p, and k11+. The plot obtained is converted into binary form where values less than zero are labeled as “negative” and the values greater than zero are labeled as “positive.” This gives a clear idea of the regions where increase in miRNA leads to increase in target protein levels. All the simulations were carried out using MATLAB (MathWorks) version 7.14.0.739 (R2012a) and symbolic calculation using Mathematica (Wolfram) version 7.
Numerical simulation for 1mRNA–2miRNA system
This is a competitive model where no combicomplexes are formed. The “competition” may be due to the two miRNAs competing for the same or overlapping binding sites on the target mRNA, or due to “allosteric” effects where binding of one miRNA results in a conformational change preventing the binding of the other miRNA. As in the previous section, we calculate the steady-state concentrations as a function of b2μ, b12p, and k12+ keeping the other parameters constant at values as stated in Table 2 (except the rate of combicomplex formation, which is set to zero).
Log-transformed plot for scaled protein steady-state concentrations is drawn as for the 1miRNA–1mRNA model. Line plot is obtained for change in specific rate of translation and miRNA formation by extracting values from the scaled concentration table keeping the complex formation rate constant. A similar analysis was performed for noncompetitive model. Sensitivity analysis is carried out as before using Mathematica. The discretization of sensitivity is identical to that for the 1mRNA–1miRNA model.
Two extreme situations are modeled: perfect competition for the same MRE, and independent binding of the two miRNAs to separate MREs. In the former case, the combicomplex formation rate is set to zero, i.e., no further miRNA binding can take place when either of the miRNAs are bound to the mRNA. In the latter case, the association/dissociation constants for miRNA binding to free mRNA is assumed to be the same as the association/dissociation constants for that miRNA binding to a complex of the target mRNA with the other mRNA, i.e., the fact that the mRNA is associated with another miRNA does not influence the binding at all.
SUPPLEMENTAL MATERIAL
Supplemental material is available for this article.
Supplementary Material
ACKNOWLEDGMENTS
We thank aperiodic funding from the University Grants Commission (UGC-SRF to D.N.) and Council of Scientific and Industrial Research (CSIR) (BSC 0124, NCL-IGIB JRI). We sincerely thank Sucheta Gokhale, NCL and Beena Pillai, IGIB for useful discussions and suggestions.
Author contributions: C.J.G. conceived of the project and formulated initial models. D.N. carried out the model analysis and all computations. D.N. and C.J.G. analyzed the results. D.N. wrote the initial draft of the manuscript; both authors participated in writing the later versions.
Footnotes
Article published online ahead of print. Article and publication date are at http://www.rnajournal.org/cgi/doi/10.1261/rna.046862.114.
REFERENCES
- Ala U, Karreth FA, Bosia C, Pagnani A, Taulli R, Léopold V, Tay Y, Provero P, Zecchina R, Pandolfi PP 2013. Integrated transcriptional and competitive endogenous RNA networks are cross-regulated in permissive molecular environments. Proc Natl Acad Sci 110: 7154–7159. [DOI] [PMC free article] [PubMed] [Google Scholar]
- Baccarini A, Chauhan H, Gardner TJ, Jayaprakash AD, Sachidanandam R, Brown BD 2011. Kinetic analysis reveals the fate of a microRNA following target regulation in mammalian cells. Curr Biol 21: 369–376. [DOI] [PMC free article] [PubMed] [Google Scholar]
- Baker C, Jia T, Kulkarni RV 2012. Stochastic modeling of regulation of gene expression by multiple small RNAs. Phys Rev E Stat Nonlin Soft Matter Phys 85: 061915. [DOI] [PubMed] [Google Scholar]
- Bosia C, Pagnani A, Zecchina R 2013. Modelling competing endogenous RNA networks. PLoS One 8: e66609. [DOI] [PMC free article] [PubMed] [Google Scholar]
- Brennecke J, Stark A, Russell RB, Cohen SM 2005. Principles of microRNA-target recognition. PLoS Biol 3: e85. [DOI] [PMC free article] [PubMed] [Google Scholar]
- Breving K, Esquela-Kerscher A 2010. The complexities of microRNA regulation: mirandering around the rules. Int J Biochem Cell Biol 42: 1316–1329. [DOI] [PubMed] [Google Scholar]
- Chakrabarty A, Tranguch S, Daikoku T, Jensen K, Furneaux H, Dey SK 2007. MicroRNA regulation of cyclooxygenase-2 during embryo implantation. Proc Natl Acad Sci 104: 15144–15149. [DOI] [PMC free article] [PubMed] [Google Scholar]
- Chekulaeva M, Filipowicz W 2009. Mechanisms of miRNA-mediated post-transcriptional regulation in animal cells. Curr Opin Cell Biol 21: 452–460. [DOI] [PubMed] [Google Scholar]
- Ebert MS, Neilson JR, Sharp PA 2007. MicroRNA sponges: competitive inhibitors of small RNAs in mammalian cells. Nat Methods 4: 721–726. [DOI] [PMC free article] [PubMed] [Google Scholar]
- Fabian MR, Sonenberg N, Filipowicz W 2010. Regulation of mRNA translation and stability by microRNAs. Annu Rev Biochem 79: 351–379. [DOI] [PubMed] [Google Scholar]
- Figliuzzi M, De Martino A, Marinari E 2013a. RNA-based regulation: dynamics and response to perturbations of competing RNAs. Biophys J 107: 1011–1022. [DOI] [PMC free article] [PubMed] [Google Scholar]
- Figliuzzi M, Marinari E, De Martino A 2013b. MicroRNAs as a selective channel of communication between competing RNAs: a steady-state theory. Biophys J 104: 1203–1213. [DOI] [PMC free article] [PubMed] [Google Scholar]
- Gérard C, Novák B 2013. microRNA as a potential vector for the propagation of robustness in protein expression and oscillatory dynamics within a ceRNA network. PLoS One 8: e83372. [DOI] [PMC free article] [PubMed] [Google Scholar]
- Ghosh T, Soni K, Scaria V, Halimani M, Bhattacharjee C, Pillai B 2008. MicroRNA-mediated up-regulation of an alternatively polyadenylated variant of the mouse cytoplasmic β-actin gene. Nucleic Acids Res 36: 6318–6332. [DOI] [PMC free article] [PubMed] [Google Scholar]
- Gokhale SA, Gadgil CJ 2012. Analysis of miRNA regulation suggests an explanation for ‘unexpected’ increase in target protein levels. Mol Biosyst 8: 760–765. [DOI] [PubMed] [Google Scholar]
- Guo H, Ingolia NT, Weissman JS, Bartel DP 2010. Mammalian microRNAs predominantly act to decrease target mRNA levels. Nature 466: 835–840. [DOI] [PMC free article] [PubMed] [Google Scholar]
- Hausser J, Syed AP, Selevsek N, van Nimwegen E, Jaskiewicz L, Aebersold R, Zavolan M 2013. Timescales and bottlenecks in miRNA-dependent gene regulation. Mol Syst Biol 9: 711. [DOI] [PMC free article] [PubMed] [Google Scholar]
- Huang V, Place RF, Portnoy V, Wang J, Qi Z, Jia Z, Yu A, Shuman M, Yu J, Li LC 2012. Upregulation of Cyclin B1 by miRNA and its implications in cancer. Nucleic Acids Res 40: 1695–1707. [DOI] [PMC free article] [PubMed] [Google Scholar]
- Huntzinger E, Izaurralde E 2011. Gene silencing by microRNAs: contributions of translational repression and mRNA decay. Nat Rev Genet 12: 99–110. [DOI] [PubMed] [Google Scholar]
- Hutvágner G, Zamore PD 2002. A microRNA in a multiple-turnover RNAi enzyme complex. Science 297: 2056–2060. [DOI] [PubMed] [Google Scholar]
- Jalali S, Bhartiya D, Lalwani MK, Sivasubbu S, Scaria V 2013. Systematic transcriptome wide analysis of lncRNA-miRNA interactions. PLoS One 8: e53823. [DOI] [PMC free article] [PubMed] [Google Scholar]
- Jia T, Kulkarni RV 2010. Post-transcriptional regulation of noise in protein distributions during gene expression. Phys Rev Lett 105: 018101. [DOI] [PubMed] [Google Scholar]
- John B, Enright AJ, Aravin A, Tuschl T, Sander C, Marks DS 2004. Human microRNA targets. PLoS Biol 2: e363. [DOI] [PMC free article] [PubMed] [Google Scholar]
- Kartha RV, Subramanian S 2014. Competing endogenous RNAs (ceRNAs): new entrants to the intricacies of gene regulation. Front Genet 5: 8. [DOI] [PMC free article] [PubMed] [Google Scholar]
- Kiriakidou M, Nelson PT, Kouranov A, Fitziev P, Bouyioukos C, Mourelatos Z, Hatzigeorgiou A 2004. A combined computational-experimental approach predicts human microRNA targets. Genes Dev 18: 1165–1178. [DOI] [PMC free article] [PubMed] [Google Scholar]
- Klironomos FD, Berg J 2013. Quantitative analysis of competition in posttranscriptional regulation reveals a novel signature in target expression variation. Biophys J 104: 951–958. [DOI] [PMC free article] [PubMed] [Google Scholar]
- Krek A, Grün D, Poy MN, Wolf R, Rosenberg L, Epstein EJ, MacMenamin P, da Piedade I, Gunsalus KC, Stoffel M, et al. 2005. Combinatorial microRNA target predictions. Nat Genet 37: 495–500. [DOI] [PubMed] [Google Scholar]
- Krol J, Loedige I, Filipowicz W 2010. The widespread regulation of microRNA biogenesis, function and decay. Nat Rev Genet 11: 597–610. [DOI] [PubMed] [Google Scholar]
- Krützfeldt J, Rajewsky N, Braich R, Rajeev KG, Tuschl T, Manoharan M, Stoffel M 2005. Silencing of microRNAs in vivo with ‘antagomirs’. Nature 438: 685–689. [DOI] [PubMed] [Google Scholar]
- Lin CC, Liu LZ, Addison JB, Wonderlin WF, Ivanov AV, Ruppert JM 2011. A KLF4-miRNA-206 autoregulatory feedback loop can promote or inhibit protein translation depending upon cell context. Mol Cell Biol 31: 2513–2527. [DOI] [PMC free article] [PubMed] [Google Scholar]
- Liu J, Valencia-Sanchez MA, Hannon GJ, Parker R 2005. MicroRNA-dependent localization of targeted mRNAs to mammalian P-bodies. Nat Cell Biol 7: 719–723. [DOI] [PMC free article] [PubMed] [Google Scholar]
- Lu H, Buchan RJ, Cook SA 2010. MicroRNA-223 regulates Glut4 expression and cardiomyocyte glucose metabolism. Cardiovasc Res 86: 410–420. [DOI] [PubMed] [Google Scholar]
- Lu M, Jolly MK, Levine H, Onuchic JN, Ben-Jacob E 2013. MicroRNA-based regulation of epithelial-hybrid-mesenchymal fate determination. Proc Natl Acad Sci 110: 18144–18149. [DOI] [PMC free article] [PubMed] [Google Scholar]
- Ma F, Liu X, Li D, Wang P, Li N, Lu L, Cao X 2010. MicroRNA-466l upregulates IL-10 expression in TLR-triggered macrophages by antagonizing RNA-binding protein tristetraprolin-mediated IL-10 mRNA degradation. J Immunol 184: 6053–6059. [DOI] [PubMed] [Google Scholar]
- Ma L, Huang Y, Zhu W, Zhou S, Zhou J, Zeng F, Liu X, Zhang Y, Yu J 2011. An integrated analysis of miRNA and mRNA expressions in non-small cell lung cancers. PLoS One 6: e26502. [DOI] [PMC free article] [PubMed] [Google Scholar]
- Martin H, Wani S, Steptoe AL, Krishnan K, Nones K, Nourbakhsh E, Vlassov A, Grimmond S, Cloonan N 2014. Imperfect centered miRNA binding sites are common and can mediate repression of target mRNAs. Genome Biol 15: R51. [DOI] [PMC free article] [PubMed] [Google Scholar]
- Mata J, Marguerat S, Bähler J 2005. Post-transcriptional control of gene expression: a genome-wide perspective. Trends Biochem Sci 30: 506–514. [DOI] [PubMed] [Google Scholar]
- Maute RL, Dalla-Favera R, Basso K 2014. RNAs with multiple personalities. Wiley Interdiscip Rev RNA 5: 1–13. [DOI] [PubMed] [Google Scholar]
- McDaneld TG 2009. MicroRNA: mechanism of gene regulation and application to livestock. J Anim Sci 87: E21–E28. [DOI] [PubMed] [Google Scholar]
- Morozova N, Zinovyev A, Nonne N, Pritchard LL, Gorban AN, Harel-Bellan A 2012. Kinetic signatures of microRNA modes of action. RNA 18: 1635–1655. [DOI] [PMC free article] [PubMed] [Google Scholar]
- Mortensen RD, Serra M, Steitz JA, Vasudevan S 2011. Posttranscriptional activation of gene expression in Xenopus laevis oocytes by microRNA-protein complexes (microRNPs). Proc Natl Acad Sci 108: 8281–8286. [DOI] [PMC free article] [PubMed] [Google Scholar]
- Nicolas FE, Pais H, Schwach F, Lindow M, Kauppinen S, Moulton V, Dalmay T 2008. Experimental identification of microRNA-140 targets by silencing and overexpressing miR-140. RNA 14: 2513–2520. [DOI] [PMC free article] [PubMed] [Google Scholar]
- Noorbakhsh J, Lang AH, Mehta P 2013. Intrinsic noise of microRNA-regulated genes and the ceRNA hypothesis. PLoS One 8: e72676. [DOI] [PMC free article] [PubMed] [Google Scholar]
- Ørom UA, Nielsen FC, Lund AH 2008. MicroRNA-10a binds the 5′ UTR of ribosomal protein mRNAs and enhances their translation. Mol Cell 30: 460–471. [DOI] [PubMed] [Google Scholar]
- Riba A, Bosia C, El Baroudi M, Ollino L, Caselle M 2013. A combination of transcriptional and microRNA regulation improves the stability of the relative concentrations of target genes. PLoS Comput Biol 10: e1003490. [DOI] [PMC free article] [PubMed] [Google Scholar]
- Saraiya AA, Li W, Wang CC 2013. Transition of a microRNA from repressing to activating translation depending on the extent of base pairing with the target. PLoS One 8: e55672. [DOI] [PMC free article] [PubMed] [Google Scholar]
- Savas JN, Tanese N 2010. A combined immunoprecipitation, mass spectrometric and nucleic acid sequencing approach to determine microRNA-mediated post-transcriptional gene regulatory networks. Brief Funct Genomics 9: 24–31. [DOI] [PMC free article] [PubMed] [Google Scholar]
- Shimoni Y, Friedlander G, Hetzroni G, Niv G, Altuvia S, Biham O, Margalit H 2007. Regulation of gene expression by small non-coding RNAs: a quantitative view. Mol Syst Biol 3: 138. [DOI] [PMC free article] [PubMed] [Google Scholar]
- Siciliano V, Garzilli I, Fracassi C, Criscuolo S, Ventre S, di Bernardo D 2013. miRNAs confer phenotypic robustness to gene networks by suppressing biological noise. Nat Commun 4: 2364. [DOI] [PMC free article] [PubMed] [Google Scholar]
- Tarang S, Weston MD 2014. Macros in microRNA target identification: a comparative analysis of in silico, in vitro, and in vivo approaches to microRNA target identification. RNA Biol 11: 324–333. [DOI] [PMC free article] [PubMed] [Google Scholar]
- Taulli R, Loretelli C, Pandolfi PP 2013. From pseudo-ceRNAs to circ-ceRNAs: a tale of cross-talk and competition. Nat Struct Mol Biol 20: 541–543. [DOI] [PMC free article] [PubMed] [Google Scholar]
- Tay Y, Rinn J, Pandolfi PP 2014. The multilayered complexity of ceRNA crosstalk and competition. Nature 505: 344–352. [DOI] [PMC free article] [PubMed] [Google Scholar]
- van Rooij E 2011. The art of microRNA research. Circ Res 108: 219–234. [DOI] [PubMed] [Google Scholar]
- Vasudevan S 2012. Posttranscriptional upregulation by microRNAs. Wiley Interdiscip Rev RNA 3: 311–330. [DOI] [PubMed] [Google Scholar]
- Wu X, Brewer G 2012. The regulation of mRNA stability in mammalian cells: 2.0. Gene 500: 10–21. [DOI] [PMC free article] [PubMed] [Google Scholar]
- Yan F, Liu H, Liu Z 2014. Dynamic analysis of the combinatorial regulation involving transcription factors and microRNAs in cell fate decisions. Biochim Biophys Acta 1844: 248–257. [DOI] [PubMed] [Google Scholar]
- Yates LA, Norbury CJ, Gilbert RJ 2013. The long and short of microRNA. Cell 153: 516–519. [DOI] [PubMed] [Google Scholar]
- Zhdanov VP 2011. Kinetic models of gene expression including non-coding RNAs. Phys Rep 500: 1–42. [Google Scholar]
- Zinovyev A, Morozova N, Gorban A, Harel-Belan A 2013. Mathematical modeling of microRNA–mediated mechanisms of translation repression. In MicroRNA cancer regulation, Vol. 774 (ed. Schmitz U, et al. ), pp. 189–224 Springer, Dordrecht, The Netherlands. [DOI] [PubMed] [Google Scholar]
Associated Data
This section collects any data citations, data availability statements, or supplementary materials included in this article.